DOI: 10.12928/TELKOMNIKA.v13i3.1790 759
Reconfiguration of Distribution Network with
Distributed Energy Resources Integration Using PSO
Algorithm
Ramadoni Syahputra*1, Imam Robandi2, Mochamad Ashari2 1
Department of Electrical Engineering, Universitas Muhammadiyah Yogyakarta, Jl. Ringroad Barat Tamantirto, Kasihan, Yogyakarta, Indonesia 55183, Phone: +62-274-387656
2
Department of Electrical Engineering, Institut Teknologi Sepuluh Nopember, Sukolilo, Surabaya, Indonesia 60111, Phone: +62-31-5947302
*Corresponding author, e-mail: [email protected], [email protected], [email protected]
Abstract
This paper presents optimal reconfiguration of radial distribution network with integration of distributed energy resources (DER) using modified particle swarm optimization (PSO) algorithm. The advantages of integration of DER in distribution system are minimizing power losses, improving voltage profiles and load factors, eliminating system upgrades, and reducing environmental impacts. However, the presence of DER could also cause technical problems in voltage quality and system protection. Optimal reconfiguration of distribution network is subjected to minimize power loss and to improve voltage profile in order to enhance the efficiency the distribution system. In this study, reconfiguration method is based on an improved PSO. The method has been tested in a 60-bus Bantul distribution network of Yogyakarta Special Region province, Indonesia. The simulation results show that optimal reconfiguration of the network with integration of DER has successfully enhancing the efficiency of the distribution system.
Keywords: distribution network, reconfiguration, efficiency, modified particle swarm optimization, distributed energy resources.
Copyright © 2015 Universitas Ahmad Dahlan. All rights reserved.
1. Introduction
using the musical process of harmony searching in perfect state. The use of fuzzy multi-objective technique for optimal network reconfiguration has been presented in [1, 2], and [16]. The technique of particle swarm optimization (PSO) for network reconfiguration purpose has been presented in [17-18]. In their work, criteria for selecting a membership function for each objective are not provided, so reduction of losses has yet to reach optimal results.
In recent years, the application of renewable energy sources has become popular because of depleting supplies of fossil energy and environmental issues. Indonesia has committed to utilizing renewable energy sources to generate electricity. Many potential areas for development of DER, one of which Bantul, Yogyakarta Special Region province. Generation of electricity derived from renewable energy sources is called distributed energy resources (DER) [19-20]. The advantages of DER integration in distribution system are reducing power losses, improving voltage profiles and load factors, eliminating system upgrades and reducing environmental impacts [21-22]. Integration of DER in distribution system has become an interesting challenge for researchers to find the most appropriate method in the planning and operation of the distribution system [23-24]. In this paper, an modified PSO algorithm is presented to solve distribution network reconfiguration problem in the presence of distributed energy resources for reducing power loss and improving voltage profile while radially of the network is maintained. In this study, all objective functions are simultaneously weighted, which is a new issue in a multi-objective optimization [1-2]. The PSO approach is tested in a 60-bus Bantul distribution network of Yogyakarta Special Region province, Indonesia.
2. Research Method 2.1. Problem Formulation
The purpose of optimization of distribution network is to minimize power losses and to improve voltage profile while radiality of the network is maintained. The optimization constraints are load flow equations, upper and lower limits of bus voltages, and upper and lower limits of line currents. Formulation of power loss minimization can be expressed as follows:
2.2. Modified Particle Swarm Optimization
)
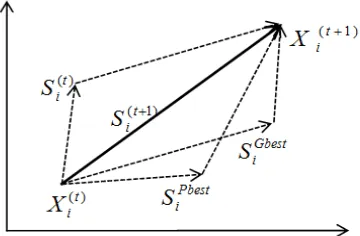
Equation (5) determines the velocity vector of the i-th particle. Therefore, the latest position of the particle can be determined by using the equation:
)
Inertia weights ω can be determined by the equation:
t
maximum number of iterations; and t is the actual number of iterations. The value of inertia weight decrease linearly from 0.9 to 0.4.
Figure 1. The optimization concept using PSO
The modified PSO algorithm is described as follows:
1. Input the data of distribution network and initialize the parameters of PSO.
2. Run the program of power flow to measure the fitness (active power loss) of each particle (pbest) and store it with the best value of fitness (gbest).
3. Update velocity of particle using (5). 4. Update position of particle using (6).
5. Decrease the inertia weight (ω) linearly from 0.9 to 0.4. 6. Perform violation of particle position:
If particle position pos(j)>mp, then pos(j)=mp Else if particle position pos(j)<mp, then pos(j)=1. 7. Perform violation of particle velocity:
If particle velocity vel(j)>mv, then vel(j)=mv
Else if particle velocity vel(j)<-mv, then pos(j)= -mv. 8. Decrease the inertia weight (ω) linearly from 0.9 to 0.4. 9. Repeat steps 2-8 until a criteria is obtained.
3. Results and Discussion
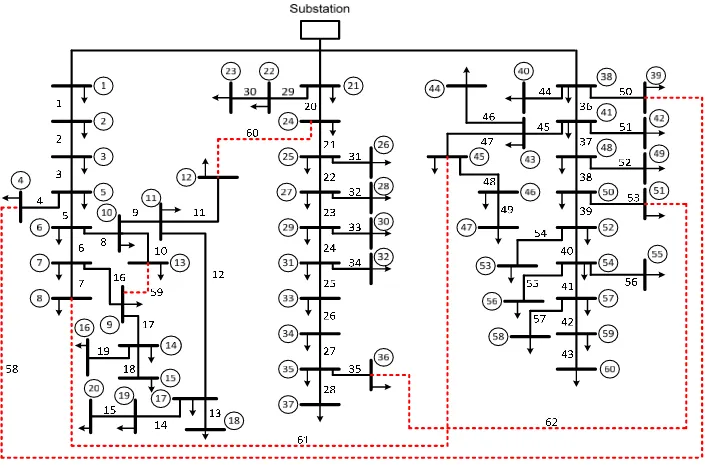
In the section, the improved PSO algorithm is tested on a practical 60-bus Bantul power distribution system. Bantul power distribution system is located in district of Bantul, Yogyakarta Special Region. Yogyakarta Special Region is one of the provinces in Indonesia which is located in Java islands. The results of optimal reconfiguration of 60-bus 20-kV Bantul radial distribution network with DER integration using the proposed method to minimize active power losses and to improve the voltage quality of the system are presented. The system consists of 13 feeders that are powered by two 60 MVA power transformers, but this study has focused only on feeders of 6, 7, and 11. Selection of the three feeders is because the most complex in terms of network length, number of loads, and potential integration of DER. The system has 60 buses and 57 sections, as shown in Figure 2. The switch of the system consists of 57 sectionalizing switches and 5 tie switches. Sectionalizing switches of the system are closed in normal conditions while tie switches are open in normal conditions. Load and branch data of the 60-bus distribution network can be found in [13]. The five tie switches are 58, 59, 60, 61 and 62. The total load of the radial system is 26547 kW and the initial power loss of the system is 656.20 kW. The base of the system is V=20 kV and S=60 MVA.
Figure 2. 60-bus Yogyakarta radial distribution network in initial configuration
Table 1. DER Location and Capacity of 60-Bus Yogyakarta Radial Distribution System Bus
Number
DER Active Power (kW)
DER Power Factor
DER Reactive Power (kVAr)
8 250 0.8 187.50 13 250 0.9 121.08
20 300 1 0
32 400 0.9 193.73
36 300 1 0
47 250 0.9 121.08 59 300 0.8 225
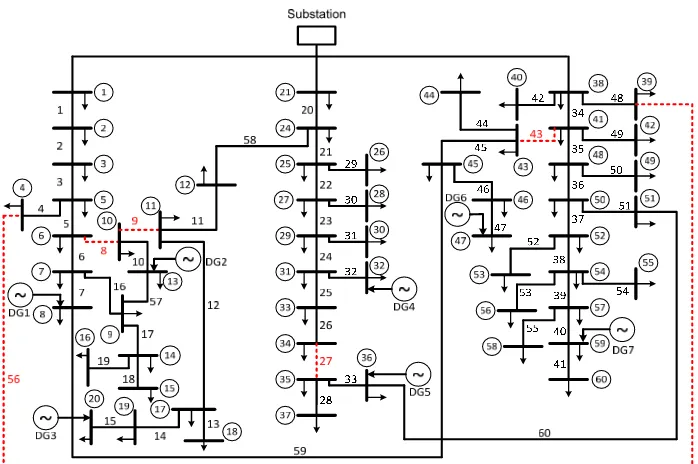
because most potential in the area of Yogyakarta. We have assumed that power factor of all DER solar photovoltaics are unity, while wind farms are ranging from 0.8 to 0.9 (lagging). The PSO parameters that have been used to 60-bus Yogyakarta radial distribution system are consists of population size of 25 and maximum iteration of 200. The minimum and maximum voltages are set at 0.90 and 1.00 p.u., respectively. The results of the case study are shown in Figure 3, Figure 4, Figure 5, and Table 2. Network reconfiguration using improved PSO algorithm has resulted that there are four tie switches that must be closed, i.e., switches of 57, 58, 59, and 60, while the sectionalizing switches to be opened are switches of 8, 9, 27, and 43, as shown in Table 2.
Figure 3. 60-bus Bantul radial distribution network after reconfiguration
Figure 4. Power loss dispersion of 60-bus Bantul radial distribution test system
power loss. It can be seen that the presence of DER as many as seven units on buses of 8, 13, 20, 32, 36, 47, and 59 has the effects on the power loss reduction of the system, especially on buses closest to the DER. Before reconfiguration the network as a base case, total active power loss under study is 656.20 kW. Total active power loss after installing as many as five DERs is 474.86 kW, while total active power loss after reconfiguration of network with DER integration is 294.71 kW, as shown in Table 2. From the Table can also be seen that integration of five DERs has resulted in reduction of power loss. Percentage of power loss reduction after installing the DERs is 27.63%, while percentage of power loss after reconfiguration of network with DG integration is 55.09%. These results have proved that the reconfiguration of the network have a considerable influence on the reduction of active power loss in distribution system. Reduction of power loss is certainly improving the efficiency of the distribution network. Table 2 also reported that the efficiency of the distribution network of 60-bus Bantul radial system in the original condition is 97.53%. The efficiency has increased to 98.21% after integration of as many as seven DERs in the system. After integration of the DERs, optimization is carried out on the network configuration. The result showed that an increasing in efficiency be a 98.89% after reconfiguration is achieved.
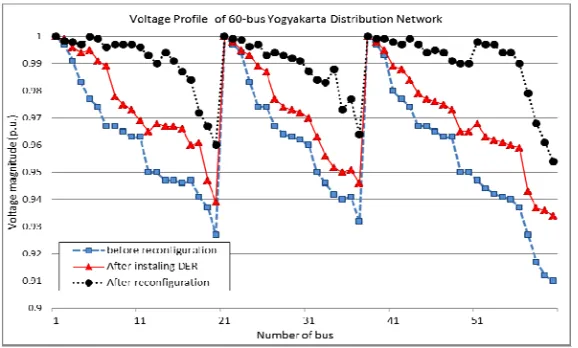
For voltage profile of the network, it is interesting to find that with integration of DER in 60-bus Bantul radial distribution network, voltage quality of each bus is improved, as shown in Figure 5. The voltage quality is to be improved further by doing reconfiguration of distribution network than ever before. It should be noted in the results that only a voltage magnitude along the main feeder of bus is presented. Before reconfiguration the network as a base case, it is resulted that the highest voltage magnitude is 1.00 p.u. on bus 1, while the lowest voltage magnitude is 0.910 p.u. on bus 60, as shown in Figure 5 and Table 2. In Figure 5, it can be seen that on the original condition of the network, the farther away from the substation location, the lower the amplitude of the bus’s voltage. Integration of DER has resulted in increasing of voltage magnitude. After integration of DER in 60-bus Bantul distribution network, the highest voltage magnitude is 1.00 p.u. on bus 1, while the lowest voltage magnitude is 0.934 p.u. on bus 60, as shown in Figure 5 and Table 2. It can be observed from Figure 5 that integration of DER as many as seven units on buses of 8, 13, 20, 32, 36, 47, and 59 has the strong effects on the voltage profile improvement, especially on buses closest to the DER. The voltage improvement is occurred almost the entire bus, except for bus 1, because the magnitude of the voltage has reached its maximum limit.
Figure 5. Voltage profile of 60-bus Bantul radial distribution test system
voltage magnitude is 0.954 p.u. on bus 60. This voltage magnitude is better than the magnitude of the voltage before reconfiguring the network. These results prove that the distribution network reconfiguration with DER integration using improved PSO method has been successful in improving the performance of 60-bus Bantul radial distribution system.
Table 2. The Simulation Results of 60-Bus Bantul Radial Distribution Network
Test Case of
A study of optimal reconfiguration of radial distribution network with the integration of DER using modified PSO algorithm is presented in this paper. The study was based on minimizing active power losses and improving voltage quality in order to enhance distribution system performance. The methodology was tested on a practical 60-bus Bantul distribution system of Yogyakarta Special Region province, Indonesia. Based on the numerical results, it was shown that the algorithm is effective in enhancing efficiency of the two test distribution systems. For a 60-bus Bantul distribution system, the efficiencies in the original condition, after integration of seven DERs, and after network reconfiguration are 97.53%, 98.21%, and 98.89%, respectively. Also, integration of DER has resulted in improved voltage profile in the test radial networks. After optimal reconfiguration of the network, the voltage profile is to be improved further.
Acknowledgements
The authors gratefully acknowledge the contributions of the Directorate General of Higher Education (DIKTI), Ministry of Research, Technology and Higher Education, Republic of Indonesia, for funding this research.
References
[1] Syahputra R, Robandi I, Ashari M. Optimization of Distribution Network Configuration with Integration of Distributed Energy Resources Using Extended Fuzzy Multi-objective Method, International Review of Electrical Engineering. 2014; 9(3): 629-639.
[2] Syahputra R, Robandi I, Ashari M. Optimal Distribution Network Reconfiguration with Penetration of Distributed Energy Resources. 1st International Conference on Information Technology, Computer and Electrical Engineering (ICITACEE 2014). Semarang. 2014: 386-391.
[3] Merlin A, Back H. Search for a minimal-loss operating spanning tree configuration in an urban power distribution system. 5th PSCC Conference. Cambridge UK. 1975: 1-18.
[4] Lin WM, Chin HC. A New Approach for Distribution Feeder Reconfiguration for Loss Reduction and Service Restoration.IEEE Trans on PWRD. 1998; 13(3): 870-875.
[5] Afrisal H, Faris M, Utomo P, Soesanti I, Andri F. Portable smart sorting and grading machine for fruits using computer vision. Proceeding - 2013 International Conference on Computer, Control, Informatics and Its Applications: "Recent Challenges in Computer, Control and Informatics", IC3INA. 2013. [6] Nugroho HA, Faisal N, Soesanti I, Choridah L. Analysis of digital mammograms for detection of breast
cancer. Proceeding - 2014 International Conference on Computer, Control, Informatics and Its
[7] Rohmah RN, Susanto A, Soesanti I. Lung tuberculosis identification based on statistical feature of thoracic X-ray. 2013 International Conference on Quality in Research, QiR 2013 - In Conjunction with ICCS 2013: The 2nd International Conference on Civic Space. 2013.
[8] Nara K, Shiose A, Kitagawa M. Implementation of Genetic Algorithm for Distribution System Loss Minimum Reconfiguration.IEEE Trans on PWRD. 1992; 7(3): 1044-1051.
[9] Augugliaro A, Dusonchet L, Ippolito M. Minimum Losses Reconfiguration of Distribution Network through Control of Tie-Switches. IEEE Trans on PWRD. 2003; 18(3): 762-771.
[10] Jeon YJ, Kim JC, Kim JO, Shin JR. An Efficient Simulated Annealing for Network Reconfiguration in Large-Scale Distribution.IEEE Trans on PWRD. 2002; 17(4): 1070-1078.
[11] Mendoza J, Lopez R, Morales D, Lopez E. Minimal loss reconfiguration using GA with restricted population and addressed operators. IEEE Trans on PS. 2006; 21(2): 948-954.
[12] Enacheanu B, Raison B, Caire R, Devaux O. Radial Network Reconfiguration Using Genetic Algorithm Based on the Matroid Theory. IEEE Trans on PS. 2008; 23(1): 186-195.
[13] Falaghi H, Haghifam MR. ACO-Based Method for Placement of Sectionalizing Switches in Distribution Networks Using a Fuzzy Aproach.IEEE Trans on PWRD. 2009; 24(1): 268-276.
[14] Farahani V, Vahidi B, Abyaneh HA. Reconfiguration and Capacitor Placement Simultaneously for Energy Loss Reduction. IEEE Trans on PS. 2012: 27(22): 587-595.
[15] Rao RS, Narasimham SVL, Raju MR. Optimal Network Reconfiguration of Large-Scale Distribution System Using Harmony Search Algorithm. IEEE Trans on PS. 2011; 26(3).
[16] Syahputra R, Robandi I, Ashari M. Reconfiguration of Distribution Network with DG Using Fuzzy
Multi-objective Method. 2012 International Conference on Innovation, Management and Technology
Research (ICIMTR 2012). Melacca, Malaysia. 2012: 316-321.
[17] Syahputra R, Robandi I, Ashari M. PSO Based Multi-objective Optimization for Reconfiguration of Radial Distribution Network. International Journal of Applied Engineering Research. 2015; 10(6): 14573-14586.
[18] Niknam T, Meymand HZ, Mojarrad HD. A practical multi-objective PSO algorithm for optimal operation management of distribution network with regard to fuel cell power plants. Renewable Energy. 2011; 36: 1529-1544.
[19] Syahputra R, Robandi I, Ashari M. Performance Analysis of Wind Turbine as a Distributed Generation Unit in Distribution System. International Journal of Computer Science & Information Technology. 2014; 6(3): 39-56.
[20] Ashari M, Anam S, Surojo. A Wide Range Fuzzy Based Maximum Power Point Tracker for Improving the Efficiency and Sizing of PV Systems. Jurnal of Electrical Engineering. 2011; 11(2): 52-56.
[21] Ashari M, Nayar CV. Optimum Operation Strategy and Economic Analysis of a PV-Battery-mains Hybrid Uninterruptible Power Supply.Journal of Renewable Energy. 2001; 22(1): 247-254.
[22] Ashari M, Nayar CV. A Grid-interactive Photovoltaic Uninterruptible Power Supply System Using Battery Storage and a Backup Diesel Generator. IEEE Transactions on Energy Conversion. 2000; 15(3): 348-353.
[23] Robandi I. Desain sistem tenaga modern: optimisasi, logika fuzzy, algoritma genetika. Yogyakarta: Andi Publisher. 2006.
[24] Jamal A, Syahputra R. UPFC Based on Adaptive Neuro-Fuzzy for Power Flow Control of Multimachine Power Systems. International Journal of Engineering Science Invention. 2013; 2(10): 05-14.