Soil Air Water
CLEAN
www.clean-journal.com
Renewables
Sustainability
Environmental Monitoring
Anisa Ur Rahmah Sabtanti Harimurti Abdul Aziz Omar Thanapalan Murugesan
Department of Chemical Engineering, Universiti Teknologi PETRONAS, Bandar Seri Iskandar, Tronoh, Perak, Malaysia
Research Article
Kinetics and Thermodynamic Studies of
Oxytetracycline Mineralization Using UV/H
2
O
2
Oxytetracycline (OTC), a widely used antibiotic, was taken as the model contaminant to
study the kinetic and thermodynamic parameters of mineralization using a UV/H
2O
2system. Mineralization experiments were carried out at different initial OTC
concentrations of 0.0156
–
0.0531 M, initial H
2O
2concentrations of 0.043
–
0.116 M and
at a temperature range of 20
50°C. The OTC mineralization process was monitored by
measuring the total organic carbon as well as H
2O
2consumption. The analysis of
mineralization data showed two phases of mineralization: phase I: 0
t
30 min and
phase II: 30
t
180 min. Based on this, the kinetic and thermodynamic parameters
were established. The order of reaction obtained for organic C and H
2O
2is 0.624 and
0.599 (phase I) and 0.954 and 0.062 (phase II), respectively. Based on this kinetic model,
the OTC degradation rate constants were 0.0069 min
1(phase I) and 0.0051 min
1(phase II). The activation energy for phase I and phase II oxidation was 10.236 and
9.913 kJ mol
1, respectively. The estimated
D
#G
and
D
#H
values are positive, whereas
negative
D
#S
values were obtained.
Keywords:Antibiotics; Degradation; Oxidation processes; Personal care products; Pharmaceuticals
Received:December 25, 2012;revised:July 30, 2013;accepted:November 14, 2013
DOI:10.1002/clen.201200637
1 Introduction
Pharmaceutical and personal care products (PCPs) are extensively used in our modern living, such as prescribed therapeutic drugs, veterinary drugs, cosmetics, and fragrances or even nutraceutical products (i.e. vitamin and hormones, etc.) [1]. In general they are used for improving the quality of personal health and growth of human and other organism or for cosmetic reasons [1, 2]. Residues of PCPs may come from pharmaceutical industries, hospital and households, veterinary drug (mainly antibiotics and steroids) and agricultural sectors, etc. [3–6]. Among the PCPs, antibiotics are one of the important types of compounds that are produced and consumed in very large quantity to treat bacterial diseases in human and animal. Excretion of metabolized and non-metabolized form of antibiotics from human and animal bodies may enter into the water stream [6]. Many researchers have reported that contamination in surface and ground water, drinking water, tap water, ocean water, sediments, and soil might be due to antibiotics [7–9]. These contaminations will produce antibiotic-resistant bacteria and damage the internal organ of aquatic animals [10–12]. Water contaminated with antibiotics, when it is consumed by the animals, they remain inside the tissues as food pollutant which might trigger
the allergic reactions and contribute to the formation and development of antibiotic-resistant bacteria in human body [13].
Antibiotics are classified under several categories namely: b -lactams, tetracyclines, aminoglycosides, quinolones, macrolides, glycopeptides, and sulfonamides. However, the most extensively used antibiotics in animal feeds are tetracycline class including as food additive for systemic bacterial infection therapy in farmedfish, growth simulator in livestock and stress reduction in pig and poultry [14–17]. Hence, in the present study oxytetracycline (OTC), a member of the tetracycline class has been chosen as a model antibiotic compound that contaminates the water matrix.
Many methods have been applied to treat the antibiotic contaminated water matrix. However, antibiotics are extremely resistant compounds toward biological degradation process, hence the research have been directed towards the application of non-biological processes for their destruction, and one among them is advanced oxidation processes (AOPs) [9]. Recently, AOPs have emerged as an effective process, which is capable of transforming organic pollutant into non-toxic substances. These processes exclusively rely on the generation of hydroxyl radicals (•OH) in
general or any other highly reactive species, that can attack the organic pollutant in the water matrix. After the radical attack, the organic pollutant will be subjected to a series of degradation/ oxidation reaction and lead to the formation of CO2and H2O as the
final product.
The degradation of OTC have been achieved through many processes namely, Fenton process, ozone process, UV photolysis, UV/ H2O2system, simulated sunlight irradiation, photocatalytic process
using TiO2-zeolite, electrochemical oxidation, Mn-peroxidase andg
-pulse irradiation, etc. [14, 18–25]. However, no detailed study has
Correspondence: Prof. T. Murugesan, Department of Chemical
Engineering, Universiti Teknologi PETRONAS, Bandar Seri Iskandar, 31750, Tronoh, Perak D. R., Malaysia
E-mail:[email protected]; [email protected]
Abbreviations: AOP, advanced oxidation process;OTC, oxytetracycline;
been reported on the kinetics and thermodynamic parameters of OTC mineralization using the combined UV/H2O2system, especially
based on total organic carbon (TOC) concentration profile. This TOC concentration profile is important since it refers to the complete conversion of organic content of compound to inorganic constitu-ent which generally lead to complete detoxification [26]. Based on that, in the present study it is proposed to establish the details of kinetics (order of reaction, rate constant (k), energy of activation (EA))
and thermodynamic parameters (enthalpy of activation (D#H), Gibbs energy of activation (D#G), and entropy of activation (D#S)) of OTC
mineralization. The evaluation and the establishment of these parameters will provide a better insight into the OTC mineralization mechanism and hence lead to their potential application toward scale up and commercialization of the process.
2 Materials and methods
2.1 Materials
OTC hydrochloride, C22H24N2O9HCl (Merck, Germany) and
hydro-gen peroxide, 30% (Merck, Germany) were used as the source of organic contaminant and the source of hydroxyl radical, respective-ly. H2SO4, 98% (Merck, Germany) and NaOH (Merck, Germany) were
used for pH adjustment. All chemicals were used without further purification. The chemical structure of OTC is given in Fig. 1.
2.2 Methods
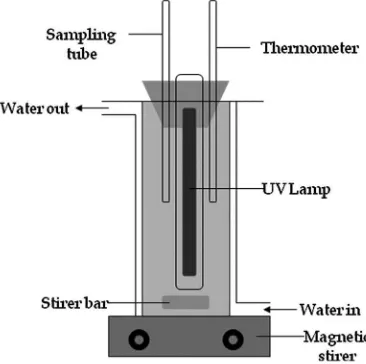
All experiments were carried out in a glass reactor (400 mL working volume) with a provision for irradiation using a low pressure Hg lamp (8 W power GPH295T5L; serial no. EC90277, USA) to produce UV light at 254 nm. A schematic diagram of the reactor is shown in Fig. 2. During irradiation, the solution was stirred using magnetic stirrer. The temperature was maintained using water circulation through the reactor jacket. After adjusting the OTC solution to the optimum pH, desired amount of H2O2were then added into the
reactor. Initial concentrations of OTC and H2O2 as well as
temperature were varied. To monitor the progress of mineralization, about 3 mL of liquid samples were drawn from the reactor at scheduled time intervals. Since the total amount of samples withdrawn were<5% of the total volume, for calculation purposes the total sample volume was neglected. About 180 min of irradiation time were applied for all of the experiments. TOC measurements were carried out using a TOC analyzer (Shimadzu, Japan) while the amount of H2O2 in the solution was analyzed by colorimetric
method using KMnO4.
2.2.1 Theory and background
Based on the preliminary and optimization studies on OTC mineralization process using Box-Behnken experimental design combined with the response surface methodology, the optimum pH was found to be 6.36 and hence for the present experiments for the estimation of kinetic and thermodynamic parameters were conducted at pH 6.36 [27]. The measured TOC (ppm) were later converted into organic carbon concentration (org. C, M) for further analysis. Concentration of org. C and H2O2in the reaction media
could be directly estimated. Therefore, it is more convenient and practical to express the kinetic equation in terms of org. C and H2O2
concentration rather than free radical concentration. In the present study, OTC was assumed to be completely mineralized by H2O2and
formed inorganic products, such as H2O, CO2, N2, and Cl2(Eq. (1)).
This stoichiometric assumption was used previously to optimize the H2O2mole ratio needed to completely mineralize OTC [27].
2C22H24N2O9HClþ95H2O2!120H2Oþ44CO2þ2N2þCl2 ð1Þ
For determining the order of reaction, initial concentrations of OTC as well as H2O2were varied in the range of 125–500 ppm (0.0156–
0.053 M of org. C) and 0.043–0.116 M of H2O2, respectively. To study the
individual effect of UV and H2O2, OTC mineralization experiments
were conducted at a H2O2concentration of 0.116 M only. To investigate
the effect of temperature on the rate constant (k), the experiments were conducted at four different temperatures (20, 30, 40, and 50°C). The experimental data were then plotted against pseudo order, zero-th,first, and second order of kinetics. Differential method was also applied to determine the order of reaction. The activation energy (EA)
was calculated from the linearized form of Arrhenius equation, while the values of enthalpy of activation (D#H), Gibbs energy of activation
(D#G), and entropy of activation (D#S) were calculated by using the
Eyring–Polanyi equation.
3 Results and discussion
3.1 Kinetic study
The analysis for the kinetics of mineralization was made on the assumption that the rate of reaction depend on organic C
Figure 1. Chemical structure of OTC.
concentration only and hence the rate of OTC mineralization can be expressed as:
r¼ d½org:C
dt ¼kobs½org:C
n ð2Þ
Based on these assumptions, the equations for the pseudo zero-th (Eq. (3)), pseudo-first (Eq. (4)), and pseudo-second order (Eq. (5)) can be derived and expressed as follows.
½org:C0 ½org:Ct¼k0t ð3Þ
ln½org:Ct ½org:C0
¼ kobst ð4Þ
1
½org:Ct
1
½org:C0¼kobst ð5Þ
wherenis the order of reaction, [org. C]0the initial concentration of
org. C, [org. C]tthe concentration of org. C at timet,kobsthe kinetic
rate constant, andtis the time (min).
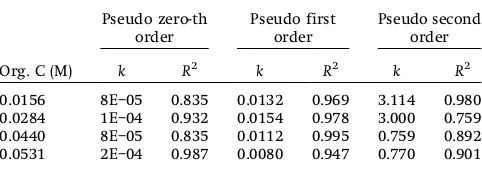
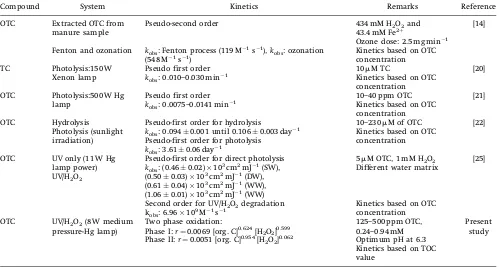
The experimental data were analyzed accordingly to the pseudo-zero-th,first, and second order of reaction, respectively. Table 1 shows the calculated kinetic rate constant along with the estimated correlation coefficients (R2). From this table, it can be seen that the present OTC mineralization datafits well with pseudofirst order kinetics with higherR2values (0.947–0.995) when compared to the pseudo zero-th and second order. A detailed review on the degradation and mineralization kinetics of tetracycline groups of antibiotics are summarized in Tab. 2. Based on the available literature on the degradation of tetracycline groups, namely photolysis of tetracycline hydrochloride, photolysis, and hydrolysis of OTC follow the pseudo-first order kinetics [20–25], while the ozonation and Fenton process of OTC extracted from manure sample as well as the UV/H2O2process for 5mM OTC followed the
pseudo-second order kinetics [14, 25]. Even though itfits well with thefirst order kinetics with betterR2value, but at the same time it yields inconsistent values fork.
The OTC mineralization was due to the•OH radical attack, which
is generated from H2O2dissociation by UV light rather than UV
photolysis and H2O2 oxidation alone, as shown in Fig. 3. The
measured values of the molar concentration of organic carbon with time are shown in Fig. 4. Beside the pseudo-order kinetics, the experimental data were further analyzed using differential method which includes both of org. C and H2O2 concentration. The
differential method was applied by incorporating org. C and H2O2
concentrations into the kinetic equation.
r¼ d½org:Ct
dt ¼kobs½org:C
m
½H2O2n ð6Þ
The logarithmic form of Eq. (6) was used for determining the order of reaction. By plotting the value of ln(d[org. C]t/dt) vs. ln([org. C]) and
ln(d[org. C]t/dt) vs. ln([H2O2]), the value of the order of reaction with
respect to OTC and H2O2were determined, respectively. This order of
reaction can be derived from negative slope of the curve. The value of the kobs can be derived by introducing the estimated order of
reaction into the overall kinetic equation at any OTC and H2O2
concentration.
A careful analysis of the plot of org. C vs.t(Fig. 4) showed two linear regions, during the time interval from 0–30 min (phase I) and 30–180 min (phase II). Plots for phase I and phase II of org. C mineralization are presented in Figs. 5 and 6, respectively, indicating a satisfactoryfit of the present experimental data. The estimated overall kinetic rates for both regions are presented below.
Phase I:
r¼0:0069 org½ :C0:624H 2O2
½ 0:599 ð7Þ
Phase II:
r¼0:0051 org½ :C0:954½H2O20:062 ð8Þ
By comparing all the results fromR2andkof pseudo order (Tab. 1) and differential method plot (Tab. 3), it can be concluded that the differential method shows better representation of the data. It also provides better insight in understanding the mineralization mechanism of OTC. The total order of reaction for phases I and II are 1.223 and 1.016, respectively. Therefore, the unit of k is approximated as that for thefirst order of reaction, min 1.
Generally, AOPs consist of two interrelated phases, i.e. generation of reactive species and oxidation of organic content which are further subdivided into series of simple oxidation and substrate mineraliza-tion [28–30]. At the earlier stage (phase I) of AOPs, the photon energy from UV lamp initiates the dissociation of H2O2molecule, forming
two•OH radicals. These radicals may attack the parent compound forming intermediate which are prone and unstable toward mineralization. While the latter stage (phase II) deals mostly on series of complex oxidation reactions with the reactive functional group of organic compound, C C bond fragmentation until all C-atoms inside the organic molecule are oxidized into their highest state, i.e. CO2, and yet having more stable structure [28].
Based on Eq. (7), both OTC and H2O2molecules have a similar order
of reaction. This might be due to the fact that during phase I, after dissociation of H2O2molecules, the •OH radicals formed would
subsequently attack the unstable parent compound of OTC which leads to the generation of intermediate compound. However, for phase II (Eq. (8)), the mineralization process predominantly depends on the org. C concentration rather than on H2O2which
was shown by the higher order of reaction of org. C (0.9541) compared to H2O2(0.062). This could be attributed to the reason that
after the disappearance of parent organic compounds, the intermediate species started to form which was further followed by the significant reduction of •OH radicals as well as H2O2
concentration (Fig. 7). Since OTC molecules contain N-atoms, after irradiation, beside organic acids, organic compounds containing N-atoms and intermediate compound were also detected. The parent organic compound and the intermediate compounds may compete as the contaminant target during the existing•OH radical attack.
Due to these competitions, the org. C concentration predominantly affected the mineralization rates rather than H2O2.
Table 1.Results of pseudo-order plots of OTC mineralization kinetics
Org. C (M)
Pseudo zero-th order Pseudo first order Pseudo second order
k R2 k R2 k R2
Different values ofkwere also observed to be higher, values of phase I, compared to phase II, which indicates a higher mineraliza-tion rate. This could be attributed that at phase I higher concentrations of OTC parent compounds were present in the solution compared to more stable organic products, and hence, increased the mineralization rate. At the end of the irradiation period, the mineralization rate started to reduce due to the accumulation of more stable oxidation products and•OH radical recombination. A similar two-step phenol degradation inside a UV/ H2O2system using a 24 W UV lamp power was also reported [30]. For
thefirst 15 min, the phenol degradation rate mainly depends on the
concentration of H2O2with itsk, the order of reaction of phenol and
H2O2 were 0.035 min 1
, 0.205 and 0.490, respectively. While for phase II it was reported as 0.110 min 1, 0.487, 0.169, respectively [30].
Mineralization of Profenofos using UV, Fenton, UV/H2O2, UV/H2O2/
Fe3þ, and UV/H
2O2/Fe2þwas found to follow pseudo-first order with
respect to TOC concentration while the reported values forkranges from 0.0052 to 0.0973 min 1[31].
3.2 Estimation of activation energy
The effect of reaction temperature, on the rate of OTC mineraliza-tion is shown in Fig. 8, for the temperature range of 20 50°C. Similar trends were also reported for the degradation of phenol,
Table 2.Comparison of literature on tetracycline groups degradation and mineralization kinetics
Compound System Kinetics Remarks Reference
OTC Extracted OTC from manure sample
Pseudo-second order 434 mM H2O2and
43.4 mM Fe2þ
Ozone dose: 2.5 mg min 1
[14]
Fenton and ozonation kobs: Fenton process (119 M 1s 1),kobs: ozonation
(548 M 1s 1)
Kinetics based on OTC concentration TC Photolysis:150 W
Xenon lamp
Pseudo first order 10mM TC [20]
kobs: 0.010–0.030 min 1
Kinetics based on OTC concentration OTC Photolysis:500 W Hg
lamp
Pseudo first order 10–40 ppm OTC [21]
kobs: 0.0075–0.0141 min 1 Kinetics based on OTC
concentration
OTC Hydrolysis Pseudo-first order for hydrolysis 10–230mM of OTC [22] Photolysis (sunlight
irradiation)
kobs: 0.0940.001 until 0.1060.003 day 1
Kinetics based on OTC concentration Pseudo-first order for photolysis
kobs: 3.610.06 day 1
OTC UV only (11 W Hg lamp power)
Pseudo-first order for direct photolysis
kobs: (0.460.02)10 3
cm2mJ 1(SW),
5mM OTC, 1 mM H2O2
Different water matrix
[25]
UV/H2O2 (0.500.03)103cm2mJ 1(DW),
(0.610.04)103cm2mJ 1(WW), (1.060.01)103cm2mJ 1(WW)
Second order for UV/H2O2degradation Kinetics based on OTC
concentration kobs: 6.96109M 1s 1
OTC UV/H2O2(8 W medium
pressure-Hg lamp)
Two phase oxidation:
Phase I:r¼0.0069 [org. C]0.624[H 2O2]0.599
Phase II:r¼0.0051 [org. C]0.954[H2O2] 0.062
125–500 ppm OTC, 0.24–0.94 mM Optimum pH at 6.3
Present study
Kinetics based on TOC value
TC, tetracycline hydrochloride, DW, treatment plant water, SW, surface water, UW, buffered water, WW, wastetwater.
Figure 3. Concentration profile of org. C at 0.116 M of H2O2and atT¼30° C using different mineralization method.
Figure 4. Concentration profile of org.C at 0.116 M of H2O2 and at
4-chlorophenol, 4-nitrophenol,p-nitroaniline; OTC hydrolysis and photolysis; oxidation of C. I. food yellow 3 and 4 [22, 32–35].EAwas
calculated using Arrhenius equation:
lnkobs¼lnA
EA
RT ð9Þ
where A is the pre-exponential factor and R the gas constant (8.314 J K 1mol 1). BothE
AandAare the Arrhenius parameters. The
differential form of Eq. (9) can be written as:
dðlnkobsÞ
dT ¼ EA
RT2 ð10Þ
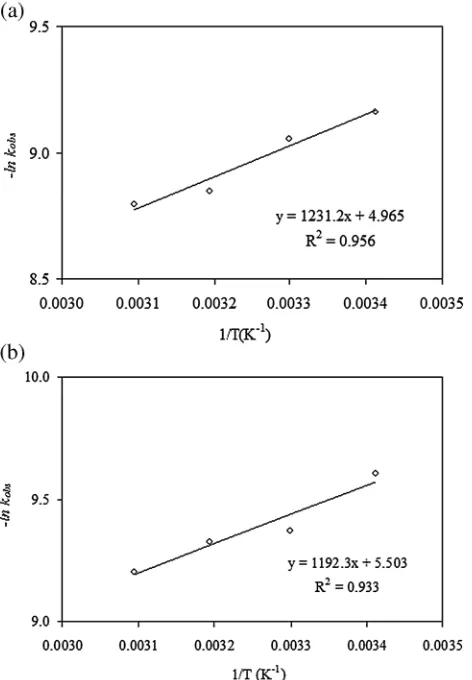
Using the plot of ln(–kobs) vs. 1/T, the estimated value of the
pre-exponential factor (A) for phase I and phase II of the OTC mineralization are 143.34 and 245.427 s 1, respectively (Fig. 8). The activation energy (EA) was then derived from the slope of
ln(–kobs) vs. 1/Tplots, which are 10.236 and 9.913 kJ mol–lfor phase I
and phase II of the OTC mineralization, respectively. The exponen-tial term of the Arrhenius equation indicates the dependency of kinetic rate constant on temperature [36]. The values of reported activation energies for the degradation of several organic com-pounds are compared in Tab. 4. Smaller value ofEAwas obtained
for this present system which indicates lower energy is needed to
initiate the reaction. Similar values of activation energy were also reported for the degradation of phenol, nitrophenol, and 4-chlorophenol using UVA/TiO2 system [32]. It is also possible to
estimate rate constant by incorporating hydroxyl radical into the kinetic equation, such as for kinetics of phenol andp-nitroaniline degradation. Phenol degradation using a non-catalytic wet air oxidation process and Fenton oxidation ofp-nitroaniline was found to have higher activation energy values of 778 and 53.96 kJ mol 1, respectively [33, 34].
3.3 Thermodynamic studies of OTC mineralization
Thermodynamic properties of OTC mineralization can be explained from the values of Gibbs energy of activation (D#G), enthalpy of
Figure 5.Plot of ln(d[org. C]t/dt) vs. ln([org. C]) for phase I (a) org. C and (b) H2O2.
Figure 6. Plot of ln(d[org. C]t/dt) vs. ln([org. H2O2]) for phase II (a) org. C and (b) H2O2.
Table 3.Results of differential method plots of OTC mineralization kinetics
Phase I Phase II Org. C (M) H2O2(M) k Org. C (M) H2O2(M) k
activation (D#H), and entropy of activation (D#S) as described below:
D#G¼D#H TD#S ð11Þ
These parameters are widely used to report experimental reaction rates, especially for organic reactions in solution. For this purpose
the following form of Eyring–Polanyi equation was employed [36].
kobs¼
kBT
h e
D#G=RT
ð12Þ
where kB is the Boltzman constant (1.38010 23
J K 1), T the reaction temperature (K),hthe Planck constant (6.62610 34J s 1),
and R is the gas constant (8.314 J K 1mol 1). The following logarithmic form of the above equation can be used for the estimation ofD#Gvalue.
lnkobs¼ln
kBT
h
D#G
R T ð13Þ
Substitution of Eqs. (10), (11), and (12) into the differential form of Eq. (13) results in the following equation:
d lnð kobsÞ
dT ¼ EA
RT2¼
d dT ln
kBT
h
d dT
D#H RT
D#S R
!
ð14Þ
With the prior knowledge ofEA, the enthalpy of activation (D#H),
could be estimated as follows:
D#H¼ E
A RT ð15Þ
Using the above equation, the values ofD#G,D#H, andD#Sof the OTC mineralization were estimated and are presented in Tab. 5. The Gibbs free energy of activation quantifies the difference between the transition state of reaction and the ground state of the reactants [37]. In transition state, the bonds of the reacting compounds are partially formed and broken. The energy required for bond reorganization is reflected by the higher energy content of the activated complex and corresponds to D#H [38]. The entropy of
activation quantifies the degree of structural organization of the activated complex formation. A reduction of translational, vibra-tional, and rotational degrees of freedom of the transition state results in negativeD#S[38]. In the present study, the estimated Gibbs
free energies and enthalpies of activation are positive whereas the entropies of activation are negative for both phases I and II of the OTC mineralization process. A positive value ofD#Grefers to the tendency of transition state of reaction toward the product side is non-spontaneous. These results are in accordance with the fact that no OTC mineralization took place when UV or H2O2alone were being
introduced into the system (Fig. 3). A positive value ofD#Gwas also reported for phenol, 4-chlorophenol, and 4-nitrophenol and C.I. food yellow 3 mineralization, which indicates non-spontaneity of the reaction [32]. For phases I and II,D#Ghas the same order with C.I.
food yellow 4 [38]. However, the value ofD#Gis higher compared to the values obtained in the present study. A positive value forD#H
indicates the energy needed to be supplied to the system in order to achieve the transition energy level which leads to the formation of products. The incorporation of UV/H2O2into the system has supplied
energy that overcomes the energy barrier led to OTC mineralization (Fig. 3). A negative value forD#Scan be attributed to the formation of a complex intermediate by OTC and hydroxyl radical, then frequently followed by an entropy reduction through the loss of rotational degrees of freedom of reactant and OTC parent compound during the process [36, 38, 39]. A similar negative value ofD#Swas also reported for the thermal isomerization of allyl vinyl ether which in this case lost its rotational degree of freedom by forming
Figure 7. H2O2 consumption profile of OTC at 0.116 M H2O2 and
T¼30°C.
highly ordered transition state of 4-pentenal [38]. Photodegradation of phenol, 4-chlorophenol and 4-nitrophenol also have negativeD#S
values [32]. Table 6 shows the comparison of the reported values of
D#G,D#H, andD#Sfor the mineralization of different compounds using different processes.
4 Conclusions
Based on the org. C of OTC and H2O2concentration profile, kinetic
and thermodynamic parameters of OTC mineralization using a UV/ H2O2system at its optimum pH were evaluated. The experimental
data were analyzed for pseudo zero-th,first, and second order tofind the order of reaction of OTC mineralization. Differential method was also used for obtaining the order of reaction. Based on the analysis and also the mechanistic aspects provided by each of the kinetic models, the kinetic equation of OTC mineralization was obtained based on the differential method rather than pseudo order plot. Based on the present kinetic analysis, it can be concluded that the reaction follows the pseudofirst order kinetics, for both the regimes with differentkvalues, which include the concentration of both OTC as well as H2O2. The temperature dependency of OTC
mineralization was studied by using the Arrhenius equation and low value ofEAwas obtained. The values of the Arrhenius constant
(A) show the positive effect of temperature on the reaction. The value of the thermodynamic parameters of the OTC mineralization, such asD#G,D#H, andD#Swere also determined. In this study, positive
values ofD#GandD#Hand negative values ofD#Swere obtained for phases I and II of OTC mineralization, indicating the non-spontaneity of the reaction. The present results will certainly be useful for the design and scale up of the OTC mineralization process toward commercial/large scale process.
The authors have declared no conflict of interest.
References
[1] C. G. Daughton, T. A. Ternes, Pharmaceuticals and Personal Care Products in the Environment: Agents of Subtle Change?,Environ. Health Perspect.1999,107, 907–942.
[2] J. B. Ellis, Pharmaceutical and Personal Care Products (PPCPs) in Urban Receiving Water,Environ. Pollut.2006,144, 184–189. [3] A. Karci, I. A. Balcioglu, Investigation of the Tetracycline,
Sulfon-amide, and Fluoroquinolone Antimicrobial Compounds in Animal
Table 6.Reported values of thermodynamic parameters for different other organic contaminants
Compound T(K) D#G(kJ mol 1)
D#H(kJ mol 1)
D#S(J K 1mol 1) Reference
Phenol 298.15 86.32 18.97 –0.23 [35]
4-Chlorophenol 298.15 86.26 7.21 –0.27 [35]
4-Nitrophenol 298.15 85.46 16.38 –0.23 [35]
C.I. food yellow 3 298.15 103.00 15.50 þ270.00 [38] C.I. food yellow 4 298.15 54.00 10.30 þ140.00 [38]
Table 4.Reported activation energy values for the degradation of different organic compounds under different conditions
Compound System EA(kJ mol 1) Reference
Oxytetracycline degradation Hydrolysis 88.15 [22]
Phenol degradation UVA/TiO2 21.44 [32]
4-Chlorophenol degradation UVA/TiO2 9.68 [32]
4-Nitrophenol degradation UVA/TiO2 18.86 [32]
Phenol Non-catalytic wet air oxidation 778 [33]
p-Nitroaniline degradation Fenton 53.96 [34]
C.I. food yellow 3 degradation H2O2oxidation 51 [35]
C.I. food yellow 4 degradation H2O2oxidation 101 [35]
Oxytetracycline mineralization UV/H2O2 Phase I (0t30 min): 10.236
Phase II (30t180 min): 9.913
Present study
Table 5.Thermodynamic parameters of OTC mineralization
T(K) k(s 1) D#G(kJ mol 1) D#H(kJ mol 1) D#S(J K 1mol 1)
Phase I
293.15 0.00011 49.424 7.799 –141.993
303.15 0.00012 51.460 7.716 –144.299
313.15 0.00014 53.786 7.633 –147.385
323.15 0.00015 55.718 7.550 –149.060
Phase II
293.15 0.000067 48.339 7.476 –139.395
303.15 0.000085 50.662 7.392 –142.734
313.15 0.000089 52.538 7.309 –144.432
Manure and Agricultural Soils in Turkey,Sci. Total Environ.2009,407, 4652–4654.
[4] M. Edwards, E. Topp, C. D. Metcalfe, H. Li, N. Gottschall, P. Bolton, W. Curnoe, et al., Pharmaceutical and Personal Care Products in Tile Drainage Following Surface Spreading and Injection of Dewatered Municipal Biosolids to an Agricultural Field,Sci. Total Environ.2010,
407, 4220–4230.
[5] D. Li, M. Yang, J. Hu, Y. Zhang, H. Chang, F. Jin, Determination of Penicillin G and Its Degradation Products in a Penicillin Production Wastewater Treatment Plant and the Receiving River,Water Res.
2008,42, 307–317.
[6] W. Xu, G. Zhang, X. Li, S. Zou, P. Li, Z. Hu, J. Li, Occurrence and Elimination of Antibiotics at Four Sewage Treatment Plants in the Pearl River Delta (PRD), South China,Water Res.2007,41, 4526–4534. [7] K. Kümmerer, Antibiotics in the Aquatic Environment,Chemosphere
2009,75, 417–434.
[8] M. Klavarioti, D. Mantzavinos, D. Kassinos, Removal of Residual Pharmaceuticals from Aqueous Systems by Advanced Oxidation Processes,Environ. Int.2009,35, 402–417.
[9] F. Baquero, J. L. Martinez, R. Canton, Antibiotics and Antibiotic Resistance in Water Environments,Curr. Opin. Biotechnol.2008,19, 260–265.
[10] V. J. L. Martinez, Environmental Pollution by Antibiotics and by Antibiotic Resistance Determinants,Environ. Pollut.2009,157, 2893–
2902.
[11] C. Garafalo, C. Viragnoli, G. Zandri, L. Aquilanti, D. Bordoni, A. Osimani, F. Clementi, et al., Direct Detection of Antibiotics Resistance Genes in Specimens of Chicken and Pork Meat,Int. J. Food Microbiol.2007,113, 75–83.
[12] A. Gulkowska, H. W. Leung, M. K. So, S. Taniyasu, N. Yamashita, L. W. Y. Yeung, B. J. Richardson, et al., Removal of Antibiotics from Wastewater by Sewage Treatment Facilities in Hongkong and Shenzhen, China,Water Res.2008,42, 395–403.
[13] F. C. Cabello, Heavy Use of Prophylactic Antibiotics in Aquaculture: A Growing Problem for Human and Animal Health and for the Environment,Environ. Microbiol.2006,8, 1137–1144.
[14] M. O. Uslu, I. A. Balcioglu, Comparison of the Ozonation and Fenton Process Performance for the Treatment of Antibiotic Containing Manure,Sci. Total Environ.2009,407, 3450–3458.
[15] A. J. Bauger, J. Hensen, P. H. Krogh, Effects of Antibiotics Oxytetra-cycline and Tylosin on Soil Fauna,Chemosphere2000,40, 751–757. [16] Y. Wang, L. Wang, F. Li, J. Liang, Y. Li, J. Dai, T. C. Loh, et al., Effects of
Oxytetracycline and Sulfachloropyridazine Residues on the Reduc-tive Activity ofShewanella decoloratisS12,J. Agric. Food Chem.2009,57, 5878–5883.
[17] O. A. Arikan, C. Rice, E. Codling, Occurrence of Antibiotics and Hormones in a Major Agricultural Watershed,Desalination2008,226, 121–133.
[18] I. R. Bautiz, R. F. P. Nogueira, Degradation of Tetracycline by Photo-Fenton Process-solar Irradiation and Matrix Effects, J. Photochem. Photobiol., A2007,187, 33–39.
[19] K. Li, A. Yediler, M. Yang, S. Schulte-Hostede, M. H. Wong, Ozonation of Oxytetrcycline and Toxicological Assessment of Its Oxidation By-products,Chemosphere2008,72, 472–478.
[20] Y. Chen, C. Hu, J. Qu, M. Yang, Photodegradation of Tetracycline and Formation of Reactive Oxygen Species in Aqueous Tetracycline under Simulate Sunlight Irradiation,J. Photochem. Photobiol., A2008,
197, 81–87.
[21] S. Jiao, S. Zheng, D. Yin, L. Wang, L. Chen, Aqueous Oxytetracy-cline Degradation and the Toxicity Change of Degradation Compounds in Photoirradiation Process, J. Environ. Sci. 2008,20, 806–813.
[22] R. Xuan, L. Arisi, Q. Wang, S. R. Yates, K. C. Biswas, Hydrolysis and Photolysis of Oxytetracycline in Aqueous Solution,J. Environ. Sci. Health, Part B2010,45, 73–81.
[23] C. Zhao, H. Deng, Y. Li, Z. Liu, Photodegradation of Oxytetracycline in Aqueous by 5A and 13X Loaded with TiO2under UV Irradiation,J.
Hazard. Mater.2010,176, 884–892.
[24] X. Wen, Y. Jia, J. Li, Enzymatic Degradation of Tetracycline and Oxytetracycline by Crude Manganese Peroxidase Prepared from
Phanerochaete chrysosporium,J. Hazard. Mater.2010,177, 924–928. [25] F. Yuan, C. Hu, X. Hu, D. Wei, Y. Chen, J. Qu, Photodegradation and
Toxicity Changes of Antibiotics in UV and UV/H2O2Process,J. Hazard.
Mater.2011,185, 1256–1263.
[26] N. K. Shammas, L. K. Wang, inHandbook of Advanced Industrial and Hazardous Waste Treatment(Eds.: L. K. Wang, N. K. Shammas, Y. T. Hung), CRC Press, Boca Raton, FL2009, p. 407.
[27] A. U. Rahmah, S. Harimurti, A. A. Omar, T. Murugesan, Optimiza-tion of Oxytetracycline MineralizaOptimiza-tion Using Box-Behnken Experi-mental Design inside a UV/H2O2System,J. Appl. Sci.2012,12, 1154–
1159.
[28] T. Oppenlander,Photochemical and Purification of Water and Air, Wiley-VCH Verlag, Weinheim, Germany2003, p. 190.
[29] M. I. Stefan, A. R. Hoy, J. R. Bolton, Kinetics and Mechanism of Degradation and Mineralization of Acetone in Dilute Aqueous Solution Sensitized by the UV Photolysis of Hydrogen Peroxide,
Environ. Sci. Technol.1996,30, 2382–2390.
[30] A. K. De, S. Bhattacharjee, B. K. Dutta, Kinetics of Phenol Photooxidation by Hydrogen Peroxide and Ultraviolet Radiation,
Ind. Eng. Chem. Res.1997,36, 3607–3612.
[31] M. I. Badawy, M. Y. Ghaly, T. A. Gad-Allah, Advanced Oxidation Processes for the Removal of Organo-phosphorus Pesticides from Wastewater,Desalination2006,194, 166–175.
[32] K. Naeem, P. Weiqian, F. Ouyang, Thermodynamic Parameters of Activation for Photodegradation of Phenolics,Chem. Eng. J.2010,156, 505–509.
[33] S. Lefèvre, O. Boutin, J. H. Ferasse, L. Malleret, R. Faucherand, A. Viand, Thermodynamic and Kinetic Study of Phenol Degradation by a Non-catalytic Wet Oxidation,Chemosphere2011,84, 1208–1215. [34] J.-H. Sun, S.-P. Sun, M.-H. Fan, H.-Q. Guo, L.-P. Qiao, R.-X. Sun, A Kinetic
Study on the Degradation ofp-Nitroaniline by Fenton Oxidation Process,J. Hazard. Mater.2007,148, 172–177.
[35] C. T. Fragoso, R. Battisti, C. Miranda, P. C. de Jessus, Kinetic Degradation of C.I. Food Yellow 3 and C. I. Food Yellow 4 Azo Dyes by the Oxidation with Hydrogen Peroxide,J. Mol. Catal. A: Chem.2009,
301, 93–97.
[36] P. Atkins, J. de Paula,Physical Chemistry, 8th Ed., W. Freeman, New York2006, pp. 807–809.
[37] IUPAC,Compendium of Chemical Terminology, 2nd Ed. (the“Gold Book”) (Eds.: A. D. McNaught, A. Wilkinson), Blackwell, Oxford1997. [38] F. A. Carey, R. J. Gundberg,Advanced Organic Chemistry, Part A: Structure
and Mechanism, Springer, New York, USA2007, p. 203.
![Figure 6. Plot of ln(d[org. C]and (b) Ht/dt) vs. ln([org. H2O2]) for phase II (a) org](https://thumb-ap.123doks.com/thumbv2/123dok/459369.530984/6.594.305.534.73.404/figure-plot-org-ht-org-phase-ii-org.webp)