TELKOMNIKA, Vol.14, No.2, June 2016, pp. 613~621
ISSN: 1693-6930, accreditedAby DIKTI, Decree No: 58/DIKTI/Kep/2013
DOI:10.12928/TELKOMNIKA.v14i1.2749 613
Fusion of Infrared and Visible Images Based on
Non-subsample Contourlet Transform
Tingman Zhang1*,Qing Wang2
1
Xi’an Innovation College, Yan’an University, Xi’an 710100, Shaanxi China
2School of Automation and Information Engineering, Xi’an University of Technology,
Xi’an 710048, Shaanxi China
*Corresponding author, e-mail: [email protected]
Abstract
For the single spectrum image could not fully express the target feature information, this paper proposed a multispectral image fusion method based on non-subsample contourlet transform (NSCT). For the low frequency coefficients decomposed, fourth-order correlation coefficient is used to calculate the correlation between each low frequency coefficients, averaging fusion for the higher correlation coefficient, weight phase congruency fusion for the low correlation coefficient. For high frequency coefficients, Gaussian weight sum modified Laplace method is used for fusing, to retain more local structure details. Simulation results show that the method effectively retain the image structure information and more local details, and increase the image contrast.
Keywords: Image Fusion, NSCT, Weight Phase Congruency, Sum Modified Laplacian
Copyright©2016 Universitas Ahmad Dahlan. All rights reserved.
1. Introduction
Scene imaging of different spectral ranges has different characteristics. Infrared spectrum is quite sensitive to the temperature information and can image in the night vision while the visible image is strong in detail description, but weak in night-vision imaging quality; the fusion of infrared and visible images can overcome the shortcoming of single spectrum image and improve the image quality.
Contourlet transform is an image analysis tool under the framework of multi-scale geometric analysis. Compared with wavelet transform, Contourlet transform has better directivity and anisotropy [1]. Since it is not translation-invariant, Contourlet transform has pseudo-Gibbs phenomena in the singular point or line. Arthur and other people [2] have removed the sub-sampling process in the Contourlet transform creatively, proposed Nonsubsampled Contourlet Transform (NSCT), replaced the translation invariance at the cost of certain redundancy and eliminated the pseudo-Gibbs phenomena and it is applicable to the analysis of natural scene image. The image fusion method based on NSCT focuses on the combination of the decomposed low- and high-frequency coefficients according to certain rules. Literature [3-6] consider the pixel position information and think that the pixels which are closer to the central pixel has more significant impact on the central pixel and they use different fusion methods to low- and high-frequency coefficients and obtain better fusion effects. Literature [7] provides a new idea for the image fusion rules by using image quality evaluation to conduct iterative fusion to the images; however, structure similarity [8] (SSIM) has single computational scale; it doesn’t consider the pixel position information and it has bad infrared image processing effect [9].
TELKOMNIKA Vol. 14, No. 2 2. Nonsub Sampled Contour NSCT is made up of Filter Bank (NSDFB), as ind àtrous algorithm, which has lo representation to the image presentation of high-frequency
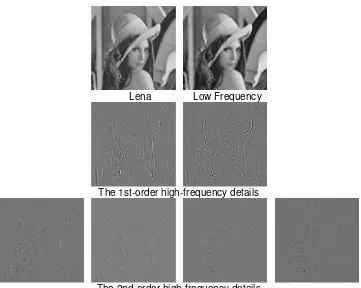
Figure 2 is the resul decomposition result, it can b is decomposed by NSDFB s such singular characteristics a
T
Figure 2. R
. 2, June 2016 : 613 – 621 urlet Transform (NSCT)
of NonsubSampled Pyramid (NSP) and NonsubSa ndicated in Figure 1. The nonsubsampling proce low computational complexity. NSP mainly perform e and NSDFB realizes the translation invariance
cy details.
Figure 1. Constitution of NSCT
sult of 2nd-order NSCT decomposition of Lena be seen that the high-frequency sub-band after th shows different directivity; therefore, NSCT can s as the image curve.
Lena Low Frequency
The 1st-order high-frequency details
The 2nd-order high-frequency details
. Result of 2nd-order nsct decomposition of lena
Sampled Directional cess is realized by rms multi-resolution ce and obtains the
TELKOMNIKA
3. Design of Fusion Rule 3.1, Low-Frequency Coefficie
The low-frequency c energy and it can be seen spectral imaging of the same correlation. The component wi component with high correlati fuses the component with low weight phase congruency and
The physiological a characteristics that people p frequency domain, namely tha feature information [11]. The recognizing object features. structure and it has nothing define the image feature whe feature in the maximum phase
of the sum of the filter respons response in certain scale, n is
( ) ( ) ( ) n n E x PC x A x ε
The calculation of the used log-Gabor filter in the representation is indicated as F
2 2
log /
( , ) exp
2 r
G ω θ ω ω
σ
Here, ω0 is the cente
is the Azimuth of the filter, θj ,
θ
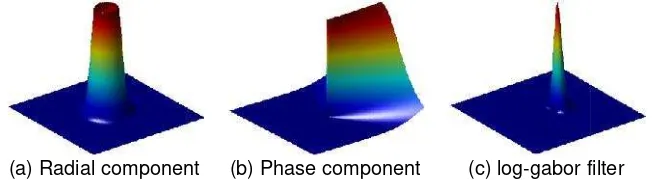
σ control the angle bandwid diagram of log-Gabor filter freq
(a) Radial compon
Figure 3.
For the 2D image f x( ) constructed by log-Gabor filte domain responses by adjustin
the filter response in Point x,
, j( ), , j( ) (
n n
e θ x o θ x f
ISSN: 1693-6930
icient Fusion Based on Weight Phase Congruen coefficients after NSCT decomposition include n as the approximate component of the image. e scene, the decomposed low-frequency coefficie with low correlation means bigger differences in th lation means that the image has approximate stru low correlation and the component with high cor nd taking mean value respectively [10].
and psychological research results demon pay attention to have certain phase congruen that the points with phase congruency include the e theory of phase congruency (PC) builds the mo s. It is a means to measure the significance of
g to do with dimension. Different from the comm where the image grayscale changes, PC model d
ase value. It is defined as Formula (1):E x( ) is the r
onses in different scales, A xn( ) is the room mean s is the scale and ε is a non-zero constant.
) x
the image filter responses in different scales choos the image analysis field. Its two-dimensional fr
s Formula (2):
2
20 2 2 / exp 2 j r θ θ θ ω σ σ
ter frequency of the filter, σr controls the bandwid
/
j j J
θ π , j{0,1,,J1}, J is the number of width of the Azimuth of the filter. Figure 3 is the th requency domain.
onent (b) Phase component (c) log-gabor fi
3. Three-dimensional diagram of log-gabor filter
( )x , o n
M and e
n
M are the orthogonal odd- and even filter in the scale n respectively. To change the ting ω0 and θj convolves o
n
M and e
n
M with image x, which his shown as Formula (3):
( ) ne, ( ) no
f x M f x M
615
ency
e the main image e. For the different ients have different the image while the tructure. This paper orrelation by using
onstrate that the ency in the image the important image model of mammals of the local image mon models which l defines the image e root mean square
n square of the filter
(1)ooses the frequency domain
(2)width of the filter, θj
, of the Azimuths and
e three-dimensional
r filter
en- symmetry filters the filter frequency-gef x( ) and obtains
TELKOMNIKA Vol. 14, No. 2, June 2016 : 613 – 621
The amplitude response and energy under different directions and scales are indicated as follows:
2 2
, j( ) , j( ) , j( )
n n o
Aθ x e θ x e θ x (4)
2
2, ,
( ) ( ) ( )
j n n j n o j
Eθ x
e θ x
e θ x (5)According to Formula (1), the PC value of 2D image signal is as follows:
2
, ( ) ( )
( )
j
j
j D
n
j n
E x
PC x
A x
θ
θ
ε
(6)Given the position information of the image pixel, this paper weights by using the phase congruency Gaussian function performs on low-frequency coefficients and proposes Gauss Weight Phase Congruency (GWPC) to measure the image structure features. The Gaussian function used in this paper is as follows:
2
2 ( )
X
G x e σ
(7)
Therefore, the representation formula of the low-frequency coefficient GWPC is indicated as follows:
( ) ( ) ( )
GWPC low low
S x PC x G x
(8)
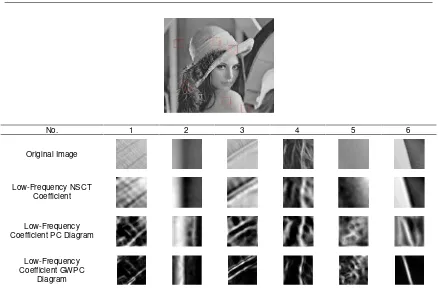
It can be seen from the above PC theory model that PC value reflects the sensitivity of different image structures on human vision and it is the important basis to measure the image structure features. As for different image structure region, the calculation result of GWPC is demonstrated as Figure 4.
As for the correlation measure of low-frequency coefficients, this paper uses the 4th-order correlation coefficient [12] which has excellent detail description ability to measure the correlation of infrared and visible images and it is defined as follows:
2 2
,
4 4
( ) ( ) ( )
( ) ( )
A B
y A B
A B
y y
A y B y
C x
A y B y
µ µ
µ µ
(9)
Here, µA and µB are the image mean. The relationship between the low-frequency
coefficient F low
C by integrating correlation and GWPC and the low-frequency coefficients A low
C and
B low
C of the source image is as follows:
,
, 2
A B
low low
A B h
F low
A B
A low B low A B h
C C
C T
C
w C w C C T
(10)
As for the coefficient with high correlation between infrared and visible images, it is fused by taking the mean; otherwise, it is fused by weight GWPC. The weight uses the form indicated as the formula below:
A GWPC
A A B
GWPC GWPC
S w
S S
TELKOMNIKA ISSN: 1693-6930 617
No. 1 2 3 4 5 6
Original Image
Low-Frequency NSCT Coefficient
Low-Frequency Coefficient PC Diagram
Low-Frequency Coefficient GWPC
Diagram
Figure 4. Image phase congruency diagram of different structure features
3.2. High-Frequency Coefficient Fusion Based on Gauss Weight SML
The high-frequency coefficients decomposed by NSCT represent the detail information of infrared and visible images. The fusion method to choose the maximum absolute value doesn’t take the impact of the neighborhood pixels into consideration and as an operation method based on points, this method is easy to be affected by noises. Sum Modified Laplacian (SML) better reflects the edge features of different image structures and it can represent the image sharpness and definition. This paper fuses high-frequency coefficients via Gauss weight SML, which is defined as follows:
2
, ,
( , ) ( , )
Q P
l k l k
a P b Q
SML i j ML i a j b
(12), , , ,
, , ,
( , ) 2 ( , ) ( , ) ( , )
2 ( , ) ( , ) ( , )
l k l k l k l k
l k l k l k
ML i j H i j H i r j H i r j
H i j H i j r H i j r
(13)
Here, l k,
H is the 1st-order k-direction high-frequency sub-band coefficient after NSCT decomposition and r is the radius of the neighborhood window. Formula (12) doesn’t take the influence of the pixel position into account. Literature [13] proposes a normalized SML (NSML), introduces position information into ML through weighting matrix and emphasizes the contribution of the pixels at different distances to the central pixel. This literature uses the following weight formula:
(2 1) (2 1) (2 1) (2 Q 1)1 ˆ
( , )
ˆ( , ) P
P Q
P Q
a P b Q
a b W
W a b
ω
(14)(2 1) (2 Q 1)
ˆ T
P
TELKOMNIKA Vol. 14, No. 2
Here, X [1, 2,,P ,
dimensional diagram of its we weight calculation method is n central pixel is emphasized a weight. The sum of the norma is as follows:
ω( , )a b
(2P 1) (2Q 1) e
Here,σ is the varianc
(a) Weig
Gauss weight SML is d
,
( , ) ( , )
Q P l k
a P b Q
WSML i j ωa b
Here, weight function
high-frequency coefficients of and the fused coefficient and w
, ,
l k A l k B
F WSML A WSM
H W H W
,
, ,
l k
A A
WSML l k l k
A B WSML W WSML WSML ,
4. Experiment Result and An 4.1. Objective Evaluation Crit
The evaluation indexe gradient and spatial frequency
Entropy: it measures th
1 0 log L i i i
E p p
Here, pi is the possib Standard deviation: it visual contrast.
F
I
µ is the aver
1 1 1 ( M N F i j I i M N σ
. 2, June 2016 : 613 – 621
1 ( 2 1) ,P 1, , 2,1] P
,
(2 1) 1 [1, 2, , 1, , 2,1] Q
Y Q a
weight matrix is indicated in Figure 5(a). It can be s s not isotropic. Gaussian function satisfies the requ
and that the pixel which is closer to the central malized weights is 1 and it is isotropic. Its weight ca
2 2 2 2 X Y e σ ance and its three-dimensional diagram is shown as
eight of literature [13] (b) Gauss weight
Figure 5. Weight function
is demonstrated as Formula (17):
2 ,
) l k( , )
b ML i a j b
n ω( , )a b takes value according to Formula (16). A of the source image are l k,
A
H and l k,
B
H , the fused d weight are indicated as Formula (18) and (19):
,
B l k
SMLHB
, 1
A A
WSML WSML
W W
Analysis
Criteria of Image Fusion
exes of image fusion include entropy, standard d cy. Their specific definitions are clarified as follows s the amount of information in the image.
sibility that the pixel value i appears in the image. it measures the brightness fluctuation of the image verage brightness of the image.
2( , )
F I
i j µ
, and the
seen here that this quirements that the tral pixel has bigger t calculation formula
(16)
as Figure 5(b).
(17)). Assuming that the
d coefficient is l k,
F
H
(18)
, (19)
deviation, average ws:
(20).
ge and it shows the
TELKOMNIKA
Average gradient: it m
2
1 1
( ,
( 1)(
M N i F i j
I x y
g
M N
Spatial frequency: it m
2 2
RF CF
SF F F
Here, FRF and FCF rep
1 1
0 1
1
( ,
M N R F
i j
F f i
M N
1 1
0 1
1
( ,
N M C F
j i
F f i
M N
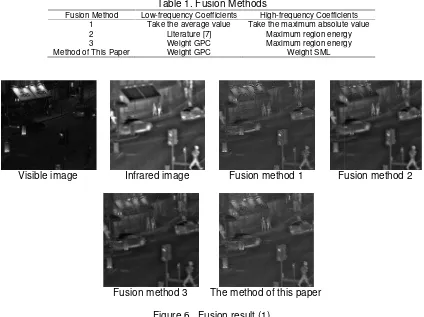
4.2. Experiment Result and A This section compare and visible images. The fusio coefficients all use congruenc This paper evaluates the entro the fusion results and the eval
Fusion Method 1 2 3
Method of This Paper
Visible image In
Fusi
ISSN: 1693-6930
t measures the image definition.
2
, ) ( , ) 2
)( 1)
j F
y I x y
N
t measures the image detail information.
represent the horizontal and vertical frequencies.
2( , )i j f i j( , 1)
2( , )i j f i( 1, )j
d Analysis
res the fusion effects different fusion algorithms pla sion methods used are shown in Table 1 and th ncy test [14]. The fusion results are indicated in F tropy, standard deviation, average gradient and sp valuation result is indicated in Table 2.
Table 1. Fusion Methods
Low-frequency Coefficients High-frequency Coefficie Take the average value Take the maximum absolute Literature [7] Maximum region energ Weight GPC Maximum region energ
er Weight GPC Weight SML
Infrared image Fusion method 1 Fu
usion method 3 The method of this paper
Figure 6. Fusion result (1)
619
(22)
(23)
.
(24)
(25)play on the infrared the high-frequency Figure 6, 7 and 8. spatial frequency of
cients ute value ergy ergy
TELKOMNIKA Vol. 14, No. 2 Visible image
Fusion method (2)
Visible image
Fusion method (2)
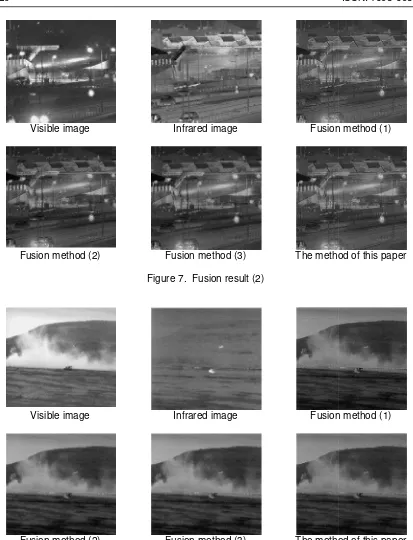
From the experiment paper is better than the other fused image by taking the a evaluation in Literature [7] lo coefficient fusion method by effectively preserves the struc frequency coefficient fusion, th operation is bad in anti-noise
. 2, June 2016 : 613 – 621
Infrared image Fusion
Fusion method (3) The metho
Figure 7. Fusion result (2)
Infrared image Fusion
Fusion method (3) The metho
Figure 8. Fusion result (3)
nt result, it can be seen that the fusion effect by th er three fusion methods. In the low-frequency coef average value is quite fuzzy. The method to u loses some image structure information while th
by using the correlation coefficients and GWP ucture information of the infrared and visible image
, the method to take the maximum absolute valu se performance. The method based on region ope
on method (1)
thod of this paper
on method (1)
thod of this paper
TELKOMNIKA ISSN: 1693-6930 621
anti-noise performance while the processing method of this paper in the high frequency maintains more detail information compared to other methods.
5. Conclusion
This paper decomposes infrared and visible images by using NSCT to obtain image frequency domain representation in scales and it fuses the low- and high-frequency coefficients through the combination of correlation coefficient and weight GWPC and Gaussian weight SML respectively. Both the low- and high-frequency coefficient fusions have taken the influence the position information plays on the fusion result into consideration. The fusion experiment of the standard test image shows that the method of this paper better preserves the structural information of the original image and the high-frequency detail information, fuses the imaging features of the infrared and visible images, improves the visual effect and lays a solid foundation for the follow-up image analysis.
References
[1] Starck JL, Candès EJ, Donoho DL. The Curvelet Transform for Image Denoising.IEEE Transactions on Image Processing.2002; 11(6): 670-684.
[2] Da Cunha AL, Zhou J, Do MN. The Nonsubsampled Contourlet Transform: Theory, Design, and Applications.IEEE Transactions on Image Processing. 2006; 15(10): 3089-3101.
[3] Zhao Chunhui, Ma Lijuan, Shao Guofeng. An Image Fusion Algorithm using WA-WBA and Improved INSCT.Journal of Electronics and Information. 2014; 36(2): 304-311.
[4] Adu J, Gan J, Wang Y, et al. Image Fusion Based on Nonsubsampled Contourlet Transform for Infrared and Visible Light Image.Infrared Physics & Technology. 2013; 61: 94-100.
[5] Yin M, Liu W, Zhao X, et al. A Novel Image Fusion Algorithm Based on Nonsubsampled Shearlet Transform.Optik-International Journal for Light and Electron Optics. 2014; 125(10): 2274-2282. [6] Liu Yushu. Research on Image Denoising and Fusion Algorithm Based on Multi-scale Transform.
Disertation. Jinan & Shandong University; 2013.
[7] Gao Yinhan, Chen Guangqiu, Liu Yanyan. Adaptive Image Fusion Based on Image Quality Assessment Parameter in NSST System. Journal of Jilin University (Engineering Edition).2014; 6(1): 225-234.
[8] Wang Z, Bovik AC, Sheikh HR, et al. Image Quality Assessment: from Error Visibility to Structural Similarity.IEEE Transactions on Image Processing. 2004; 13(4): 600-612.
[9] Jingfeng MI, Qing Wu Li, Zhu Hao, et al. An Improved Image Quality Assessment Method Based on Structural Similarity.Computer Technology and Development. 2014; 24(3): 67-70.
[10] Jianhua Liu, Jianguo Yang, Beizhi Li. Multifocus Image Fusion by SML in the Shearlet Subbands.
TELKOMNIKA Indonesian Journal of Electrical Engineering. 2014; 12(1): 618-626.
[11] Dexiang Hang. Fusion of Multiband SAR Images Based on Directionlet Transform. TELKOMNIKA Indonesian Journal of Electrical Engineering. 2014; 12(1): 506-513.
[12] Mahyari AG, Yazdi M. Panchromatic and Multispectral Image Fusion Based on Maximization of both Spectral and Spatial Similarities. IEEE Transactions on Geoscience and Remote Sensing. 2011; 49(6): 1976-1985.
[13] Yin M, Liu W, Zhao X, et al. A Novel Image Fusion Algorithm Based on Nonsubsampled Shearlet Transform.Optik-International Journal for Light and Electron Optics. 2014; 125(10): 2274-2282. [14] Li H, Manjunath BS, Mitra SK. Multisensor Image Fusion using the Wavelet Transform. Graphical