ISSN: 1693-6930
accredited by DGHE (DIKTI), Decree No: 51/Dikti/Kep/2010 227
Neural Network Based Indexing and Recognition of
Power Quality Disturbances
Manoj Gupta*, Rajesh Kumar, Ram Awtar Gupta
Department of Electrical Engineering, Malaviya National Institute of Technology Jaipur-302017, Rajasthan, India
e-mail: [email protected]*, [email protected], [email protected]
Abstrak
Analisis kualitas daya atau power quality (PQ) telah menjadi keharusan terutama bagi konsumen untuk menghindari biaya besar akibat kualitas daya yang buruk. Pengenalan PQ secara akurat masih merupakan pekerjaan yang menantang sedangkan metode untuk pengindeksannya belum banyak dilakukan. Makalah ini menguraikan sistem yang mencakup pembangkitan pola unik yang disebut tanda-tanda gangguan PQ menggunakan transformasi wavelet kontinyu atau continuous wavelet transform (CWT) dan pengenalan tanda-tanda menggunakan umpan maju jaringan syaraf tiruan. Hal ini juga dikuatkan bahwa ukuran tanda gangguan PQ bersifat proporsional sehingga fitur ini digunakan untuk indeks tingkat gangguan PQ dalam tiga sub-kelas, yaitu tinggi, sedang, dan rendah. Lebih lanjut, juga dianalisis efek jumlah neuron yang digunakan jaringan syaraf tiruan dalam pengenalan kualitas. Keefektifitasan sistem yang diusulkan memiliki akurasi substansi pengenalan hampir 100%.
Kata Kunci: jaringan syaraf tiruan umpan maju, kualitas daya, pengenalan, transformasi wavelet kontinyu
Abstract
Power quality (PQ) analysis has become imperative for utilities as well as for consumers due to huge cost burden of poor power quality. Accurate recognition of PQ disturbances is still a challenging task, whereas methods for its indexing are not much investigated yet. This paper expounds a system, which includes generation of unique patterns called signatures of various PQ disturbances using continuous wavelet transform (CWT) and recognition of these signatures using feed-forward neural network. It is also corroborated that the size of signatures of PQ disturbances are proportional to its magnitude, so this feature of the signature is used for indexing the level of PQ disturbance in three sub-classes’ viz. high, medium, and low. Further, the effect of number of neurons used by neural network on the performance of recognition is also analyzed. Almost 100% accuracy of recognition substantiates the effectiveness of the proposed system.
Keywords: continuous wavelet transform, feed forward neural network, power quality, recognition
1. Introduction
The continuous monitoring of power quality (PQ) has become imperative as occurrences of PQ disturbances are relatively sporadic and mostly unscheduled. Further, when something goes wrong and the source of the problem needs to be investigated, whether upstream or downstream of the issue, PQ data is an absolute necessity. The analysis of PQ disturbances can be done in two ways, that is online and offline analysis. The offline PQ analysis is done when immediate analysis and communication of analysis results are not required but it plays rudimentary role in system performance evaluation, problem characterization and just-in-time maintenance. On the other hand, online analysis is done within the instrument itself or instantly upon occurrence of any of the PQ disturbance at the central processing location.
cause behind it so that mitigation actions can be initiated. This is a challenging task [2], as it requires effective and new signal processing techniques for analyzing the PQ disturbances [3] along with good knowledge of power system and application of advanced mathematical tools and artificial Intelligence techniques. Literature survey in [4] shows that research in the area of analysis of PQ disturbances has been increasing from last many years and it is still a most sought after area with bounty of scope for innovations by developing new tools and techniques.
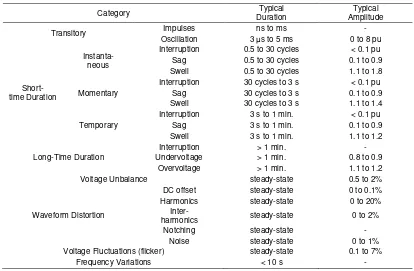
Table 1. IEEE Std. 1159-1995
Since, most of the PQ disturbances are transient in nature; they can be better analyzed by methods which deploy time-frequency representation (TFR) of the signals. The short time fourier transform is the simplest TFR but it suffers from the problem of fixed length of the window function, which results in the problem of resolution i.e. narrow window gives good time resolution but poor frequency resolution and wide window gives good frequency resolution but poor time resolution. Whereas, for PQ analysis, we need high time resolution for the high frequency range and low time resolution for the low frequency range. The continuous wavelet transform (CWT) overcome this problem of resolution. In CWT analysis, width of window function is changed so that it can analyze the low frequency content of signal with longer time intervals and high frequency content of signal with shorter time intervals. Wavelet transform based analysis of PQ disturbances engenders a multi-resolution decomposition matrix, which contains time domain information of the signal at different scales. This property has made wavelets a expectant tool for detecting and extracting the features of various types of PQ disturbances [5]-[8]. As such, discrete wavelet transform is popular for signal processing due to its less computational burden along with quite a good speed but still importance of CWT cannot be ruled out for analysis of PQ disturbances CWT [9], [10]. S-Transform can also be used as TFR of a signal and important features can be extracted using this transform [11]. Further, the artificial intelligence techniques [12]-[15] along with various signal processing techniques are effectively employed in classification of PQ disturbances.
Based on the work presented in reference [16], signatures of various power quality disturbances namely sag, swell, transient, harmonics, and flicker were obtained using CWT. It was corroborated that these signatures are unique in shape for a particular type of PQ disturbance and their size is proportional to the amplitude of the PQ disturbance. Hence, these
Category Typical Voltage Unbalance steady-state 0.5 to 2%
Waveform Distortion
DC offset steady-state 0 to 0.1% Harmonics steady-state 0 to 20%
Inter-
harmonics steady-state 0 to 2% Notching steady-state -
Noise steady-state 0 to 1% Voltage Fluctuations (flicker) steady-state 0.1 to 7%
signatures are used for recognition of different PQ disturbances as well as for indexing the level of PQ disturbance as high, medium, and low. The signatures obtained using the approach as mentioned above are then used for recognition of the PQ disturbances using the feed forward neural network.
2. Research Method
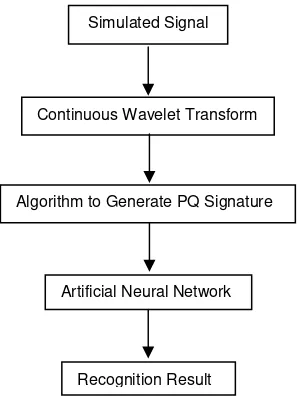
The schematic block diagram for the complete system for generation and recognition of signatures of PQ disturbances is shown in Figure 1. The system has three main components. First is the generation of the synthetic waveforms of different PQ disturbance namely sag, swell, transient, harmonics, and flicker for different magnitudes. Second is the generation of signatures of these disturbances using CWT. Third is application of neural network for recognition of PQ disturbances.
Figure 1. Block diagram for generation and recognition of signatures of PQ disturbances
2.1 Neural Network Model
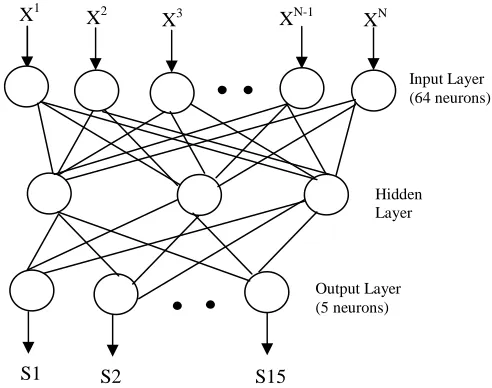
Neural networks are good at recognizing patterns and they are extensively applied for the analysis of PQ disturbances [12]-[16]. One of the most basic and well-known architecture in neural networks is the Multiple Layer Preceptorn (MLP). Figure 2 depicts this architecture with two layers of neurons, which is implemented in this paper. The theorem of Hornik-Stinchcombe-White states that “a neural network with two layers is sufficient to make a precise and desirable approximation of a continuous mapping marked with a finite dimensional space to another, provided the sufficiency of neurons in the hidden layers”. In our case, this holds true; as only two layers give excellent results. The neural network toolbox of MATLAB provides the graphical user interface (GUI) based neural network pattern recognition tool “nprtool”, which is employed in this work for recognition of various signatures of PQ, as generated above. The two-layer feed-forward network architecture as shown in Figure 2, comprised of sigmoid hidden and output neurons (newpr).
64 neurons are taken in input layer because size of each input signature matrix is 64x1. Since, 05 types of PQ disturbances divided in 15 class of PQ disturbances are considered for recognition purpose in this work; so, there are 15 neurons in the output layer. The number of neurons opted for hidden layer are based on hit and trial. First, 05 neurons are taken for hidden layers and the performance of neural network is evaluated and then the number is increased in increment of 05 neurons up to maximum 30 neurons. Since, we want to confirm the outputs of neural network between 0 and 1 for recognition purpose, so sigmoid transfer function at output layer is most appropriate in this case.
Simulated Signal
Continuous Wavelet Transform
Algorithm to Generate PQ Signature
Artificial Neural Network
Figure 2. Architecture of the two layer feed forward neual network
3. The Proposed Algorithm
3.1 CWT based Algorithm for Generating Signatures of PQ Disturbances
The Continuous Wavelet Transform (CWT) is a time-frequency representation of signals. It is convolution of a signal s(t) with a set of functions, which are generated by translations and dilations of a main function. The main function is known as the mother wavelet and the translated or dilated functions are called wavelets. Mathematically, the CWT of a signal x(t) is given by (1):
As shown in Figure 3, the CWT coefficients of pure signal are calculated and taken as reference and the CWT coefficients of PQ disturbance signal are subtracted from it, which gives the difference coefficient matrix (DCM). On careful investigation of DCM, it reveals that the scale/row wise value of coefficients of DCM follow a particular pattern for a particular PQ disturbance according to the location of the disturbance. Therefore, the coefficients of each row of DCM are summed, which gives a matrix named as the unique feature matrix (UFM).
It is shown that the UFM posses a unique feature for a particular PQ disturbance. This feature on plotting gives unique pattern for a particular type of PQ disturbance. These unique patterns can be treated as signatures of their respective PQ disturbance. it is also observed that the size of this pattern varies in proportion to the magnitude of the disturbance but the shape remains the same for one particular type of PQ disturbance.
Figure 3. Algorithm for generating signatures of PQ disturbances
3.2 Generation of Signatures of PQ Disturbances
In this section, the generation of signature of sag is explained in length, whereas other PQ signatures are obtained after replicating the same process. Although, the sag and interruption are the two different types of PQ disturbances but they are characterized as a singly type of disturbance in this paper owing to their akin stance of producing signature of similar shape as both are associated to voltage dip.
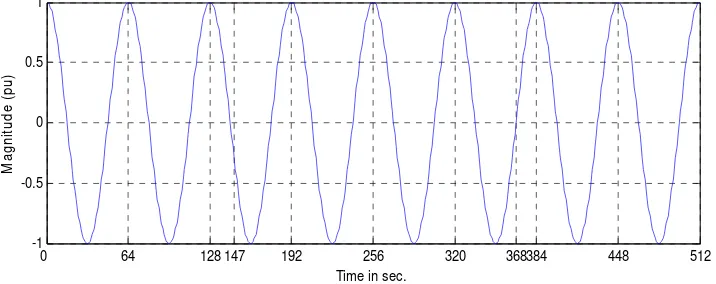
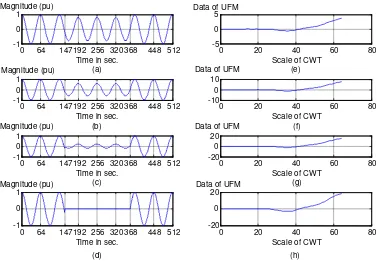
Pure sinusoidal signal is generated synthetically and shown in Figure 4 and can be visualize as matrix P of dimension of 1x512 is obtained for the pure signal. Similarly, the disturbance signals of sag with different magnitude (i.e. sag-0.2 pu, sag-0.6 pu., sag-0.8 pu. and interruption) are generated by programming in MATLAB as shown in Figures 5(a), 5(b), 5(c) and 5(d) and accordingly matrixes of dimension of 1x512 are obtained for each of the disturbance signal of sag with different magnitude. CWT coefficient matrix of pure sinusoidal signal and each disturbance signal of sag is obtained as mentioned in algorithm. The dimensions of these matrixes are 64x512. Then, the DCM is obtained by subtracting CWT coefficient matrix of each of the disturbance signal of sag from corresponding matrix of pure sinusoidal signal, which gives dimension of 64x512 for DCM. Thereafter, UFM is calculated by summing coefficients of each row of DCM, which gave UFM of dimensions of 64x1. These 64 data’s are plotted with respect to their row number (i.e. scales of CWT) and the patterns as shown in Figures 5(e), 5(f), 5(g) and 5(h) are obtained for their respective disturbance signals (i.e. sag-0.2 pu, sag-0.6 pu., sag-0.8 pu. and interruption).
It is clear, that the shape of all the patterns is same as shown in Figures 5(e), 5(f), 5(g) and 5(h). These patterns are plotted on a single graph as shown in Figure 6 and it reveals that the shape of all the patterns is exactly same. This unique shape, as shown in Figure 7 can be taken as the signature for the sag and interruption disturbance of PQ.
0 64 128 147 192 256 320 368384 448 512
Figure 4. Pure sinusoidal signal
Figure 5. The disturbance signals of sag with different magnitude; (a) sag - 0.2 pu, (b) sag - 0.4 pu, (c) sag - 0.6 pu, (d) interruption, (e) pattern of sag - 0.2 pu, (f) pattern of sag - 0.4 pu, (g)
pattern of sag - 0.6 pu, and (h) pattern of interruption.
0 10 20 30 40 50 60 70
Figure 6. Patterns for interruption and sag - 0.2, 0.6 and 0.8 pu.
0 20 40 60 80
Figure 7. Signature for sag
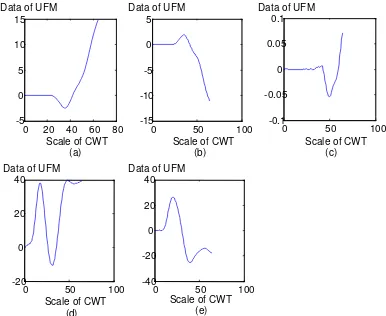
The signatures of five types of PQ disturbances are generated after replicating above algorithm and shown in Figure 8.
Figure 8. (a) Signature for sag and interruption, (b) signature for swell, (c) signature for transient (d) Signature for harmonics, and (e) signature for flicker.
Figure 6 reveals that the size of the signature of PQ disturbance is proportional to the magnitude of the disturbance. This feature makes this algorithm unique because it is capable of giving information about the level of disturbance. Hence, each of these five disturbances is further divided in three sub classes of disturbance depending on their magnitude i.e. high, medium, and low. The level of PQ disturbance is decided by dividing the range of magnitude of PQ disturbance as mentioned in Table 2 into three categories.
Table 2. Indexing of PQ disturbances
No. PQ Disturbance Indexing Name Typical Magnitude
4. Results and Discussion
The formulated network was trained with 45 samples of PQ signatures consisting of 03 samples per disturbance class for total 15 disturbances classes formed from different magnitudes of sag, swell, transient, harmonics, and flicker. The three samples taken for training for a particular type of PQ disturbance belong to one from each sub-class of high, medium and low level of indexing. The number of samples for training, validation and testing were chosen randomly as given in Table 3.
Table 3. The number of samples for training, validation, and testing
Mode Samples in % Number of Samples
Training 70 33
Validation 15 06
Testing 15 06
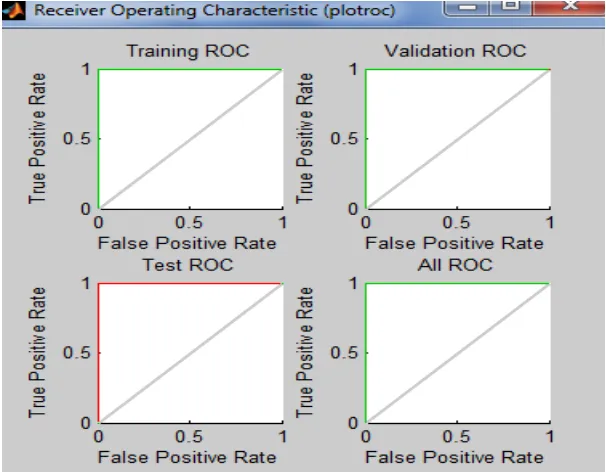
The network was trained with scaled conjugate gradient backpropagation training algorithm. It is shown in Figure 9 that there is perfect hug in ROC curves to the left and top edges. Further, 100% recognition performance given in confusion matrix of training, test and validation shows good performance of training.
Figure 9. Receiver operating characteristic (ROC)
(a) (b)
(c) (d)
(e) (f)
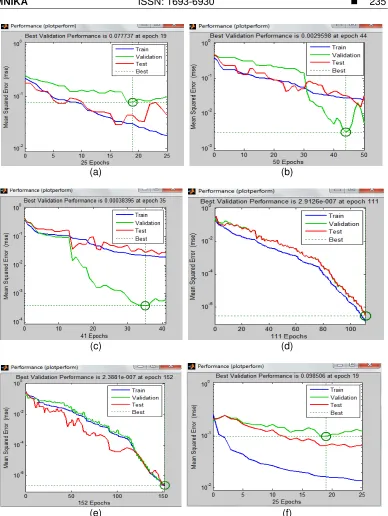
Figure 10. Performance Plots for (a) 5 neurons, (b) 10 neurons, (c) 15 neurons, (d) 20 neurons, (e) 25 neurons, and (f) 30 neurons
Table 4. Performance of neural network based on number of neurons
S. No. No. of neurons in hidden layer
Best validation performance Overall accuracy
(%) Mean squared error
(mse)
epochs
1 5 0.077737000 19 98.9
2 10 0.002959980 44 98.9
3 15 0.000383900 35 97.8
4 20 0.000000291 111 97.8
5 25 0.000000238 152 98.9
5. Conclusion
A system for recognition of power quality disturbances with its indexing using neural network is presented in this paper. The proposed system of generation and recognition of signatures of various PQ disturbances is capable of recognition of various PQ disturbances i.e. sag, interruption, swell, transient, harmonics, and flicker along with its indexing with almost 100% accuracy. The diminutive error may be due to some PQ disturbance, which is at threshold with other type of PQ disturbances. It is also shown that the overall accuracy is nearly 98% irrespective of number of neurons in the hidden layer. The effect of change in location of PQ disturbance on shape and size of the signatures is not examined in this work and it is a matter to contemplate it in future.
References
[1] IEEE Standards Board. IEEE Std. 1159-1995. IEEE Recommended Practice for Monitoring Electric Power Quality. New York: IEEE, Inc. June, 1995.
[2] McGranaghan MF, Santoso S. Challenges and Trends in Analyses of Electric Power Quality Measurement Data. EURASIP Journal on Advances in Signal Processing. 2007.
[3] Ribeiro MV, Szczupak J, Iravani MR, Gu IYH, Dash PK, Mamishev AV. Emerging Signal Processing Techniques for Power Quality Applications. EURASIP Journal on Advances in Signal Processing. 2007.
[4] Ibrahim WRA, Morcos MM. Artificial Intelligence and Advanced Mathematical Tools for Power Quality Applications: a Survey. IEEE Transaction on Power Delivery. 2002; 17(2): 668-673.
[5] Santoso S, Powers EJ, Grady WM. Electric Power Quality Disturbance Detection Using Wavelet Transform Analysis. IEEE-SP International Symposium on Time-Frequency and Time-Scale Analysis. 1994; 166-169.
[6] Tse NCF. Practical Application of Wavelet to Power Quality Analysis. IEEE Power Engineering Society General Meeting. 2006: 5.
[7] Kanitpanyacharoean W, Premrudeepreechacharn S. Power Quality Problem Classification Using Wavelet Transformation and Artificial Neural Networks. IEEE Region 10 Conference. 2004; 3: 252-255.
[8] Perunicic B, Mallini M, Wang Z, Liu Y, Heydt GT. Power Quality Disturbance Detection and Classification Using Wavelets and Artificial Neural Networks. 8th International Conference on Harmonics and Quality of Power. 1998; 77-82.
[9] Basu, Basu B. Analysis of Power Quality Signals by Continuous Wavelet Transform. IEEE Power Electronics Specialists Conference. 2007; 2614-2618.
[10] Gonzalez D, Balcells J, Bialasiewicz JT. Exploration of Application of Continuous Wavelet Transform to Power Quality Analysis. IEEE International Symposium on IndustrialElectronics. 2008; 2242-2246. [11] Pullabhatla S, Chandel AK, Kanasottu AN. Inverse S-Transform Based Decision Tree for Power
System Faults Identification. TELKOMNIKA Indonesian Journal of Electrical Engineering. 2011; 9(1): 99-106
[12] Taboada JD, Cabrera JC, Ramos G, Torres MT. Pattern Recognition of Phenomena Associated to Power QuaIity Using Neural Networks. IEEE/PES Trans. & Distri. Con. & Exposition: Latin America. 2004; 1-5.
[13] Siu HK, Ngan HW. Automatic Power Quality Recognition System Using Wavelet Analysis. IEEE International Conference on Electric Utility Deregulation, Restructuring and Power Technologies (DRPT 2004). Hong Kong. 2004; 311-315.
[14] Cesar DG, Valdomiro VG, Gabriel OP. Automatic Power Quality Disturbances Detection and Classification Based on Discrete Wavelet Transform and Artificial Intelligence. IEEE. 2006; 1-6. [15] Weijian H, Weili H. Automatic Power Quality Recognition and Analysis System Using Wavelet-based
Neural Network. 27th Chinese Control Conference (CCC). 2008; 222 – 225.