EFFICIENCY OF RICE MILLING INDUSTRY
Case Study: Two Sub-Districts in Cianjur Regency,
West Java Province
CILA APRIANDE
GRADUATE SCHOOL
BOGOR AGRICULTURAL UNIVERSITY BOGOR
iii
DECLARATION
I, Cila Apriande, hereby declare that the thesis entitled Efficiency of Rice Milling Industry, Case Study: Two Sub-Districts in Cianjur Regency, West Java Province submitted to fulfill a requirement for the award of Master of Science in Agribusiness from Bogor Agricultural University is my own piece work produced through the guidance of my academic advisors and to the best of my knowledge. It has not been submitted for the award of any degree in any other academic institutions. This thesis does not contain any pieces of work of other person, except those are duly acknowledge and referenced in the text.
I hereby assign the copyright of my thesis to the Bogor Agricultural University.
Bogor, February 2013
Cila Apriande
v
ABSTRACT
CILA APRIANDE. Efficiency of Rice Milling Industry, Case Study: Two Sub-Districts in Cianjur Regency, West Java Province. Supervised by RACHMAT
PAMBUDY, NUNUNG KUSNADI, and STEPHAN VON
CRAMON-TAUBADEL.
In rice agribusiness system of Indonesia, rice milling industry has an important role. This industry plays role as connector between paddy producers (farmers) and consumers of rice. The industry is dominated by small scale and old machine used. There are three types of rice miller business management, namely
makloon, non-makloon, and combination of both. This study aims to describe characteristics and determine relative efficiency of rice milling industry. The study was conducted in Gekbrong and Warungkondang, Cianjur Regency as one of largest paddy producer in West Java. 94 rice millers were selected purposively as sample. Mostly, owner of rice millers were male, rice miller business as main job, and ownership of rice miller was private. Rice milling industry was dominated by makloon type. This type offered milling service to consumers and had small capacity. Variable return to scale DEA output orientated model was used to determine relative efficiency of rice milling industry. This study concluded that rice milling industry in study site was inefficient.
vii
ABSTRAK
CILA APRIANDE. Efisiensi Industri Penggilingan Padi, Studi Kasus: Dua Kecamatan di Kabupaten Cianjur, Provinsi Jawa Barat. Dibimbing oleh
RACHMAT PAMBUDY, NUNUNG KUSNADI, dan STEPHAN VON
CRAMON-TAUBADEL.
Pada sistem agribisnis beras di Indonesia, industri penggilingan padi memiliki peranan penting. Industri ini berperan sebagai penghubung antara produsen padi (petani) dan konsumen beras. Industri ini didominasi oleh penggilingan padi skala kecil dan kondisi mesin yang digunakan sudah tua. Terdapat tiga jenis manajemen bisnis penggilingan padi, yaitu makloon, non-makloon, dan kombinasi keduanya. Penelitian ini bertujuan untuk mendeskripsikan karakteristik dan menentukan efisiensi relatif industri penggilingan padi. Penelitian dilakukan di Kecamatan Gekbrong dan Warungkondang, Kabupaten Cianjur sebagai salah kabupaten penghasil beras terbesar di Jawa Barat. 94 penggilingan padi dipilih secara purposive sebagai sampel. Sebagian besar, pemilik penggilingan padi adalah pria, penggilingan padi adalah sebagai pekerjaan utama, dan kepemilikan penggilingan padi adalah privat. Industri penggilingan padi didominasi oleh jenis makloon. Penggilingan jenis ini menawarkan jasa giling kepada konsumen dan berkapasitas kecil. Model variabel return to scale DEA berorientasi output digunakan untuk menentukan efisiensi relatif industri penggilingan padi. Penelitian ini menyimpulkan bahwa industri penggilingan padi di lokasi penelitian inefisien.
ix
SUMMARY
CILA APRIANDE. Efficiency of Rice Milling Industry, Case Study: Two Sub-Districts in Cianjur Regency, West Java Province. Supervised by RACHMAT
PAMBUDY, NUNUNG KUSNADI, and STEPHAN VON
CRAMON-TAUBADEL.
Rice is one of the main staple foods in Indonesia. In 2012, Indonesian consumption of rice is high, approximately 139 kilogram per capita per year (Pambudy, 2012). Rice is a political commodity that can be an indicator for national stability. Rice is also an important economic indicator in which, rice price is able to reflect the inflation rate and the minimum income in Indonesia. Rice has
an important role for the life of Indonesia’s society. Hence, availability of the rice
must be able to be guaranteed. Governmental efforts to keep the availability of rice are done through established policies, ranging from the production, distribution, and consumption of rice.
Rice milling industry as an important link in paddy processing into rice is required to contribute provision of national rice in terms of quantity and quality. Performance of rice milling industry needs to be developed and improved (Budiharti, Harsono, & Juliana, 2003). In 2002, the number of the rice milling is 109,000 units. It is dominated by small-scale by 95 percent and the rest is large-scale. The average yield that is produced by small rice milling is still low at only 60 percent, medium rice milling is 64 percent, and large rice milling is 65 percent of each dry milled grain that milled in each rice milling. Generally, small scale rice millings are an investment in the 1960s until 1980s (Sawit, 2011). While in 2008, the number of rice milling is decrease. It is about 108,512 units (Thahir, 2010).
Rice milling industry plays an important role in the processing side, is expected to work efficiently and effectively, in order to increasing a national rice production. This is especially with respect to start attainment surplus by 10 million tons of rice in 2014. This is evidenced by milling ratio and quality of rice produced (Nazaruddin, 2012).
This study is aimed to describe characteristic and determine relative efficiency of rice milling industry in Gekbrong and Warungkondang, Cianjur Regency, West Java Province. This study used 94 rice millers that selected purposively, which in 44 units are in Gekbrong and 50 units are in Warungkondang by used questionnaire. Data processing was conducted by used output orientated and variable return to scale (VRS) DEA (Data Envelopment Analysis) model. Determination of efficiency was reffered to Koopmans definition. Rice miller was efficient if operates on the frontier (efficiency score/ES equal to one) and achieves zero slack of all variables used. In addition, to overcome the difference between to sub-districts, a comparative analysis was conducted by using statistical Minitab Release 13.20.
Mostly, owner of rice millers were male, rice miller business as main job, and ownership of rice miller was private. Rice milling industry was dominated by
capacity. This study concluded that rice milling industry in study site was inefficient.
This study was case study of rice milling industry. So, it could not be generalized to general condition of Indonesian including differences of sample size, observations type, location, and so forth. Further research can uses other method or tools programs to examine the efficiency of rice miller and also determine factors affecting inefficiency of rice miller, conducting research in a different location, and so forth related to efficiency of rice milling industry to obtain information that are not captured in this study.
Government is expected to conduct research on rice mill industry efficiency nationally. The research is addressed to obtain information the efficiency of various types of rice miller in all provinces. So, it can be used as consideration in determining the appropriate policy for this industry. Policies are not only considering producers (farmers) and consumers but also rice milling industry as an industry that linking producers and consumers in rice agribusiness system.
xi
© Bogor Agricultural University Right Reserved, 2013
Copyright Reserved
1. No part or all of this thesis maybe excerpted without inclusion and mentioning the sources.
a. Excerption only for research and education use, writing for scientific papers, reporting, critical writing or reviewing of a problem.
b. Excerption does not inflict a financial loss in the proper interest of Bogor Agricultural University
xiii
EFFICIENCY OF RICE MILLING INDUSTRY
Case Study: Two Sub-Districts in Cianjur Regency,
West Java Province
CILA APRIANDE
A thesis
Submitted to the Graduate School in Partial Fulfillment of the Requirement for Master of Science
Degree in Agribusiness
GRADUATE SCHOOL
BOGOR AGRICULTURAL UNIVERSITY BOGOR
xv
Thesis Tittle : EFFICIENCY OF RICE MILLING INDUSTRY Case Study: Two Sub-Districts in Cianjur
Regency, West Java Province
Name : Cila Apriande
Registration Number : H451100041
Approved Advisory Committee
Dr. Ir. Rachmat Pambudy, MS Chairman
Dr. Ir. Nunung Kusnadi, MS Member
Prof. Dr. Stephan von Cramon-Taubadel Member
Agreed
Coordinator of Major Agribusiness Dean of Graduate School
Prof. Dr. Ir. Rita Nurmalina, MS Dr. Ir. Dahrul Syah, M.Sc.Agr
xvii
ACKNOWLEDGMENT
This research would have been impossible without the support from many people. I would like to appreciate everything they have given to me.
First, all praise to Allah SWT, who the most precious and the most merciful for His blessing from the first until the last step of the research process. I would like to acknowledge the support of the Directorate General of Higher Education of Indonesia for funding my study in Germany.
I would like thank to my supervisors from Bogor Agricultural University: Dr. Ir. Rachmat Pambudy, MS and Dr. Ir. Nunung Kusnadi, MS, who support me academically and mentally in thesis writing from beginning until the last step. I would like also to thank my supervisor from Goettingen University, Prof. Stephan von Cramon-Taubadel, for his insight and his constructive criticism of my thesis.
I would acknowledge to Prof. Dr. Rita Nurmalina, MS as the head of Magister Science of Agribusiness and Dr. Ir Suharno, M.Adev as secretary of Magister Science of Agribusiness with regard to the joint degree program between Magister Science of Agribusines, Bogor Agricultural University with Master of International Agribusiness and Rural Development, Goettingen University. I would also thank to all lecturers and staffs in MSA and Department of Agribusiness.
In addition, I am grateful to Mas Yeka, Tsame, Dita, Sulaiman, Pak Yayat, Pak Nasep, Pak Endang, Aa Koko, Aa Dindin, Teh Nur, Teh Santi, Mas Ridwan, Pak H. Asep, Pak H. Iwan and family, all respondents of this thesis, who helps me in the study location to collect the data and to share knowledge and experience. My special thank to Pak Syamsul, Ba Bestri, Ratna MS, Mba Ira, Bang Adnan, Mba Nura, Bang Firman, Ami for discussion and proof reading this thesis. My sincere thank further to all my friends in Magister Science of Agribusiness IPB (MSA 1), Mba Anis, Mba Evita, Hepi, Nana, Iyus, Ratna, Bu Nur, Bang Jemmy, Bang Asrul, Bang Efri, Mba Ika, Bu Sari, Bu Ari, Bang Muis, Teh Nia, Putri, Pak Yadi, Mba Desy, Mba Fitri, Cicin, Mas Ali, Bang Ridho, Mba Sari, Mba Maria, Mba Nuni, Mba Lila, Bang Jay, Mba Eda, Mba Tati, Mas Rikmat,
Family”, PPI Goettingen and Indonesian people in Goettingen, as well as all my friends in SIA program- Goettingen University, for a friendly and warm environment during my study in Goettingen, Germany.
Finally, I would like thank to my family (mother, father, laisa, fajar, and ade lili) and Sulaiman Purba, SE for their love and their support for me. I dedicate this work to my beloved mother and father who always pray for me and provide me their love and taught me the values of life.
Bogor, February 2013
xix
AUTOBIOGRAPHY
Cila Apriande, the author of this thesis, was born in Jakarta, on 1st of June 1988. She is a daughter of Chaerul Anwar and Dede Siti Mursidah. She is the oldest of four children.
TABLE OF CONTENTS
2.1 Rice Milling Industry Overview ... 9
2.2 Efficiency of Variables Used in Study ... 10
2.3 Efficiency Relative ... 11
3.3 Constant Returns to Scale (CRS) DEA Model ... 21
3.4 Variable Return to Scale (VRS) DEA Model ... 22
3.5 Slack ... 24
4 METHOD ... 27
4.1 Data Description ... 27
4.2 Data Processing and Analyzing ... 28
4.3 Comparative Test ... 31
5 OVERVIEW Of RESEARCH AREA ... 34
5.1 An Overview of Cianjur Regency ... 34
5.1.1 Geophysical and Climatic Conditions ... 34
5.1.2 Demography ... 36
5.1.3 Agricultural Conditions ... 36
5.2 Characteristics of Research Locations ... 37
5.2.1 Gekbrong Sub-District ... 37
5.2.2 Warungkondang Sub-District ... 40
xxi
6.1 General Characteristics of Rice Milling Industry ... 42
6.2 Efficiency of Production Factors ... 46
6.2.1 Output Side ... 46
6.2.2 Input Side ... 51
6.3 Relative Efficiency of Rice Milling Industry ... 58
6.4 Comparative Test ... 62
7 CONCLUSION AND SUGGESTION ... 63
7.1 Conclusion ... 63
7.2 Suggestion ... 63
REFERENCES ... 64
LIST OF FIGURES
Figure 1 Rice Agribusiness System ... 5 Figure 2 Technical and Allocative Efficiencies ... 15 Figure 3 Technical and Allocative Efficiencies of Input Orientation ... 17 Figure 4 Input and Output Orientated TE Measures and Return to Scale ... 18 Figure 5 Technical and Allocative Efficiencies of Output Orientation ... 19 Figure 8 Calculation of Scale Efficiency in DEA ... 23 Figure 6 Piece-wise Linear Convex Unit Isoquant ... 25 Figure 7 Efficiency Measurement and Input Slack ... 26 Figure 9 Map of Cianjur Regency ... 34 Figure 10 Percentage of Inhabitants Aged 15 Years and Over by Type of Main
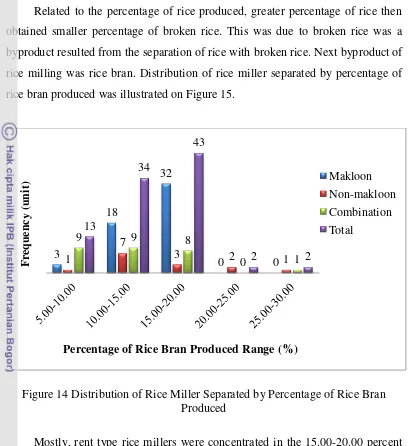
Business Field ... 36 Figure 11 Activities of Rice Miller in Changing Paddy into Rice ... 45 Figure 13 Distribution of Rice Miller Separated by Percentage of Rice Produced ... 47 Figure 14 Distribution of Rice Miller Separated by Percentage of Rice Bran
Produced ... 48 Figure 15 Distribution of Rice Miller Separated by Percentage of Rice Bran
xxiii
LIST OF TABLES
Table 1 Harvest Area (Ha), Productivity (quintal/Ha), and Production (Ton) of 10 Provinces Biggest Paddy Producers in Indonesia 2011 ... 2 Table 2 Harvest Area (Ha), Productivity (quintal/Ha), and Production (Ton) of 10
Provinces Biggest Paddy Producers in West Java Province 2010 ... 3 Table 3 Harvest Area and Type of Irrigation of All Villages in Gekbrong Sub-District in 2010 (Ha) ... 38 Table 4 Dry-land Area and Its Uses in 2010 (Ha) ... 38 Table 5 Number of Rice Mills, by Village in Gekbrong in 2012 (unit)... 39 Table 6 Number of Rice Mills, by Village in Warungkondang in 2012 (unit) ... 40 Table 7 Distribution of Respondents by Type of Rice Milling ... 43 Table 8 Socioeconomic Characteristic of Sample Rice Milling ... 44 Table 9 Average of Slack in Variables Used and Total Rice Miller with Non-Zero
Slack ... 54 Table 10 Summary of Variables Used of Six Rice Millers ... 55 Table 11 Summary of Variables Used of Seven Rice Millers ... 56 Table 12 Summary of Variables Used of Seven Rice Millers ... 57 Table 13 Summary of Average CRSTE, VRSTE, and SE Scores of All
Respondents ... 58 Table 14 Summary of Return to Scale of All Respondents ... 59 Table 15 Summary of Total Rice Miller Separated by Sub-Districts, Efficiency
Score, and Return to Scale Condition ... 60 Table 16 Summary of Total Rice Miller Separated by Type, Efficiency Score, and
Return to Scale Condition ... 60 Table 17 Percentage of Efficient and Inefficient Rice Miller in Gekbrong and
LIST OF APPENDICES
Appendix 1 Percentage of Variables Produced (%) ... 67 Appendix 2 Amount of Output and Input Variables Used ... 69 Appendix 3 Constant Return to Scale Technical Efficiency Scores, Variable
xxv
LIST OF ABBREVIATIONS
AE : Allocative Efficiency CRS : Constant Return to Scale
CRSTE : Constant Return to Scale Technical Efficiency DEA : Data Envelopment Analysis
DEAP : Data Envelopment Analysis Program DMU : Decision Making Unit
DRS : Decreasing Return to Scale EE : Economic Efficiency ES : Efficiency Score
Ha : hectare
IRS : Increasing Return to Scale
Kg : kilogram
MPSS : Most Productive Scale Size NIRS : Non-Increasing Return to Scale P2BN : Peningkatan Produksi Beras Nasional P4 : Program Peningkatan Produksi Padi
Rp : Rupiah
SE : Scale Efficiency TE : Technical Efficiency
1
INTRODUCTION
Rice is one of the main staple foods in Indonesia. In 2012, Indonesian consumption of rice is high, approximately 139 kilogram per capita per year (Pambudy, 2012). Each household, on the average, spends 25 percent of their income for rice. Even, the percentage will get greater to the poor.
Although there has been diversification program that issued by the government, rice is the most preferred food by most of Indonesian. Therefore, the staple food has become strategic for politics, economics, and business in Indonesia. Rice is a political commodity that can be an indicator for national stability. Rice is also an important economic indicator in which, rice price is able to reflect the inflation rate and the minimum income in Indonesia. In addition, rice is one of the five commodities that are commodities focus of development (Directorate General of Marketing and Processing of Agriculture, 2010).
Rice has an important role for the life of Indonesia’s society. Hence,
availability of the rice must be able to be guaranteed. Governmental efforts to keep the availability of rice are done through established policies, ranging from the production, distribution, and consumption of rice.
In production side, in order to meet domestic demand for rice, the government continues to increase Indonesian national production through a variety of policies. This corresponds with UU NO.7 Th. 1996 (Indonesian law) concerning food. This policy is carried out in two ways. First is intensification way. This is done by increasing the productivity of crops and cropping index. Second is extensification way. This is more emphasis on increasing crop land area. In implementation, government by means of Ministry of Agriculture makes a few programs to increase production of rice. This program is known as Program Peningkatan Produksi Padi nasional/P4 (National Rice Production Enhancement Program) (Baga, Pratiwi, & Firdaus, 2008).
and Program Intensifikasi Khusus/Insus (Special Intensification Program). The programs started in 1965 through SK Mentan No. 003 Tahun 1979. In 1984, Indonesia achieves self-sufficiency of rice through Panca Usahatani technology (Five Farming technology). Government continues to evaluate the P4 program corresponds with environment change, both of nature and socioeconomic (Baga, Pratiwi, & Firdaus, 2008).
Recently, production policy is known as Program Peningkatan Beras Nasional/P2BN (National Rice Improvement Program). This program started in 2007 with target to increase the production per year either of rice by 2 million tons or of grain by 5 percent for domestic stock. This is also to reduce import in order to achieve self-sufficiency in 2015.
Some provinces in Indonesia plays role as rice producers. Based on data of Statistics Indonesia, paddy is widely produced in the island of Java. It shows on Table 1, where the three provinces on Java Island are the big paddy producers in Indonesia.
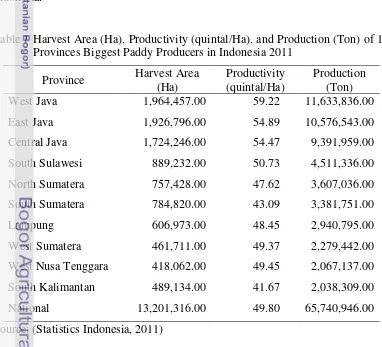
Table 1 Harvest Area (Ha), Productivity (quintal/Ha), and Production (Ton) of 10 Provinces Biggest Paddy Producers in Indonesia 2011
Province Harvest Area
South Sumatera 784,820.00 43.09 3,381,751.00
Lampung 606,973.00 48.45 2,940,795.00
West Sumatera 461,711.00 49.37 2,279,442.00
West Nusa Tenggara 418,062.00 49.45 2,067,137.00 South Kalimantan 489,134.00 41.67 2,038,309.00
National 13,201,316.00 49.80 65,740,946.00
3
In the 2011, West Java is the biggest paddy-producing province and it produced paddy was 11,633,836.00 tons. While Indonesian national production of paddy is equal to 65,740,946.00 tons. It means that West Java accounts for 17.70 percent of national paddy production. In addition, West Java also has the largest harvest area and the highest productivity. East Java and Central Java placed second and third as a province of paddy producers. Each province produced paddy was 10,576,543.00 tons and 9,391,959.00 tons.
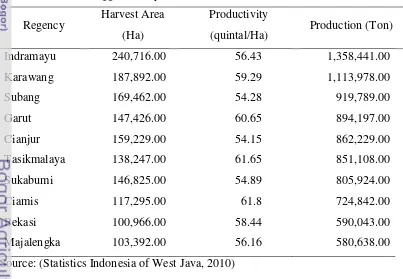
Cianjur is one of regencies that are produce paddy in West Java province. In 2010, Cianjur produced paddy about 862,229.00 tons. It has harvest area about 159,229.00 hectares with the productivity of 54.15 quintal per hectare. The biggest province in West Java that produced paddy was Indramayu with total production by 1,358,441.00 tons. It shows on Table 2. Harvest Area (Ha), Productivity (quintal/Ha), and Production (Ton) of 10 Provinces Biggest Paddy Producers in West Java Province year of 2010.
Table 2 Harvest Area (Ha), Productivity (quintal/Ha), and Production (Ton) of 10 Provinces Biggest Paddy Producers in West Java Province 2010
Regency Harvest Area Source: (Statistics Indonesia of West Java, 2010)
This is important because Indonesia has large population and also wide and spread geographical coverage. Hence, since 1967, government provides authority to BULOG to regulating domestic rice stock and stabilizing rice price. In Indonesia, rice distribution process is implemented by BULOG and market mechanism. BULOG has only market share by 10 percent of total national market and the rest is controlled by market mechanism (Baga, Pratiwi, & Firdaus, 2008).
In price side, policy is made with respect to protect farmers as producer and consumer through price stabilization mechanism. Since 1970, government issued a floor price policy for grain and rice. The objective of this policy is to provide price guarantee for farmers that the production will be purchased in accordance with the price set by the government. So it becomes an incentive for farmers to increase the production. The policy will further help for farmers in the harvest. Farmers will not get a lowest price because of excess supply occur in the market. On the other hand, government sets a ceiling price to protect consumers. A ceiling price is the maximum price that might be applied by producers to the consumers. This policy will further help for consumers in the bad season. The consumers will not get a highest price because of excess demand occur in the market.
Referring to Inpres No.9 Tahun 2002 (President Instruction) concerning of determination of rice policy, government change Harga Dasar Gabah/HDG (Floor Price of Grain) into Harga Dasar Pembelian Pemerintah/HDPP (Floor Price of Government Purchasing)) is also known as Harga Pembelian Pemerintah/HPP (Government Purchasing Price). Fundamental difference of both policies is on government guaranteed price level. In HDPP (HPP) policy, government only guarantee price of grain on the certain level at the site which has been set.
5
The other form of price policy is market operation both of Operasi Pasar Murni/OPM (Pure Market Operation) and Operasi Pasar Khusus/OPK (Special Market Operation). OPM is part of general price subsidy which is used at the highest price occur because of excess demand in the market. It is done by cutting of price by 10-15 percent below market price. Otherwise, OPK is implementation of targeted price subsidy to distribute food aid to poor people. Since 2002, this operation changes to Beras untuk Keluarga Miskin/Raskin (Rice for Poor Families) (Baga, Pratiwi, & Firdaus, 2008).
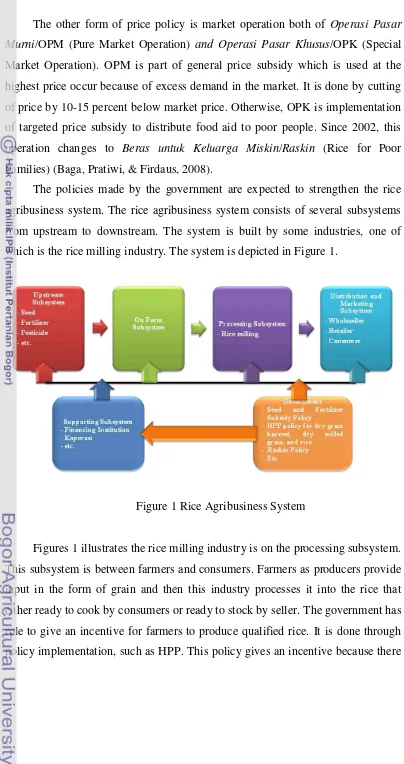
The policies made by the government are expected to strengthen the rice agribusiness system. The rice agribusiness system consists of several subsystems from upstream to downstream. The system is built by some industries, one of which is the rice milling industry. The system is depicted in Figure 1.
Figures 1 illustrates the rice milling industry is on the processing subsystem. This subsystem is between farmers and consumers. Farmers as producers provide input in the form of grain and then this industry processes it into the rice that either ready to cook by consumers or ready to stock by seller. The government has role to give an incentive for farmers to produce qualified rice. It is done through policy implementation, such as HPP. This policy gives an incentive because there
is guarantee of price for farmers. This policy makes more influence in the harvest season while production of paddy/rice is higher.
The guarantee of price increases the incentive for all parts in the rice agribusiness system to produce better quality rice and reduce the yield loss that occurs at every level. This point is done to strengthen linkages between primary industries (on farm) and a processing industry (milling), to be equally strong. So, farmers can increase income in a sustainable manner as well as the milling business. Then, it can create a good and solid rice agribusiness system (Sawit, 2011).
Rice milling industry as an important link in converting paddy into rice is required to contribute provision of national rice in terms of quantity and quality. This industry increase value added of paddy/grain. Rice has a higher economic value when sold than sold in the grain form. This industry converts paddy/grain which is produced by farmers into rice that is ready to be cooked or stored. The role of government is needed to improve performance and develop this industry in order to create an integrated rice agribusiness.
Rice production both quality and quantity will give a large effect on national rice trade. The quality of rice produced would affect the competitiveness of the national rice products. Good quality rice will become a force for Indonesia in competing with the other countries in both domestic and foreign markets. In addition, the quantity of rice produced would affect the amount of rice supply in the market. If the number of nationally produced rice cannot cover the needs of the community, then this will affect the rice import policy.
7
Rice millers can be divided into several categories based on a few distinguishing features, including production capacity, level of technology, business management and so forth. Based on production capacity, rice millers are grouped into three categories (J., 2010). First is small rice miller consisting of two units of machines in separated pairs, namely husker and polisher. In general, transfer of material from husker to polisher is done by human (manually). Real production capacity is about 0.3-0.7 ton of rice per hour.
Second is large rice miller comprising of a complete set of cleaner, husker, separator, polisher, shifter, grader, and so on. Material transfer is done by using elevator. Real production capacity is more than 0.7 ton of rice per hour. Third is rice milling unit consisting of husker and polisher inseparable. Real production capacity is 0.3-0.7 ton of rice per hour.
Based on level of technology, rice milling in Indonesia is divided into two types (Winarno, 2004). First is medium-large rice mill (commercial). Second is service (custom) rice miller offering milled service in small quantities.
In 2002, the number of the rice milling in Indonesia is 109,000 units. This is dominated by small-scale by 95 percent and the rest is large-scale. The average yield that is produced by small rice milling is still low at only 60 percent, medium rice milling is 64 percent, and large rice milling is 65 percent of each dry milled grain that milled in each rice milling. Generally, small scale rice millings are an investment in the 1960s until 1980s (Sawit, 2011). While in 2008, the number of rice milling is decrease. It is about 108,512 units (Thahir, 2010).
In 2009, there are 2,028 units of rice miller in Cianjur Regency (Kabupaten Cianjur, 2009). This number is dominated by small rice miller about 90.24 percent. The rest is large rice miller. Gekbrong and Warungkondang are sub-districts in Cianjur being study site. In study site, based on preliminary survey data, there are three types rice miller, namely makloon, non-makloon, and combination of both. This is divided by management business.
According to those research questions, the objectives of this study are: 1. To describe characteristics and types of rice miller.
2. To determine relative efficiency of rice milling industry.
2
LITERATURE REVIEW
Generally, this chapter reviews some previous studies on rice milling and efficiency relative. First, it starts with overview of rice milling industry in Indonesia. Second, it describes a few previous studies about efficiency of production function. Finally, the last section of this chapter gives information about efficiency study in the previous studies.
2.1 Rice Milling Industry Overview
Based on production capacity, rice milling business was divided into three categories. First, Small Scale Rice Mill (SSRM) had a production capacity of 0.5 tons per hour. Most of that consist of Engelberg Rice Mill (ERM). Second, Medium Scale Rice Mill (MSRM) had a production capacity between 0.5-1.0 tons per hour. This category consists of Rice Mill Unit (RMU) and SSRM. Third, larger scale rice mill (LSRM) had a production capacity of more than 10 tons per hour (Winarno, 2004).
In the Karawang regency, production capacity of milling was the main factor that distinguishes between large and small-scale rice milling (Arief, 2008). Other differing factors were owned capital, milling machine capacity, partnerships with BULOG (Mainstay of Food Security), and the owner education level.
In Indonesia, there were a few types of rice milling. It was divided by production capacity, technology, business activity, and so on. In Cikarawang Village, rice millers tend to only offer milling service (Chaerunnisa Sd, 2007). Rice miller cannot take chances in selling rice. It was related to a few reasons, including opportunities, funding, and management.
The production capacity was one characteristic to distinguishing rice miller (Arief, 2008). This referred to the ability of rice miller to produce rice a day. This was closely related to the engine used, capital, amount of grain, and other related factors.
In his research, located in Karawang, the average production capacity of the rice miller was equal to 29.23 tons of rice per day. The largest production capacity was about 60 tons of rice per day and the smallest production capacity was about 20 tons of rice per day. This was related to the ability of large miller to buy grain in large quantities and also supported by the ability of big capital. In addition, small rice miller had an average production capacity about 5.91 tons of rice per day. The largest production capacity was about 15 ton of rice per day and the smallest production capacity was about 2 tons of rice per day.
Most of rice miller in Karawang Regency did drying and processing activities only for 9-10 months a year. The remaining time was used to store and repurchase stock for the next process because at that time farmers had a period of rest or famine.
When viewed from business activities described in this study, rice millers were a private rice miller. Rice miller did activity start from purchase grain, drying, processing, packaging or storing, until sale of rice.
2.2 Efficiency of Variables Used in Study
There were three performance models in the study of technical and scale efficiencies Australian universities (Avkiran, 2001). All model showed slack whether input and output. Input slack means an over-utilized resource. While output slack means less production by uses a set input. Overall, slacks were small. Both slacks represent potential improvements for universities.
11
National Parks in this study still have potential improvements to obtain efficiency. It means whether input used and output produced still inefficient.
The other study was about benchmarking productive efficiency of selected wheat areas. The study used three inputs and single output in her study. There were slacks in two inputs used. It means that areas could reduce both input usage to produce output in the same level. Generally, the wheat areas were inefficient in input used. In addition, it produced output efficiently. It can be seen by zero slack on the output variable.
2.3 Efficiency Relative
The study described the industry in Central Java (Rejekiningsih, 2011). Measurement of efficiency for each sector in the industrial processing was performing using the DEA assuming variable returns on scale (VRS). It will efficient when the industry has a 100 of efficient score.
The study was uses a sample of 21 industries. The data used some of the data output and several inputs used during the period 2000-2005 from each sector in the manufacturing of medium and large. Therefore, the input and output were varies, then the efficiency was calculated by transforming a single input and output through the appropriate weighting.
Based on research results, for the period 2000-2005 concluded that the efficiencies were achieved in a very diverse industry. Average efficiency scores for each industry did not reach 100 which means that each sector has not been working efficiently. This suggests of no proper allocation of resources that lead to the less achievement of industrial output. These results are different when compared with the analysis performed for each year. For each year, there are some efficient industries with 100 efficient values. In 2005, the number of the efficient industries more than inefficient industries.
Model selection based on the degree of consistency and stability in the efficiency measures for all universities as samples. Besides, the model was chosen DEA6 because it has high correlation between input and output variables.
Based on the results of the study, the average efficiency is different every year. The samples is said to be efficient when its position in appropriate efficiency frontier. However, the limitations of the DEA are not able to explain the reason for the difference (efficient and inefficient). The study adds the cost accounting profession's analytical review technique to complement the DEA. The study are attempted to explain differences in the efficiencies between the sample characteristics by connecting the inputs used in terms of both quantity and quality of the efficiencies that may occur (positive or negative). Generally, South African universities were inefficient in every year.
The research is technical and economic efficiency measures under short run profit maximizing behavior (Cherchye, Kuosmanen, & Leleu, 2010). Differ with previous researches; this research has examined the measurement of economic and technical efficiency in the framework of short run profit maximization behavior, drawing special attention on the corresponding duality relationship.
Research is dividing into two steps. First, is by searching alternative profit efficiency (PE) measures through literature review. Then identify Varian’s percentage profit efficiency measure for evaluating short run profit efficiency. Second, is establishing the dual link between the economic efficiency measure and the (quantity based) McFadden gauge function. (1) The technical efficiency (TE) should be interpretable as the PE at the input and output shadow price vectors; (2) The TE should provide an upper bound for the PE at all prices. The McFadden gauge as such a technical efficiency measure. This is capturing the maximal radial expansion of the variable input and output vectors (simultaneously).
13
DEA was used to examine the relative efficiency of Australian universities (Avkiran, 2001). This study used cross section data for 1995 of 36 Australian universities. Three performance models were developed, namely overall performance, performance on delivery of educational services, and performance on fee-paying enrolments. This study is under both of output maximization and Variable Return to Scale (VRS). The results of this study are list of universities which is efficient and inefficient, list of universities which is operate at Increasing Return to Scale (IRS), Most Productive Scale Size (MPSS), and Decreasing Return to Scale (DRS), and slack of each university. Generally, three performance models showed that universities were inefficient.
The other research analyzed the level of bank efficiency on using approach of DEA (Jemric & Vujcic, 2002). This study analyzed the level of bank efficiency in Croatia. Usage of the DEA method is able to classify efficient and inefficient banks based on a certain size that have been previously defined. The research is also able to identify the factors of leading cause of inefficiency in the banking system in Croatia.
This chapter is divided into five parts. First describes about concept of efficiency. Second describes about concept of measurement concept. This part is divided into two sections, namely output and input orientated. Third describes about constant return to scale DEA model. Fourth describes about variable return to scale DEA model. The last part describes about slack.
3.1 Efficiency Concept
Theoretically, efficiency is one of the performance parameters that underlying all of the performance of an organization. Efficiency related to the ability to produce the optimal output to the input that measure the expected performance (Abidin & Endri, 2009).
The efficiency concept was first introduced by Farrell in 1957. The efficiency of a firm usually has definition in two sides. First, when the efficient defines as a successful of a firm in producing many possible outputs from a given set of input (technical efficiency). Second, the efficiency will achieve when a firm success to choose an optimal set of input with the same output (allocative efficiency).
Efficiency is a concept, in which it is related to profit or loss earned by a business. This is concluded from the comparison between the numbers of generated outputs (results) with the usage of inputs from production activities. From the explanation, the concept of efficiency is related to the concept of production function. A method of production is called efficient if the method produces more output for the same sacrifices, (opportunity cost). In other conditions, a method of production is succeeding if the method produces the same output for the smaller sacrifices. Therefore, it is concluded that the concept of efficiency is a relative concept (Harianto, 1989).
15
quantifiable and measureable. Efficient in input used, will produce the high productivity as objective of all organizations in every activity.
Efficiency concept contains three terms, namely technical efficiency (TE), allocative efficiency (AE), and economic efficiency (EE). According to (Farrell, 1957), EE will occur by itself if the TE and AE can be achieved. Technical and Allocative Efficiencies describe in Figure 2.
Source: (Farrell, 1957)
The line AA’ is the line that describes the relative price of the relative cost of input used in a production process. Relative cost of usage of input will be minimum if the line AA' offends isoquant curve (SS΄). The isoquant represents the various combinations of the two factors that a perfectly efficient firm might use to produce output. The point P shows the input of two factors, per unit of output, that the firm is observed to use.
The point Q shows an efficient firm using two factors in the same ratio as point P. It produces the same output as P using only 0Q/0P of each factor. It also describes of as producing 0P/0Q times as much output from the same inputs. It could be defined 0Q/0P as the technical efficiency of the firm P (Farrell, 1957).
Figure 2 Technical and Allocative Efficiencies y
x 0
S΄ Q΄
Q
R
P
A
’
A concept of efficiency is approached from two side approaches, namely the input and output orientations (Farrell, 1957). It needs the availability of input price information and an isoquant curve showing combinations of inputs used to produce output at maximum level raises the approach on the input side. The approach on the output side is the approach used to see the extent of the output amount is proportionally increased without changing the number of inputs used.
3.2 Efficiency Measurement Concepts
Firm is efficient while it successes in producing maximum output(s) using a given input(s) (Farrell, 1957). The efficiency of firm consists of two components, technical efficiency (TE) and allocative (price) efficiency (AE). TE reflects the ability of the firm to achieve maximum output(s) from a given set of input(s). AE reflects ability of firm to use the input(s) in optimal proportions, given price and production technology respectively. The achievement of both efficiencies implies economic efficiency (EE).
3.2.1 Input Orientated
The input orientated TE is measure to answer the question “How much quantity of input(s) can be proportionally reduced without changing the output
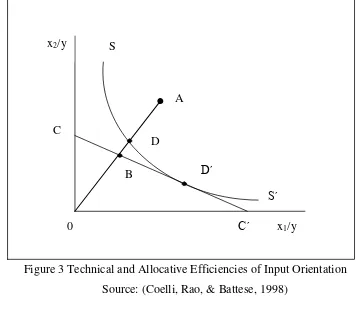
quantity produced?” TE and AE of the case represented in Figure 3.
Figure 3 illustrates the unit of isoquant of fully efficient firms, represented
by SS΄. If the firm uses a given set of input, defined by the point A, to produce a unit of output, the technical inefficiency of that firm could represent by the distance DA. This is the amount by which all inputs are proportionally reduced without a reduction in output.
It also expressed in percentage terms by the ratio DA/0A. This is represents the percentage by which all inputs need to be reduced to achieve technically efficient production. The TE of a firm is commonly measured by the ratio as on Equation 3.1.
TEi = 0D/0A
Where: TEi is the input orientated technical efficiency
17
Source: (Coelli, Rao, & Battese, 1998)
Equation 3.1 is equal to 1 – DA/0A. It will take value between zero and one, and therefore provides an indicator of the degree of technical inefficiency of the firm. A value of one indicates the firm is fully technically efficient. The point D is technically efficient because it lies on the efficient isoquant.
If the input price is also known, represented by CC΄ (the slope of isocost) in Equation 3.1, permits the measurement of AE. The AE of the firm operating at A is defined to be ratio as on Equation 3.2.
AEi = 0B/0D
Where: AEi is the input orientated allocative efficiency
(3.2) The distance BD represents the reduction in production costs. If the production were to occur at point D, the allocatively and technically efficient
would occur. While the point D΄ shown the technically efficient but allocatively
inefficient.
The achievement of the TE and AE implies EE. The EE is defined to be ratio as Equation 3.3.
x2/y S
A
D
B D΄
S΄
x1/y
0 C΄
C
EEi = 0B/0A
Where: EEi is the input orientated economic efficiency
(3.3) The distance BA could also be interpreted in terms of cost reduction. The EE is also could be calculated by Equation 3.4.
TEi x AEi = (0D/0A) x (0B/0D)
(3.4) It could be done because the product of the TE and AE measures provides the measures of overall economic efficiency. All of three measures bounded by zero and one.
3.2.2 Output Orientated
The alternative question about efficiency is “How much quantity of output(s) can be proportionally increased without changing the input quantity
used?” The output oriented measures is opposed to the input oriented measures. The difference between the input and output oriented measures can be seen in Figure 4, which is using a simple example involving one input (x) and one output (y).
Source: (Coelli, Rao, & Battese, 1998)
Figure 4 Input and Output Orientated TE Measures and Return to Scale
19
Figure 4(a) illustrated a decreasing return to scale in technology, represented by f(x), and an inefficient firm operating at the point A. The input orientated measure of TE would be equal to the ratio PQ/PA, while the output-orientated measure of TE would be RA/RS. Whereas only when constant return to scale exist, the input orientated measures would equal to the output orientated measures (Fare & Lovell, 1978). This case is illustrated in Figure 4(b), where PQ/PA = RA/RS, for the inefficient firm operating at point A.
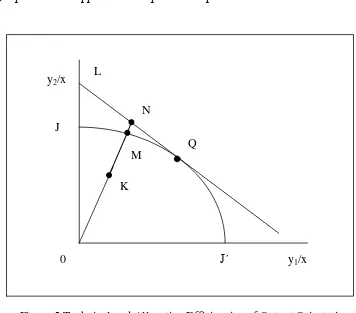
The TE and AE of an output orientation are illustrated in Figure 5. This illustrates the output-orientated measures by considering the where production involves two outputs (y1 and y2) and a single input (x). The input quantity is set as fixed at particular level, and then the technology represented by a production possibility curve in two dimensions. The production possibility curve is illustrated in Figure 5 as line JJ΄, and the point K shown inefficient firm. The firm, which is operating at point K, is an inefficient because it lies below the curve. The curve
(JJ΄) represents the upper bound of production possibilities.
Source: (Coelli, Rao, & Battese, 1998)
Figure 5 Technical and Allocative Efficiencies of Output Orientation y2/x
y1/x
J΄
J
L
΄
K M
N
Q
Referring to Figure 5, the distance KM represents technical inefficiency. It means the number of output(s) could be increased without requiring extra input. Therefore a measure of output orientated TE is ratio as on Equation 3.5.
TEo = 0K/0M
Where: TEo is the output orientated technical efficiency
(3.5) If there is input information then we can draw the isorevenue line, LL΄, and can be calculated the AE as on Equation 3.6.
AEo = 0M/0N
Where: AEo is the output orientated allocative efficiency
(3.6) Like input orientation, which the cost is reducing interpretation of allocative efficiency, the output orientation has a revenue increasing interpretation. The EE define as Equation 3.7.
EEo = (0K/0N) = (0K/0M) x (0M/0N) = TEo x AEo Where: EEo is the output orientated economic efficiency
(3.7) Similar as in input orientated, all of these three measures are bounded by zero and one. The three important points about the efficiency measures (Coelli, Rao, & Battese, 1998), namely:
1. TE has been measured along a ray from the origin to the observed production point. Therefore, these measures hold a relative set of inputs (outputs) constant. The advantage of the radial efficiency measure is changing the units of measurement does not change the value of the efficiency measures.
2. AE could be calculated from a cost minimizing and from the revenue maximizing, but not from a profit maximizing perspective. It is able to accommodate in a number of ways. The principal difficulty is related to the selection of the orientation in which to measure TE (input, output, or both). 3. The Farrell input and output orientated TE measures are equivalent to the
21
3.3 Constant Returns to Scale (CRS) DEA Model
In 1978, the traditional DEA model was introduced by Charnes, Cooper, Rhodes, known as CCR model, had an input orientation and assumed CRS. This model was the first to be widely applied. The optimal weights are acquired by solving the mathematical problem (Equation 3.8):
max u.y (u΄yi/v΄xi)
st u΄yj/v΄xj ≤ 1, j=1, 2, ..., N, u, v ≥ 0
(3.8) An intuitive of DEA is via ratio form. The aims are to obtain a measure of the ratio of all outputs overall all inputs for each firm. For example, as in Equation
3.8 u΄yi/v΄xi where u is an Mx1 vector of output weights and v is a Kx1 vector of input weights.
Values for u and v will also find, so that the efficiency measures for i-th firm is maximized. Subject to (st) the constraints that all of measures must be less than or equal to one. There is one problem for this particular ratio formulations, it has an infinite number of solutions. To avoid this problem, st the constraint that
all efficiency must be equal to one (v΄xi = 1), define as Equation 3.9. maxµ,v (µ΄yi), form of the DEA linear programming problem.
The above formulation is the primal formulation, while the alternative is called the dual formulation. It can be derived an equivalent envelopment form of this problem as Equation 3.10.
minθ,λ θ, st -yi + Yλ ≥ 0,
λ ≥ 0, Where:
θ is a scalar
λ is a Nx1 vector of constants.
(3.10) This envelopment form covers fewer constraints than the multiplier form
(K+M < N+1), and therefore generally the preferred form to solve. The value of θ
will become the efficiency score for each firm. It must be less than or equal to 1 (θ
≤ 1), with a value of one indicating a point on the frontier. According to the
(Farrell, 1957) definition, this condition is known as technically efficient firm.
3.4 Variable Return to Scale (VRS) DEA Model
CRS DEA model only appropriate used when a firm is in an optimal scale condition. There are a few reason could make a firm to be not operating at an optimal scale, such as imperfect competition, finance constraint, etc. The alternative model to solving this problem is the return to scale (RTS) DEA model (Banker, Charnes, & Cooper, 1984). The model is also known as a BCC DEA model.
This model permits the calculation of TE without the scale efficiency (SE) effect. This effect may occur if the CRS model is used when not all firms are at optimal scale, and leading to the calculation of TE influenced by this effect. The formulation for this model defined on Equation 3.11.
maxθ,λ θ, st -yi + Yλ ≥ 0,
θxi –Xλ ≥ 0, N1΄λ = 1 λ ≥ 0 where:
N1 is an Nx1 vector of ones
N1΄λ is the convexity constraint
23
The convexity constraint ensures that the VRS model take into accounts the variation of the efficiency with respect to the scale size of firm. The measurement of the efficiency of each firm only benchmarked against firms that have similar size. Hence, the inefficient firm is a result of measurement with firm that has a similar size. The convexity constraint is not applied in the CRS model. Therefore, a firm might be compared to the firms, which are larger or smaller size than it.
In TE calculation using the VRS model, the value of scale efficiencies for each firm will be obtained. It is derived from the ratio of the TE value both the CRS DEA and VRS DEA. Based on this calculation, it is known that the TE value in the CRS includes two components, one due to scale inefficiency and one due to pure technical inefficiency.
The firm is indicated that scale is inefficiencies if there is a difference in the CRS and VRS TE value. Otherwise, the firm only has pure technical inefficiency if there is the same in the CRS and VRS value, and surely has the TE value smaller than one. This concept is illustrated on the Figure 8.
Source: (Coelli, Rao, & Battese, 1998) Figure 6 Calculation of Scale Efficiency in DEA
CRS Frontier
VRS Frontier J
Jc
M
Jv
K L
y
x 0
In Figure 8 illustrated scale inefficiency using one input and producing one output, under input orientated assumption. There are CRS and VRS frontier, and non-increasing return to scale (NIRS). Under CRS condition, the technical inefficiency of the point J is the distance between J and Jc (JJc). While, the technical inefficiency of VRS condition would only be the distance between J and Jv (JJv). This difference is due to scale inefficiency. This is defined on Equation 3.12.
TECRS = MJc/MJ TEVRS = MJv/MJ SE = MJc/MJv
(3.12) Shortcoming arising from scale efficiency is the value does not indicate whether the firm is in a condition increasing return to scale (IRS) or decreasing return to scale (DRS). An additional DEA problem with non-increasing return to scale (NIRS) can be determines this condition by changing the N1΄λ = 1 into N1΄λ
≤ 1 as on Equation 3.13.
minθ,λ θ, st -yi+ Yλ ≥ 0,
θxi–Xλ ≥ 0, N1΄λ ≤ 1 λ ≥ 0
(3.13) Based on Figure 3.7, the firm is under IRS condition when the NIRS value is not equal to VRS value. This condition is illustrated by point J. While, if both of values are equal then the DRS exist for that firm. This condition is shown by point K.
3.5 Slack
piece-25
wise-linear convex isoquant, constructed such that no observed point lies to the left or below it (see Figure 6). Second, a parametric function, such as Cobb-Douglas form, fitted to the data, also such that no observed point lies to the left or below it. The below efficiency measures are defined in the context of CRTS technology.
Source: (Coelli, Rao, & Battese, 1998)
The piece-wise linear form of the non-parametric in DEA model cause a few difficulties in efficiency measurement. This appears because of the section of the piece-wise linear frontiers which run parallel to axis (see Figure 7) which do not occur in most parametric functions. Figure 7 illustrates the problem, where the firm using combinations of inputs, point C and D are the two efficient firms, which define the frontier. Point A and B are inefficient firms.
The technical efficiency of firm A and B are 0A΄/0A and 0B΄/0B, respectively (Farrell, 1957). However, the question whether the point A΄ is efficient because at that point the input x2 used can be reduced by the amount CA΄ and still produce output in the same amount. Excess in the use of inputs is known as input slack (input excess). To provide an accurate indication of technical
Figure 7 Piece-wise Linear Convex Unit Isoquant S
S΄
efficiency of a firm in DEA analysis is required reports of both the Farrell measure of technical efficiency (θ) and any non-zero input or output slacks. While, Koopmans (1951) in (Coelli, Rao, & Battese, 1998) defined that the firm is only technically efficient if it operates on the frontier and furthermore that all associated slacks are zero.
Source: (Coelli, Rao, & Battese, 1998) 0
S
S΄
x1/y x2/y
A
A΄
B΄ B
D C
4
METHOD
This chapter is divided into three sections. First describes about information of data description. This includes type of data, data sources, data collection method, and etc. Second describes about data processing and analyzing. It consists of description of processing data, analyzing data, model used, and variable used. The last section describes about comparative test that used to compare efficiency score of two sub-districts.
4.1
Data DescriptionThis study was conducted in Gekbrong and Warungkondang Cianjur Regency, West Java Province. Determination of location research was purposively done because West Java Province is the biggest rice producer than the others and Cianjur Regency is one of the regencies in West Java, which is produce rice.
Data collection was conducted in May 2012. Data used in this study were primary data in the form of cross section data and also secondary data. Primary data were obtained from direct observation in the field, direct interview, and filling of the questionnaire. Secondary data were obtained from books, journals, reports, and literatures relevant to this research such as data from the Statistics Indonesia, Statistics Indonesia of West Java, Ministry of Agriculture, Directorate General of Marketing and Processing of Agriculture, and the other related institution.
Sample was determined purposively. This study used 94 rice millers, which was 44 rice millers in Gekbrong and 50 rice millers in Warungkondang. Technology used of all rice millers was similar. Thus, the occurrence of errors in the calculation and bias assumption can be minimized.
memory of extension officer which is native who understand conditions in the site. This study also got information about existence of the rice miller from society, owner of the rice miller visited, and so on.
Then, this list was used as a guide to found rice miller in the field. Based on field survey, there were 44 rice millers in Gekbrong. This number was insufficient to determine the efficiency of rice milling industry. In order to get more accurate results, this study was expanded to neighboring sub-district. Purposively, Warungkondang selected as the study site by the main reason that Gekbrong was part of this sub-district before regional expansion occurred. Thus, it was suspected that both sub-districts have similar characteristics of rice miller.
Similar to Gekbrong, this study also did not have a clear sample framework. So, sampling was done same way as in Gekbrong. Due to some limitations such as materials, time, and field conditions, this study only used 50 rice millers in Warungkondang.
4.2 Data Processing and Analyzing
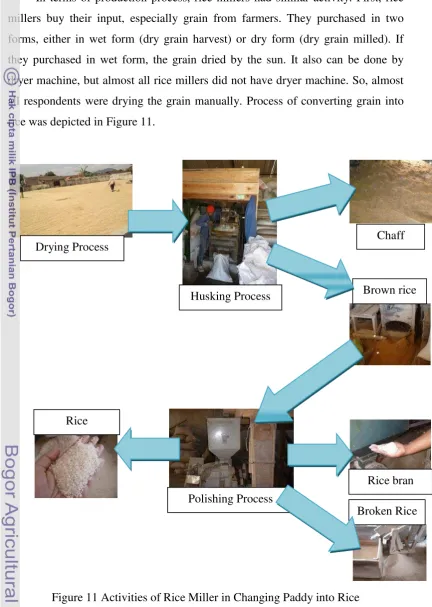
For this study, primary unit of observation is the rice milling business. Expected outputs of each business are rice, broken rice, rice bran, and chaff. All outputs used in form of weight by kilogram. While input variables are used in this study include grain, working hour, and fuel.
Primary and secondary data are processed and analyzed by using quantitative and qualitative methods. Qualitative analysis is used to describe characteristic of rice milling industry in study site. Meanwhile quantitative analysis is used to determine relative efficiency of rice milling industry in this site.
29
Referring to Koopmans definition about technical efficiency, the study used two requirements that both requirements must achieved by rice milling industry to determine efficiency of rice milling, namely:
1. Rice milling industry must have efficiency score equal to one.
2. Rice milling industry must achieve zero slack condition for all variables used.
DEA was created as a tool to evaluate the performance of an activity in a unit entity (organization) (Charnes, Cooper, & Rhodes, 1978). DEA calculates the efficiency of a DMU in one group of observation. The working principle of the DEA model is to compare the data input and output of an organization's data (decision-making unit /DMU) with other input and output data on the same DMU. This comparison is performed to obtain an efficiency score.
Assumptions of DEA:
1. Entities evaluated by using a set of the same input to produce likewise set of the same output.
2. The data is positive and the weight is limited on positive values. 3. Input and output are variable.
4. In the presentation of (Hayes, 2005), there are strengths and weaknesses of DEA. DEA model used as a device to measure the performance has several advantages over other models, including:
5. DEA model can measure many input and output variables.
6. It does not require an assumption of a functional relationship between the variables measured (input and output).
7. DMU is directly compared with one another.
8. Input and output variable can have different measurement units. Meanwhile, limitation of DEA model, including:
1. It has sample specific.
2. It is an extreme point technique so that measurement error can be fatal. 3. It just measures the relative efficiency of DMU, not absolute efficiency. 4. Hypothesis testing is statistically difficult to be done. Using linear
Research working steps on DEA method, including:
1. Identify the DMU or unit that will be observed with inputs and outputs constituent.
2. Form the efficiency frontier from the available data.
3. Calculate the efficiency of each DMU to obtain input and output targets needed to achieve optimal performance.
Model used was output orientation. There were two reasons of this. First, rice miller was a business, which was produces multi output. Second, the owner (manager) has control over the output produced compared to the input used. This was used to cover makloon type that did not provide grain in production.
This study also assumed VRS DEA model. This study has no a priori reason to believe that the rice milling industry in study site achieves optimal scale. Thus, using of VRS DEA model is more appropriate than using of CRS DEA model for this study.
Model used in this study were consists of input and output variables. Input variables used were amount of harvest dry grain, fuel, and working hour of machine. Meanwhile, output variable were amount of rice, broken rice, rice bran, and chaff. Variables used in this study were:
1. Grain, amount of grain is generated from the harvest and then dried through a process of drying (kg).
2. Fuel, amount of solar is used to operate the machine in rice milling (litter). 3. Working hour of machine (hour). Working hours approach was done because
it was difficult to exactly determine the number of labor used by rice miller. Most of rice miller used labor in term of group (borongan). Thus, rice miller was not knows exactly the number of labor used. They only paid a specified amount to person who responsible in the group. Then, this person was responsible for group.
4. Rice, amount of rice is main result of rice milling machine (kg).
5. Broken rice is amount of broken rice, which is a byproduct of the milling fractions of rice grain (kg).
31
7. Chaff, amount of chaff is a byproduct of rice milling process in the form of grain leather (kg).
Based on explanation above, variables both of output and of input described below:
1. The output 1 is amount of rice (kg). 2. The output 2 is amount of broken rice (kg) 3. The output 3 is amount of rice bran (kg) 4. The output 4 is amount of chaff (kg) 5. The input 1 is amount of grain (kg).
6. The input 2 is number of working hour (hour). 7. The input 3 is amount of fuel (liter).
The amount of output and input variable used depicted in Appendix 2. In order to calculate efficiency scores of rice millers, this study used computer program, namely DEAP 2.1 version. This program calculated efficiency score both each rice miller and a set of rice millers as an industry.
4.3 Comparative Test
As explanations previously, the study consists of two sub-districts. This required a test to compare whether efficiency score between two sub-districts same or different. Due to both samples were two independent groups, the test was conducted comparative test for two independent samples. The test compared the efficiency scores in both sub-districts. It used the following equation:
Where:
t = t statistics
= mean of sample 1 = mean of sample 2
= an estimator of the common standard deviation of two samples
= unbiased estimator of the variance n = number of participants
d.f. = degrees of freedom
(4.1)
A t-test is a statistical test that is used to determine if there is significant difference between means or average score of two groups. There were two hypotheses that used in the test. Hypotheses are statements about population parameters such as expected value, variance, means, and so forth. First, null hypothesis (H0) represents a theory that has been put forward, due to it is believed to be true or it is to be used as a basis for argument, but has not been proved. The null hypothesis in this test was there was no significant difference on efficiency score between Gekbrong and Warungkondang, on average.
Second, alternative hypothesis (H1) is a hypothesis to be accepted if the null hypothesis is rejected. The alternative hypothesis in this test stated that there was significant different on efficiency score between Gekbrong and Warungkondang, on average. The hypotheses were written as follows:
H0: there is no significant difference efficiency score between Gekbrong and Warungkondang, on average
H1: there is significant difference
33
Critical region (rejection region) is a set of values of the test statistic that the null hypothesis is rejected in hypothesis test. It means the sample space for the test statistic was partitioned into two regions, one region leads to reject the null hypothesis (H0), the other not. Thus, the conclusion is rejection of H0 if the test statistic value is on the critical region, vice versa.
The other way to determine conclusion of the test is by comparing α and p-value (p). P-p-value is probability of getting a p-value of the test statistic as extreme as or more extreme than observed, if the null hypothesis is true. The null hypothesis do not rejected if p-value is greater than α (p> α). In the implementation, this test used statistical software, namely Minitab Release 13.20.
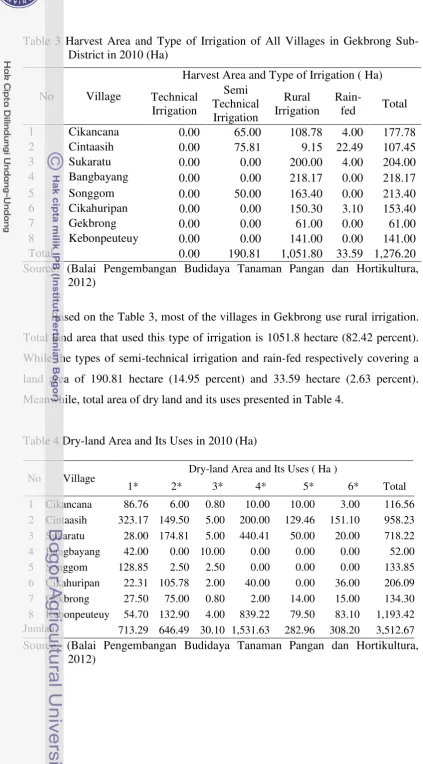
This chapter is divided into two sections. First describes briefly about Cianjur Regency. It consists of geophysical and climatic conditions, demography, and agricultural condition. Second describes about characteristics of research location. It briefly describe about Gekbrong district and Warungkondang sub-district.
5.1 An Overview of Cianjur Regency
5.1.1 Geophysical and Climatic Conditions
Cianjur Region is located in the south of Java Island. It covers an area of 3,501.48 square kilometerswith the capital city is Cianjur. Geographically, it is in the center of West Java province with a distance of about 65 km from the provincial capital of West Java (Bandung) and 120 km from state capital (Jakarta). It is located between 6o 21’ South Latitude – 7o 25’ South Latitude and 106o 42’ East Longitude – 107o 25’ East Longitude. The map of Cianjur Regency is shown in Figure 9.