Permutation Test in Evaluating the Significance of Plants in PLS-DA Model
of Jamu Ingredients
Farit Mochamad Afendi
a, b*, Md. Altaf-Ul-Amin
a, and Shigehiko Kanaya
aa
Graduate School of Information Science, Nara Institute of Science and Technology, Nara, Japan b
Department of Statistics, Bogor Agricultural University, Bogor, Indonesia
* Corresponding author: Graduate School of Information Science, Nara Institute of Science and Technology, Ikoma, Nara 630-0101, Japan.
Tel.: +81-743-72-5952; fax: +81-743-72-5953. [email protected]
Abstract
PLS-DA (Partial Least Square Discriminant Analysis) model is used to establish relationship between Jamu ingredients, i.e. plants composition in Jamu, and Jamu efficacy to investigate which plants act as main ingredients and which are supporting by checking the plants significance. Permutation testing is used in the investigation by generating the coefficients distribution under null hypothesis, i.e. the plants are not affecting Jamu efficacy. The generation process is performed by permuting the order of the response while maintaining the order of the predictors. The PLS-DA model then is applied to the new dataset after permutation. After repeating this process many times, then the accumulation of the PLS-DA coefficients provides the distribution under the null hypothesis. The proportion of the coefficients larger than or equal to the PLS-DA coefficient using original data then serves as the p-value, which then can be compared to the significance level . By performing this permutation process 1000 times and = 5%, we found, over all efficacies, 231 out of 465 plants are significant. Moreover, from literature review, among these 231 plants, the usages of 226 plants on the assigned efficacy are supported by scientific paper.
Keywords: jamu, PLS-DA, permutation test
Introduction
Jamu is an Indonesian herbal medicine made from a mixture of several plants. So, the ingredients, i.e. plants composition used, in Jamu determine the Jamu efficacy. Among the ingredients of Jamu are plants used as main ingredients, which contribute primarily to its efficacy, as well as plants used as supporting ingredients (Pramono, 2007; Redaksi Trubus, 2009). Investigating which plants are main ingredients and which are supporting is important to comprehensively understand the mechanism of plants used in Jamu to achieve specific efficacies. A statistical model can be helpful in this attempt by relating plants usage in Jamu as predictors and Jamu efficacy as response. Plants perform as main ingredients will have significant effect on the model developed.
Materials and Methods
Dataset
The data used in the present study are the commercial Jamu registered at The National Agency for Drug and Food Control (NA-DFC) of Indonesia. The data contain 3138 Jamu and in total they use 465 plants. Each Jamu is classified into one of nine efficacy categories, namely: (1) urinary related problems (URI), (2) disorders of appetite (DOA), (3) disorders of mood and behavior (DMB), (4) gastrointestinal disorders (GST), (4) female reproductive organ problems (FML), (6) musculoskeletal and connective tissue disorders (MSC), (7) pain/inflammation (PIN), (8) respiratory disease (RSP), and (9) wounds and skin infections (WND).
In the present study, the plants usage in each Jamu provides the predictors in PLS-DA
The details of the PLS-DA modeling are as follows (Barker and Rayens, 2003; Wold et al, 2001). Let T (n x c) is a matrix of the underlying factors of X and is obtained by maximizing its covariance with the corresponding matrix of the underlying factors of Y, that is
T = XW (1)
Substituting Eq. (1) into Eq. (3) we obtain multiple regression model of PLSDA
Y = XWQt + F = XB + F (4)
where the PLS-DA coefficient matrix B (m x 9) is calculated as
B = WQt (5)
Note that each plant has a set of coefficient containing 9 values, one for each efficacy.
Permutation Test in PLS-DA Model
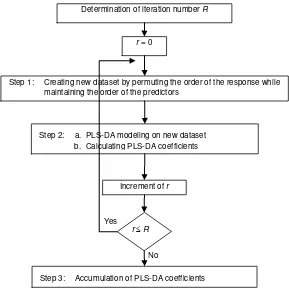
Permutation testing is a resampling method intended to provide underlying distribution of test statistic under null hypothesis, which then can be used to calculate p value. Unlike the conventional statistical testing, which assuming the null distribution follows some theoretical distribution, the permutation testing provides the null distribution by an empirical distribution which generated through resampling of the data sample at hand. The idea of permutation testing in PLS-DA is illustrated in Figure 3. The details of the steps are as follows.
Step 1. Resampling of Jamu data.
In this step, new Jamu data set under null hypothesis, i.e. plants are not affecting the Jamu efficacy, is generated by resampling the existing Jamu data set. The resampling process is performed by permuting the order of the response randomly while maintaining the order of the predictors. This process ensures the relationship between the predictors and the response, if any, in the original Jamu data set is destroyed. Thus, the result from this resampling is the new Jamu data set under null hypothesis. Let denotes the new response obtained from the permutation process.
PLS-DA model is performed on the new Jamu data set obtained from Step 1. The matrix X
and provide the predictors and responses, respectively. The coefficient matrix obtained
is denoted by .
Step 3. Accumulation of PLS-DA coefficients
After all permutation rounds R (in the present study we performed R = 1000 times), the PLS-DA coefficient in each round r is accumulated into coefficient distribution C, which is the distribution of PLS-DA coefficient under null hypothesis. Let Cjk,r denotes the coefficient
of plant j on efficacy k at permutation round r.
After the distribution of PLS-DA coefficient under null hypothesis is obtained, the p value in testing the effect of plant j on efficacy k is calculated as the following. Note that the hypothesis to be tested is.
H0: bjk 0 vs H1: bjk > 0.
Thus, the p value is calculated as
(6)
where is an identity function that equal to 1 if the argument is fulfilled and equal to 0 otherwise. Basically, the p value is the proportion of the coefficients larger than or equal to the PLS-DA coefficient using original data. The null hypothesis is rejected if the p value is smaller than the significance level .
Figure 3. The schematic diagram of the permutation steps used in the present study. Yes
Determination of iteration number R
r = 0
Step 1: Creating new dataset by permuting the order of the response while maintaining the order of the predictors
Step 2: a. PLS-DA modeling on new dataset b. Calculating PLS-DA coefficients
Increment of r
Step 3: Accumulation of PLS-DA coefficients rR
Results and Discussion
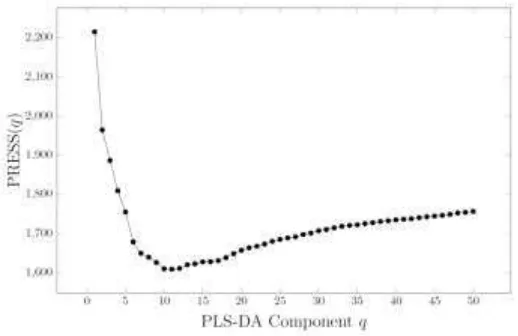
In the present study, in selecting the number of components used in PLS-DA, we performed 5-folds cross validation as follows. The Jamu data set are splitted randomly into five sets. In each round, we combined four sets as training set and the other one as testing set. We apply PLS-DA with number of components q on training set and use the model to predict the responses of the testing set. The PLS-DA is applied once more by selecting another four sets as training set and the other one as testing set. After each set is once selected as testing set, the whole process is repeated using number of components q + 1.
Prediction Error Sum of Square (PRESS) using number of components q for efficacy group
k is calculated as:
where denotes the prediction of the efficacy k for Jamu i using the PLS-DA model
obtained without Jamu i, i.e. i is within the testing data, and using number of components q. The plot of this statistic against number of component q is shown in Figure 4. The plots are almost constant starting from q = 10 onward for all nine efficacy groups. Thus, the number of components of PLS-DA model for the original Jamu data set (and also for all 1000 permutation rounds) is set to 10. Analyzing PLSDA using 10 components on the original Jamu data set, we obtain the percent variation accounted for predictors and responses are equal to 5.5% and 40.5%, respectively.
Figure 4. PRESS plot of 5–fold cross–validation.
Figure 5 gives illustration of the coefficient distribution under null hypothesis obtained from the permutation process. In this illustration, both plants are evaluated due to their usage for Jamu that useful for efficacy URI. The mean of the two distributions (and also for all other distributions) are very close to 0, as expected, indicating that the distributions are generated under null hypothesis. The normal curves were sketched on both distributions to show that not all permutation distributions can be approached with normal distribution. This result supports the p value calculation using empirical distribution as formulated in Eq (6). Using significance level = 5%, we can conclude that Phellodendron chinense is significantly affecting the Jamu efficacy URI, whereas
The results of the significancy testing of all plants used in each efficacy are shown in Table 1. Note that one plant may be used for more than one efficacy. From the testing, we observed 234 plants (50.3% among all 465 plants) showing no significant status for all 9 efficacies; whereas the other 231 plants have significant status which comprise of 189 plants (40.6%) are significant only for 1 efficacy, 38 plants (8.2%) are significant for 2 efficacies, and the other 4 plants (0.9%) are significant for 3 efficacies.
Besides testing the plants usage statistically, furthermore, we also check from scientific paper the usage of significant plants on their corresponding efficacy. The results are shown in Table 1. We obtained that most of the testing results are supported by scientific paper.
Figure 5. Illustration of the coefficient distribution under null hypothesis obtained using permutation process.
Table 1. The number of significant plants resulting from permutation testing and their support status from scientific papers
Efficacy Number of plants used in the corresponding efficacy
Significant plants
Total Support from scientific paper
URI 80 20 19 (95.0%)
DOA 148 21 21 (100.0%)
DMB 47 12 11 (91.7%)
GST 290 26 26 (100.0%)
FML 182 40 39 (97.5%)
MSC 270 40 39 (97.5%)
PIN 183 39 38 (97.4%)
RSP 105 36 35 (97.2%)
WND 120 43 43 (100.0%)
Conclusion
over all efficacies, 231 out of 465 plants are significant. Moreover, from literature review, among these 231 plants, the usages of 226 plants on the assigned efficacy are supported by scientific paper.
References
Barker M, and W Rayens. 2003 Partial least squares for discrimination. J. Chemometrics. 17: 166-173 Good PI. 2005. Permutation, Parametric and Bootstrap Tests of Hypotheses, 3rd ed. Springer, New York Pramono S. 2007. Jamu in Indonesian Daily Life and Industry. Institute of Natural Medicine, University of
Toyama, Toyama
Redaksi Trubus. 2009. Herbal Indonesia Berkhasiat: Bukti Ilmiah dan Cara Racik. PT Trubus Swadaya, Depok Wold S, M Sjöström, and L Eriksson. 2001. PLS-regression: a basic tool of chemometrics. Chemometrics and
Intelligent Laboratory Systems, 58: 109-130