INTEGRATING REMOTE SENSING DATA AND ENERGY BALANCE MODELING FOR DETECTION OF DROUGHT AND
ITS PUBLICATION IN THE INTERNET (Case Study of Karawang District, West Java)
ADI WITONO
GRADUATE SCHOOL
STATEMENT
Hereby I, Adi Witono, do declare that this thesis entitled “Integrating Remote Sensing Data and Energy Balance Modeling for Detection of Drought and Its Publication in the Internet (Case Study of Karawang District, West Java)” is my own work and has not been submitted in any form for another degree or diploma programs (course) to any University or other institution. The content of the thesis has been examined by the advising committee and the external examiner.
Bogor, June 2008
ABSTRACT
ADI WITONO (2008). Integrating Remote Sensing Data and Energy Balance Modeling for Detection of Drought and Its Publication in the Internet (Case Study of Karawang District, West Java). Under the supervision of TANIA JUNE and IWAN SETIAWAN.
Drought detection based on evaporative fraction (EF) in Karawang district has been done by using remote sensing and energy balance modeling. EF indicates how much of the available energy is used for evapotranspiration, that is, for transpiration of the vegetation and evaporation of the soil and EF will be close to one (no water stress). As long as moisture is available, energy will be used for its evaporation. With little or no moisture left, all available energy will be directed into the sensible heat flux and EF will approach zero (serious water stress). The objectives of this research are to analyze energy balance and evaporative fraction as drought indicator in Karawang district; to asses the potential use of remote sensing capability in identifying the surface cover parameter of image and visualization using Remote Sensing and Geographic Information System and to develop a web-based GIS application to visualize and disseminate research results. The core processes of workflows involved in this research are image pre processing, data processing and analysis, and developing web-based GIS. Potential drought in Karawang district is low either in the wet season or dry season. Web based GIS drought indicator in Karawang district has been tested by sample end user. This process was done to see comments from the users after seeing and using this system.
SUMMARY
ADI WITONO (2008). Integrating Remote Sensing Data and Energy Balance Modeling for Detection of Drought and Its Publication in the Internet (Case Study of Karawang District, West Java). Under the supervision of TANIA JUNE and IWAN SETIAWAN.
The remote sensing, especially satellite remote sensing, can observe land, ocean and atmosphere from the space. In most applications, remote sensing data are converted into physical parameters or indices. The quantitative and qualitative analysis based on the same criteria can be implemented by using remote sensing data. Moreover, most of remote sensing data are processed as images, and then area-based information can be derived. Area-based information is quite effective to drought indicator.
Drought detection based on evaporative fraction (EF) in Karawang district has been done by using remote sensing and energy balance modeling. EF indicates how much of the available energy is used for evapotranspiration, that is, for transpiration of the vegetation and evaporation of the soil and EF will be close to one (no water stress). As long as moisture is available, energy will be used for its evaporation. With little or no moisture left, all available energy will be directed into the sensible heat flux and EF will approach zero (serious water stress).
The objectives of this research are to analyze energy balance and evaporative fraction as drought indicator in Karawang district; to asses the potential use of remote sensing capability in identifying the surface cover parameter of image and visualization using Remote Sensing and Geographic Information System and to develop a web-based GIS application to visualize and disseminate research results.
The core processes of workflows involved in this research are image pre processing, data processing and analysis, and development web GIS. Image pre processing stages consists of selecting, cropping, radiometric and geometric correction. Data processing and analysis to estimate energy balance has been performed using daily meteorological data from a surface station and daily remote sensing data from Landsat. Development web GIS is process to publish the spatial information of drought indicator.
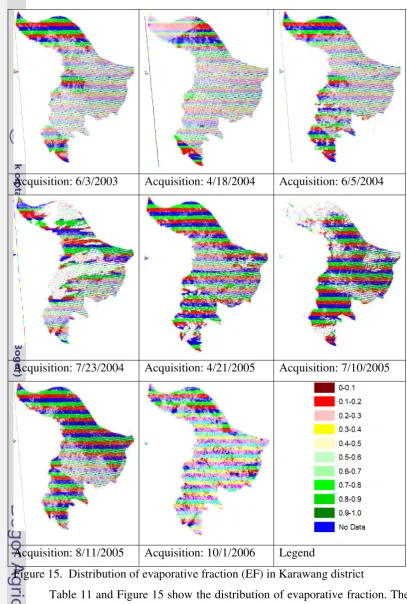
Evaporative fraction (EF) values used to determine area of drought vulnerability range from 0 – 0.4. The analysis results cover all areas of Karawang i.e. irrigated and non irrigated lands. Data of paddy filed areas obtained from the Department of Agriculture for Karawang district and after being overlaid between paddy fields as irrigated land and drought vulnerability area showed that the total area indicating drought vulnerability for irrigated land in June 2003, June 2004, July 2004, July 2005, August 2005 and October 2006 are 640 ha, 524 ha, 572 ha, 21 ha, 126 ha and 41,893 ha, respectively.
Copy right © 2008, Bogor Agricultural University Copy right are protected by law,
1. It is prohibited to cite all or part of this thesis without referring to and mentioning the source
a. Citation only permitted for the sake of education, research, scientific writing, report writing, critical writing or reviewing scientific problem
b. Citation doesn’t inflict the name and honor of Bogor Agricultural University
INTEGRATING REMOTE SENSING DATA AND ENERGY BALANCE MODELING FOR DETECTION OF DROUGHT AND
ITS PUBLICATION IN THE INTERNET (Case Study of Karawang District, West Java)
ADI WITONO
A Thesis submitted for the degree of Master of Science of Bogor Agricultural University
MASTER OF SCIENCE IN INFORMATION TECHNOLOGY FOR NATURAL RESOURCES MANAGEMENT
GRADUATE SCHOOL
Research Title : Integrating Remote Sensing Data and Energy Balance Modeling for Detection of Drought and Its Publication in the Internet (Case Study of Karawang District, West Java) Student Name : Adi Witono
Student ID : G051050101
Study Program : Master of Science in Information Technology for Natural Resources Management
Approved by, Advisory Board
Dr. Ir. Tania June, M.Sc Ir. Iwan Setiawan, PM
Supervisor Co-Supervisor
Endorsed by,
Program Coordinator Dean of Graduate School
Dr. Ir. Hartrisari Hardjomidjojo, DEA Prof. Dr. Ir. Khairil A. Notodiputro, MS
ACKNOWLEDGMENT
First of all I thanks to my God, my Family who has once more granted me success in my studies. I pay my heartfelt love and tribute to my beloved wife, Hetti Kurniasih who together with you waited patiently. I dedicate all my success to you.
Further, I would like to express my gratitude and sincerer appreciation to the following that contributed to my studies and success in one way or the other:
1. The LAPAN Institution thought the Fellowship Program for granting me fellowship to study in MIT Biotrop IPB Bogor Indonesia;
2. Dr. Tania June, M.Sc my research supervisors for all her valuable guidance and usefull advise during my MSc proposal preparation and MSc thesis writing;
3. Ir. Iwan Setiawan PM, my research coo-supervisors for all his valuable guidance and useful advice during my MSc proposal preparation and MSc thesis writing;
4. Prof. Dr. Ir. Hidayat Pawitan,M.Sc as examiner of this thesis for his positive ideas and inputs.
5. Special thanks go to all the members of lecturers and staff in MIT Biotrop IPB Bogor;
CURRICULUM VITAE
The author was born in Banyuwangi, East Java on December 29 1973, Indonesia. He is the youngest son of Tumijo and Suminah. He finished his Elementary, Junior, and High school in Government School, Banyuwangi. He received him undergraduate diploma from IPB, Faculty of Mathematic and Natural Sciences in field of Agrometeorology in 1999. Since 2003 to present, he worked for National Institute of Aeronautic and Space (LAPAN) Indonesia.
TABLE OF CONTENTS
TABLE OF CONTENTS ……… LIST OF TABLES ……….………...……… LIST OF FIGURES ………..
ix xi xii
I. INTRODUCTION ………...
1.1 Background ……….
1.2 Objectives...………..
1.3 Scope ...………...
II. LITERATURE REVIEW ………
2.1 Drought Indicator ………..…………..
2.1.1 Albedo ……….
2.1.2 Surface Temperature ………... 2.1.3 Normalized Different Vegetation Index ……….. 2.1.4 Energy Balance ………... 2.2 Application of Remote Sensing and GIS for Drought Prediction ... 2.3 Web Publication ………...………...
III. RESEARCH METHODOLOGY ………
3.1 Time and Location ……….. 3.2 Data and Sources Properties ………...
3.3 Required Tools ………
3.4 Methodology ………...
3.4.1 Image Pre-Processing ……….. 3.4.1.1 Selecting and Cropping Data ………...…. 3.4.1.2 Radiometric and Geometric Correction ……… 3.4.2 Data Processing and Analysis ………. 3.4.3 Energy Balance Modeling..……….. 3.4.4 Development of Web GIS..……….
1 1 4 4 6 6 9 12 13 14 21 23 25 25 25 25 26 27 27 27 27 27 28 IV. RESULT AND DISCUSSION …..………..
4.1 Energy Balance ………...…
4.1.1 Existing Land Use ………...
4.1.2 Albedo ……….
4.1.3 Surface Temperature ………...
4.1.4 NDVI ………...
4.1.5 Wind Velocity ………. 4.1.6 Air Temperature ……….. 4.1.7 Solar Radiation ……… 4.1.8 Net Radiation ……….. 4.1.9 Soil Heat Flux ………. 4.1.10 Sensible Heat Flux ……….. 4.1.11 Evapotranspiration .………. 4.1.12 Evaporative Fraction ………... 4.1.13 Irrigation ………. ………... 4.1.14 Drought Indicator ………
4.2 Web Development .………
4.2.1 Database Management ……… 4.2.2 Code Constructing ………...
4.2.3 Web View ………
4.2.4 Spatial Information from Web GIS ……….
4.2.5 Data Editing ………
4.2.6 Other Capability ……….. V. CONCLUSION AND RECOMMENDATION ...………
5.1 Conclusion ………..…………
LIST OF TABLES
No. Caption Page
1 2 3 4 5 6 7 8 9 10 11 12 13 14 15 16 17
Landsat-7 ETM+ postcalibration dynamic ranges………... Earth-sun distance in astronomical units ………...………. Mean solar exoatmospheric irradiances ……….. TM thermal band calibration constants ………... The existing land use of Karawang district ………. Albedo from Karawang district ………... Surface temperature in Karawang district………... NDVI in Karawang district……….. Total net radiation in Karawang district ……….…… Area of energy for soil heat flux ………. Total area of evaporative fraction (EF) in Karawang district ……... Discharge of water in Walahar dam (m3/dt) and volume (m3) ……... Acquisition data base on condition of season ………. Drought vulnerability data in Karawang district ………. Prediction of drought vulnerability ………... Schedule for planting season, prediction of harvest and watering irrigation ……….. Paddy field area in Karawang district ……….
LIST OF FIGURES
No. Caption Page
1 2 3 4 5 6 7 8 9 10 11 12 13 14 15 16 17 18 19 20 21 22 23 24
The area of study in Karawang district, West Java province
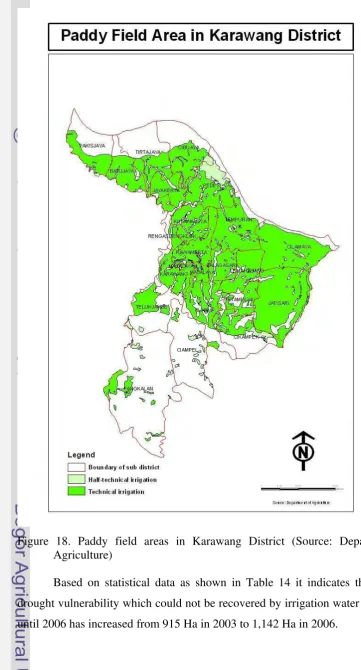
Spatial analysis functions ……… Flow diagram of research methodology ……….. Flow diagram of energy balance modeling ………. Schema to build and publish information ………... Distribution of albedo in Karawang district ……… Distribution of surface temperature in Karawang district …………... Distribution of NDVI in Karawang district………. Distribution of wind velocity in Karawang district………. Distribution of air temperature in Karawang district………... Distribution of net radiation (Wm-2) in Karawang district ………... Distribution energy for soil heat flux in Karawang district ………… Distribution energy for sensible heat flux in Karawang district…….. Distribution energy for evapotranspiration in Karawang district…… Distribution evaporative fraction (EF) in Karawang district………... Irrigation network map ………… ………. ………. Monthly average rainfall pattern in Karawang district period from 1971 to 2000 ……… Paddy field area in Karawang district (Source: Department of Agriculture) ………. Physical database using phpMyAdmin environment ……….. Main interface of drought indicator at Karawang district ……..……. Main page of web-based GIS drought indicator ………. Editing page to database in the web system ……… The screen shot of add comment page of web system………. The screen shot of add news page of web system………
I.
INTRODUCTION
1.1. Background
Droughts are normal recurring climatic phenomena that vary in space,
time, and intensity. They may affect people and agriculture at local scales for
short periods or cover broad regions or have impacts that are felt for years
(Brown, et. al., 2002). Traditional methods of drought monitoring rely on rainfall
data, which are limited in the network of stations and incomplete climate data,
often inaccurate caused by human error or unworking instrumentation. Most
importantly, data in near real time either spatially or temporally is available but
not accessible. In this sense, remote sensing technology has greatly enhanced our
ability to monitor and manage the natural resources, especially in the areas real
time spatial and temporal data are recorded continuously and has been used
extensively for water resources management (Runtunuwu, 2005). Remote sensing
data can be used in regional monitoring and management in two main ways. The
first is to monitor changes in land cover type and condition. This land cover type
(forest, crop, grassland, etc) and condition (green or dry) as well as the temporal
series of greening of crops can be monitored using a variety of satellite borne
instruments (such as Landsat TM, ASTER, SPOT and AVHRR) at a range of
spatial and temporal scales. The second use involves converting the remotely
sensed data to physical measurements of the earth and using them to derive
environmental parameters. This may lead to estimates for parameters of the cover
(such as leaf area index or LAI, cover fraction and reflectivity) as well as
geophysical parameters such as the surface radiometric temperature and albedo
agricultural planning, predicting of drought occurrence, monitoring, and providing
relief to drought-stricken areas. Because of the variability and significant multiple
impacts of droughts, we need to improve the available tools to capture their spatial
and temporal dimensions (Brown, et. al., 2002).
Despite the restricted availability of long time series of adequate remote
sensing data, their advantage of high spatial resolution, together with a satisfying
sampling rate of relevant surface parameters, should be taken into consideration
for drought monitoring. In order to derive spatially resolved information on the
water stress of vegetation, different data source have to be combined. In general,
remote sensing data provide a high spatial resolution, but few physical parameters,
while point data from surface measurements show high accuracy, but not spatially
resolved. Thematic data like landuse classification give qualitative information of
the surface cover, but remain static in time.
In the present study, the moisture status of the land surface is monitored
using the daily evolution of the evaporative fraction (EF). Among the various flux
ratios using energy balance modeling, EF has received special interest. EF is
defined as the part of the available energy used for evapotranspiration. This
quantity is an indicator of the moisture status of the land surface, mainly
consisting of natural vegetation and agriculture.
Water irrigation for agriculture in Karawang is mainly from Jatiluhur, and
have problem of water distribution during drought season. The height of water
level of Jatiluhur dam on November 15, 2006 is 81.59 meter. Normal condition is
usually indicated by water level of 89.81-92.06 meter (Pikiran Rakyat, 2006).
Water volume of Jatiluhur dam on January 24, 2007 is below normal level.
paddy fields in Karawang, Subang, Bekasi and Indramayu area get supply of
water. In Karawang target for paddy field area is 101,830 hectare, but only 47,637
hectare is being realized. It occurred due to lack of water supply for irrigation
from Jatiluhur dam (Kompas, 2007). The water supply from Jatiluhur dam for
irrigation is very limited since the allocation of water supply is divided for
industry and domestic use in Jakarta, Bekasi, and Karawang.
In environmental analysis, spatial data is one of the important factors that
need to be considered. Many researches, decision-makers, planners, and
corporate executives use this data to help them in making some critical decisions.
One of the common tools is geographic information system (GIS) which runs on
PC’s or workstations used to store, to analyze, and display multiple layers of
geographic information. The unique advantage of GIS is the ability to relate
locational map data or spatial data to relevant non-locational data, which is called
attribute. Remote sensing information produced by satellite must be interpreted
before used in a GIS.
In GIS environment, the expansion of computer network, including
internet and World Wide Web (www), creates a new opportunity to develop a
system for distribution of spatial information. Web-based geographical data
services involved management of spatial and non-spatial data introduced to
publish information of drought indictor. The development of a web-based system
by integrating GIS and DBMS could serve two crucial purposes. Firstly, it could
allow user to operate the system without having to grapple with the underlying
intricacies of GIS and DBMS technology. Secondly, it could allow sharing of
growth of the Internet and World Wide Web (WWW) provides highly
customized, accessible, and interactive sources of information.
The purpose of this research is to detect drought indicator using energy
balance and evaporative fraction with combine climate and remote sensing data in
Karawang district, West Java. Furthermore develop a web-based GIS application
to visualize and disseminate research results.
1.2. Objectives
The research objectives are:
1. to analyze energy balance and evaporative fraction such as drought
indicator in Karawang district;
2. to asses the potential use of remote sensing capability in identifying the
surface cover parameter of image and visualization using Remote Sensing
and Geographic Information System;
3. to develop a web-based GIS application to visualize and disseminate
research results.
1.3. Scope
Research site is Karawang district, which is geographically located
between 107o 05’ 11’’ - 107o 38’ 32’’ East and 05o 55’ 58’’ - 06o 38’ 28’’ South.
The research area is dominated by paddy fields and unirrigated land. Karawang
district covers an area of 1,737.30 km2 consisting of 30 sub districts.
Administratively, Karawang district is bounded by Java Sea in the northern part,
Subang district in the eastern part, Bekasi districts in the western part and Bogor
and Purwakarta districts in the southern part. Figure 1 shows Karawang district,
II.
LITERATURE REVIEW
2.1 Drought Indicator
Drought indicator is divided in three types
(
Voght, et. al., 1999). First, ismeteorological drought indicators based on meteorological parameters as recorded
at meteorological stations. An example is the Standardized Precipitation Index
(SPI). The SPI is a statistical indicator evaluating the lack or surplus of
precipitation during a given period of time as a function of a long term normal
precipitation to be expected during that period. It is calculated using a continuous,
long term (more than 30 years) series of historic monthly precipitation records. A
moving window is selected (1, 3, 6, 12, 24 months, depending on the purpose of
the analysis) and new series generated. Because rainfall is not normally
distributed for aggregation periods of less than 12 months a gamma distribution is
fitted to the frequency distribution. The SPI for a given rainfall amount is then
given by the precipitation deviation from the mean of an equivalent normally
distributed probability distribution function with a zero mean and standard
deviation of one resulting in units of standard deviation. This is an advantage
since the SPI is normalized so that wetter and drier climates can be represented in
the same way. In addition, wet periods can be monitored as well.
Second, is satellite based indicators calculated from satellite derived
surface parameter. Examples are various vegetation indices such as the
Normalized Difference Vegetation Index (NDVI), the Vegetation Condition Index
(VCI) and the Temperature Condition Index (TCI). Vegetation indices can be
efficient indicators of water stress in relatively homogenous terrain. However, in
is an indicator of the status of the vegetation cover as a function of the NDVI
minimum and maximum encountered for a given ecosystem over many years. It
normalizes the NDVI (or any other vegetation index) and allows for a comparison
of different ecosystem. It is an attempt to separate the short-term climatic signal
from long term ecological signal and in this sense it is a better indicator of water
stress condition than the NDVI. The significance of the VCI is strongly related to
the relation between the vegetation index and the vitality of the vegetation cover
under investigation. In addition, it depends on the number and quality of images
available for the calculation of the absolute minimum and maximum. The
Temperature Condition Index (TCI) is an equivalent indicator based on the
surface skin temperature derived from Landsat data. Both, the VCI and the TCI
are dimensionless and vary between the values of zero and one. Zero indicates the
worst condition ever encountered over the period of available images, one
indicates the best condition encountered during the same period of time. If the
covered period includes dry and wet years and under the assumption that the
vegetation condition is mainly related to the water availability, these indicators
have a high potential for monitoring water stress.
Third, a process base indicator is the result of modeling of energy and
matter transfer between the atmosphere and the surface. An example is
evaporative fraction, EF. EF is defined as the part of the available energy used for
evapotranspiration, i.e., the latent heat flux. This quantity is regarded as an
indicative of the moisture status of the surface cover.
The remote sensing, especially satellite remote sensing, can observe land,
ocean and atmosphere from the space. In most applications, remote sensing data
analysis based on the same criteria can be implemented by using remote sensing
data. Moreover, most of remote sensing data are processed as images, and then
area-based information can be derived. Area-based information is quite effective
to drought indicator.
Monitoring by satellite remote sensing techniques is most appropriate for
detecting the status of soil moisture, evapotranspiration, crop growth, land cover
type and drought. Using a surface observation station network and remote sensing
techniques, the development and spread of drought conditions can be monitored in
a routine and cost-effective manner. A method based on energy balance was
developed to estimate evapotranspiration (ET) and evaporative fraction (EF) to
monitor drought using Landsat-7 ETM+ digital images and meteorological data
The Landsat-7 ETM+ data were used to compute reflectance and temperature
after atmospheric correction. ET was estimated by combining remotely sensed
reflected solar radiation and surface temperature with ground station
meteorological data to calculate net radiation and sensible flux.
In principle, remote sensing can detect the electromagnetic wave radiated
or reflected from atmosphere, land or ocean. However, due to limitation in
budget, we focus on the usage of medium resolution data (Landsat-7 ETM) which
are available free of charge through the Internet. Landsat-7 ETM+ images were
used for the analysis in the present research. Especially, those images were used
for the extraction of drought indicator. Three parameters were selected, i.e.
albedo, Normalized Difference Vegetation Index (NDVI), and land surface
temperature (Ts). In the following subsection, methods to derive parameters are
2.1.1 Albedo (α)
Land surface albedo is a physical parameter that describes the optical
reflectance of the land surface. Albedo is commonly defined as the reflectance of
a surface integrated with respect to both wavelength (usually between 0.3 µm and
3.0 µm) and angle (i.e. for all directions within the hemisphere above the surface).
Examples of the albedo applications include global and regional climatic models
for computing the surface energy balance. Three types of albedos, i.e.
total-shortwave, total-visible and total-near-infrared albedos, are available. The
procedure to estimate albedo from digital number (DN) value is described as
follows:
Firstly, according to USGS (2002) DN value was converted into radiance
L by applying equation (1). A digital number or DN is the value stored within a
pixel or cell of an image. Typically, the DN of the pixel represents the amount of
light reflected back to the satellite/sensor. However, this is dependent upon the
type of data stored in the image. Digital data acquired from satellites are provided
to the user in the form of quantified and calibrated values (QCal) for individual
picture elements (pixels). These post-calibration QCal values are in units of
digital numbers, which have a full range of 8 bits.
(
)
(
)(
min minmin max
min
max QCal QCal L
QCal QCal
L L
L − +
− −
=
)
..………..………..(1)where Lmin and Lmax are the spectral radiances for each band at digital numbers 0
or 1 and 255, QCal is calibrated and quantified scaled radiance values in digital
numbers 0-255, QCalmin and QCalmax are the minimum and maximum quantized
calibrated pixel value. Values for Lmax and Lmin vary for each of the Landsat
published for a given sensor are expressed in units of watts per square meter per
steradian per micrometer (W m-2 ster-1 µm-1). Table 1 shows Lmin and Lmaxfor all
bands of Landsat 7 ETM+, or Lmin, Lmax, QCalmin and QCalmax available in the
metadata of data.
Table 1. Landsat-7 ETM+ postcalibration dynamic ranges. Unit of Lmin and Lmax
are W m-2ster-1µm-1
High Gain Band
Lmin Lmax
1 -6.2 191.6
2 -6.4 196.5
3 -5.0 152.9
4 -5.1 241.1
5 -1.0 31.06
6 0.0 12.65
7 -0.35 10.80
8 -4.7 158.3
Source: USGS (2002)
Radiance was converted into reflectance. According to USGS (2002) the
reflectance can be calculated from Landsat -7 data using equation as follows:
θ π ρ λ λ cos 2 ESUN d L i
i = ………..………(2)
where,
i
ρ = Effective at satellite planetary reflectance composed the combined surface
and atmospheric reflectance of the earth (unitless).
i
Lλ = Spectral radiance at the sensor's aperture (W m-2ster-1µm-1)
d= Earth-Sun distance in astronomical units from nautical handbook (Table 2)
λ
ESUN = Meansolar exoatmospheric irradiances (Table 3)
Table 2. Earth-sun distance in astronomical units
Julian
Day Distance
Julian
Day Distance
Julian
Day Distance
Julian
Day Distance
Julian
Day Distance
1 .9832 74 .9945 152 1.0140 227 1.0128 305 .9925
15 .9836 91 .9993 166 1.0158 242 1.0092 319 .9892
32 .9853 106 1.0033 182 1.0167 258 1.0057 335 .9860
46 .9878 121 1.0076 196 1.0165 274 1.0011 349 .9843
60 .9909 135 1.0109 213 1.0149 288 .9972 365 .9833
Source: USGS (2002)
The astronomical unit, the AU, is a unit of distance equal approximately to the
average distance between the earth and sun. More precisely stated, one
astronomical unit is approximately the value of the semi major axis of the orbit of
the earth. (For the purists, the AU is actually a tiny bit less than the semi major
axis.) This represents a distance of about 93 million miles or 150 million
kilometers.
Table 3. Meansolar exoatmospheric irradiances
Band Wm-2 m-1
1 1969.000 2 1840.000 3 1551.000 4 1044.000 5 225.700 7 82.07 8 1368.000
Source: USGS (2002)
Finally, albedo was estimated for Landsat-7 ETM+ using equation as follows:
3 2
1 0.317 0.240
443 .
0 ρ ρ ρ
αVIS = + + ………..……….(3)
003 . 0 116 . 0 212 . 0 693 .
0 4 + 5 + 7 −
= ρ ρ ρ
αNIR ………..………...(4)
where αvis, αnir and αsw denote total visible (0.4-0.7 µm), near-infrared (0.7-2.5 µm)
and shortwave albedo (0.25-2.5 µm) for ETM+, respectively. ρn denotes
reflectance of band n (band 1-5 and7).
2.1.2 Surface Temperature (Ts)
Thermal band data (band 6) from Landsat ETM+ can also be converted
from spectral radiance to effective at-satellite temperature. According to USGS
(2002) surface temperature can be calculated from Landsat data divided two steps.
First step calculation brightness temperature with equation:
⎥ ⎦ ⎤ ⎢ ⎣ ⎡ + = 1 ln ) ( 1 2 λ L K K K
T ………..……… (6)
where,
T(K) = Effective at satellite temperature in Kelvin
K1= calibration constant 1 in Wm-2ster-1µm-1
K2= calibration constant 2 in Kelvin
Lλ= Spectral Radiance in Wm-2ster-1μm-1
DN=Digital number of each channel (0-255)
Table 4 shows calibration constants K1 and K2 for Landsat TM and ETM+.
Table 4. TM thermal band calibration constants
Units Wm-2ster-1μm-1 Kelvin
Constant K1 K2
Landsat 5 TM 607.76 1260.56
Landsat 7 ETM+ 666.09 1282.71
Source: USGS (2002)
Second step is to calculate a kinetic temperature. The effective satellite
spectral emissivity ε are necessary. The kinetic temperature is the variable needed
for subjects like heat transfer, because it is the translational kinetic energy which
leads to energy transfer from a hot area (larger kinetic temperature, higher
molecular speeds) to a cold area (lower molecular speeds) in direct collisional
transfer. Kinetic temperature is derived from emissivity correction with equation
as follows:
Tkinetic K
T( )=ε0.25 ...……….……….………...(7)
where ε is emissivity constant (vegetation 0.95, non vegetation 0.92 and water
body 0.98).
Last step is to calculate a land surface temperature with equation below:
16 . 273 − =Tkinetic Ts ………..………(8)
where Ts is surface temperature (oC).
2.1.3 Normalized Different Vegetation Index (NDVI)
NDVI has been widely recognized useful for the studies of the land
biosphere characteristics and dynamics at regional to global scales. NDVI is more
sensitive to chlorophyll and less contaminated by atmospheric water vapor. NDVI
is obtained through calculation of reflectance’s of the red and near infrared (NIR),
expressed as the following equations.
RED NIR RED NIR NDVI ρ ρ ρ ρ + −
= ………..……….(9)
where ρRED and ρNIR denote reflectance’s at red band and NIR band, respectively.
For Landsat TM/ETM+, band 3 and 4 are used.
Vegetation indices (VI) are commonly used to calculate and map
vegetation characteristics. The NDVI has been the most widely used method to
has a range from -1.0 to 1.0, in which higher index values are associated with
higher level of healthy vegetation.
2.1.4 Energy Balance
Solar radiation is the largest energy source and is able to change large
quantities of liquid water into water vapor. The potential amount of radiation that
can reach the evaporating surface is determined by its location and time of the
year. Due to differences in the position of the sun, the potential radiation differs at
various latitudes and in different seasons. The actual solar radiation reaching the
evaporating surface depends on the turbidity of the atmosphere and the presence
of clouds which reflect and absorb major parts of the radiation. When assessing
the effect of solar radiation on evapotranspiration, one should also bear in mind
that not all available energy is used to vaporize water. Part of the solar energy is
used to heat up the atmosphere and the soil profile.
A simple modeling methodology rooted in climatology – called ‘energy
balance’ modeling – is available to study the role of land cover energy
consumption rates. Energy balance refers to the physical fact that energy cannot
be created nor destroyed so that the solar and longwave radiation energy received
by a land cover layer during any time interval must exactly equal, or ‘balance,’ the
energy gained by that layer minus that is lost from the layer during the same time
interval. The physical equations that describe these gains and losses are widely
used in climate studies.
The radiation coming from the sun can be split into longwave and
shortwave. The longwave radiation does heat particular ground features that will
instantly reflected by ground features according to their albedo characteristics.
The components of the net radiation (Rn) have been derived as follows (W/m2):
out out in
in Rl Rs Rl
Rs
Rn= + − − ………...………....(10)
The equation above is the energy budget concept of the surface at noon. This
equation explained that the net radiation is the accumulation from incoming
shortwave radiation (Rsin) plus incoming longwave radiation (Rlin) minus
outgoing shortwave radiation (Rsout) and outgoing longwave radiation (Rlout).
This rather simple system of radiation balance is considering the ground
elements as a layer of a given height, responding uniformly to a radiation
stimulus. This concept has two direct advantages, the first one is to simplify
inlayer structural ground element interactions, and the second one is that it is very
well fitting the ideal description of a satellite remote sensing and its ground
sampling unit: the pixel.
The net radiation is the difference between incoming and outgoing
radiation of both short and longwave lengths. It is the balance between the energy
absorbed, reflected and emitted by the earth's surface or the difference between
the incoming net shortwave and the net outgoing longwave radiation. Rn is
normally positive during the daytime and negative during the nighttime. The total
daily value for Rn is almost always positive over a period of 24 hours, except in
extreme conditions at high latitudes.
The Energy Balance partitioning is summarized at an instant time t (at the
time of satellite overpass) by the following equation:
E H G
where Rn is the net radiation emitted from the Earth surface (W/m2), G is the soil
heat flux (W/m2), H is the sensible heat flux (W/m2), λE is the latent heat flux,
being the energy necessary to vaporize water (W/m2).
The equation to calculate the net radiation is given by the following equation:
(
4 16 . 273 ) 1 ( − + − += Rs Rl Ts
Rn α εσ
)
………...………..(12)where α is the albedo, Rs is the downward solar radiation, Rl is the downward
longwave radiation, ε is the emissivity of the surface, σ is the Stefan-Bolzmann
constant, and Ts is the surface temperature.
If the solar radiation, Rs, is not measured, it can be calculated with the Angstrom
formula which relates solar radiation to extra terrestrial radiation and relative
sunshine duration: Ra N n bs as Rs ⎟ ⎠ ⎞ ⎜ ⎝ ⎛ + = ………..……….(13)
Depending on atmospheric conditions (humidity, dust) and solar
declination (latitude and month), the Angstrom values as and bs will vary. Where
no actual solar radiation data are available and no calibration has been carried out
for improved as and bs parameters, the values as = 0.25 and bs = 0.50 are
recommended. The extraterrestrial radiation, Ra, and N is the daylight hours or
maximum possible duration of sunshine. The actual duration of sunshine, n, is
recorded with a Campbell Stokes sunshine recorder.Ra is extraterrestrial radiation
constitute function from altitude, time angle, zenith angle and sun declination
angle depending on date.
The calculation of the clear-sky radiation, Rs, when n = N, for as and bs
(
z)
RaRs= 0.75+2*10−5 ………..……….(14)
where z is station elevation above sea level.
The rate of longwave energy emission is proportional to the absolute temperature
of the surface raised to the fourth power. This relation is expressed quantitatively
by the Stefan-Boltzmann law. The net energy flux leaving the earth's surface is,
however, less than that emitted and given by the Stefan-Boltzmann law due to the
absorption and downward radiation from the sky.
(
)
4(
2)
17 . 0 1 7 . 0 * 16 .
273 N
Ta
Rl =εσ + + ………...…………(15)
where Ta is air temperature from climate station and N is percentage of cloud for
satellite data.
Generally lateral fluxes are not considered when dealing with remote
sensing images because of their spatial cover capturing the instantaneous energy
balance system. Even when transforming the energy balance components for a
daily extrapolation of the values, lateral exchanges between pixels are found
either in one pixel or in the neighboring ones, extrapolation does not expose
lateral values yet encompasses them. The instantaneous soil heat flux (G) is
approximated by fraction on the net radiation, as a function of the NDVI
(Normalized Difference Vegetation Index). The soil heat flux is the energy that is
utilized in heating the soil. G is positive when the soil is warming and negative
when the soil is cooling. Although the soil heat flux is small compared to Rn and
may often be ignored, the amount of energy gained or lost by the soil in this
process should theoretically be subtracted or added to Rn when estimating
evapotranspiration.
where, ) 0.98NDVI -(1 ) 007 . 0
(0.0038+ α 4
=Ts Rn
G
………..…..………….(16)
NDVI = Normalized Different Vegetation Index (determined from Landsat)
Heat flow into the soil, is driven by a thermal gradient in the uppermost topsoil. It
is a conduction flux through the soil matrix. This gradient varies with the state of
the vegetation covering the soil that is influencing the light interception by the soil
surface. The radiative heating of the topmost layer is then directly modifying the
surface temperature and thermal gradient in the top layer.
The sensible heat flux (H) is a convection flux through the atmosphere
layers, coming from the surface skin boundary layer with the topmost
soil/vegetation layer. The sensible heat flux has been estimated from the
difference between radiometric surface temperature (Ts) and surface-measured air
temperature (Ta), and the formulation of a bulk aerodynamic resistance (W/m2).
The difference between the known radiometric surface temperature and the
unknown aerodynamic surface temperature, which actually should be applied, is
referred to the following formulation of aerodynamic resistance.
) (
273 900
2 Ts Ta
U Ta
H −
+
=γ λ ………..………..………...(17)
where,
Ts = Surface temperature (° C) (Landsat)
Ta = Air temperature (° C)
γ = Psychometrics constants ( kPa °C-1)
= Wave lenght of radiation emission (11.5 µm)
U2 = Wind velocity at 2 m above ground surface (m s-1)
P P
cp 3
10 * 665 . 0 − = = ελ
γ (FAO, 1998)…...………..……….(18)
where,
P=Atmospheric pressure (kPa)
λ= Latent heat of vaporization (2.45 MJ kg-1)
cp = Specific heat at constant pressure, 1.013 10-3 (MJ kg-1 °C-1)
ε = Ratio molecular weight of water vapour/dry air = 0.622
The specific heat at constant pressure is the amount of energy required to increase
the temperature of a unit mass of air by one degree at constant pressure. Its value
depends on the composition of the air, i.e., on its humidity. For average
atmospheric conditions a value cp = 1.013 10-3 MJ kg-1 °C-1 can be used. As an
average atmospheric pressure is used for each location (Equation 19), the
psychrometric constant is kept constant for each location.
26 . 5 293 006 . 0 293 3 . 101 ⎟ ⎠ ⎞ ⎜ ⎝ ⎛ − = z
P (FAO, 1998)…...………..……….(19)
where,
z = Elevation above sea level (m)
Wind speeds measured at different heights above the soil surface are
different. Surface friction tends to slow down wind passing over it. Wind speed is
slowest at the surface and increases with height. For this reason anemometers are
placed at a chosen standard height, i.e., 10 m in meteorology and 2 or 3 m in
agrometeorology. For the calculation of evapotranspiration, wind speed measured
at 2 m above the surface is required. To adjust wind speed data obtained from
logarithmic wind speed profile may be used for measurements above a short
grassed surface:
(
67.8 5.42)
ln
87 . 4
2 = −
z U
U z (FAO, 1998)……….…(20)
where,
U2 = Wind velocity at 2 m above ground surface (m s-1)
Uz = Wind velocity from measurements at above ground surface (m s-1)
z = Height of measurement above ground surface (m)
The energy necessary to vaporize water under given atmospheric
conditions is especially ruled by the resistance to vaporization parameter. The
latent heat flux (λE) is energy that used to evaporate water. The
evapotranspiration process is determined by the amount of energy available to
vaporize water.
)
(Rn G H
E= − −
λ ………..………..(21)
where,
λE = Energy for Evapotranspiration (W/m2)
Rn = Net Radiation (W/m2)
H = Energy for Sensible Heat Flux (W/m2)
G = Energy for Soil Heat Flux (W/m2)
Finally, the evaporative fraction (EF) is expressed as:
G Rn
E EF
−
= λ ………..………...(22)
EF indicates how much of the available energy is used for evapotranspiration, that
is, for transpiration of the vegetation and evaporation of the soil and EF will be
close to one (no water stress). As long as moisture is available, energy will be
be directed into the sensible heat flux and EF will approach zero (serious water
stress).
The above mentioned methods, however, require quite complex models to
construct the case-specific algorithms which make direct use of remote
measurements of spectral radiances. Presently a lot of effort is concentrated into
increasing the accuracy of radiant fluxes, even if surface albedo can easily be
estimated by common sensors (enabling the calculation of the shortwave net
radiation), it takes more specific sensors to estimate the longwave component of
the radiation balance. Surface albedo and temperature can also be the basis for
estimates of the upwelling components, while the downwelling components are
based on meteorological data. Soil heat flux can be estimated by the ratio G/Rn
through spectral indices or by semi empirical equation including Rn, the surface
albedo, the surface temperature, NDVI and the area average surface albedo. Even
if the net radiation and soil heat flux parts of the energy balance equation are
relatively well known and estimated from a remote sensing point of view, the
remote sensing of the sensible heat flux especially its most critical parameter is
still limited.
2.2 Application of Remote Sensing and GIS for Drought Prediction
Remote sensing is the science (and to some extent, art) of acquiring
information about the earth's surface without actually being in contact with it.
This is done by sensing and recording reflected or emitted energy and processing,
analyzing, and applying that information. In much of remote sensing, the process
involves an interaction between incident radiation and the targets of interest. This
are involved. Note, however that remote sensing also involves the sensing of
emitted energy and the use of non-imaging sensors.
Computer based systems are used to store and manipulate geographic
information (Aronoff, 1991). A computer system is capable of holding and using
data describing places on the earth’s surface. Any of various software
applications, running on PCs or workstations, that store, analyzes, and displays
multiple layers of geographic information (Lang, 1998).
Many types of information that are needed in natural drought management
are important such as map, satellite imagery, GPS data, climate data, etc. Many of
these data have different projection and coordinate system, and need to be brought
to a common map basis in order to superimpose them (Westen, 2002). Remote
sensing and GIS provide a historical database from which drought map may be
generated, indicating which areas are potentially dangerous.
When drought occurs, the speed of information collection from air and
space borne platforms and the possibility of information dissemination with a
corresponding swiftness make it possible to monitor the occurrence of the
drought. Simultaneously, GIS may be used to integrate satellite data with other
relevant data (such as climate data), useful in combination with Global
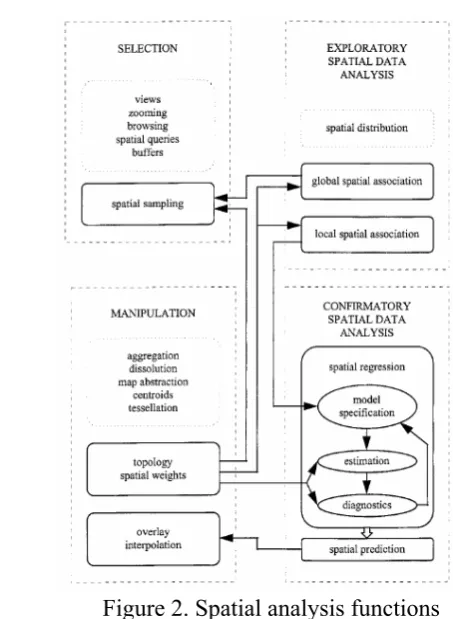
Positioning System (GPS) and classification of the spatial analysis functionality
(selection, manipulation, exploration, and confirmation). The interaction between
Figure 2. Spatial analysis functions
2.3 Web Publication
The greatest problem for decision makers, resource managers and user
who handle information is accessing the right information at the real time.
Internet is a global, public collection of individual networks that is operated by
private organizations, universities, and government agencies (Maududie, et. al.,
2002). GIS takes advantages of the internet as a media of GIS dissemination, so
that the GIS data can be accessed by different computers (or servers) from
anywhere across the internet. To be able to access and share remote GIS data, the
system requires high interoperability (Peng, et. al., 2003). The internet and
web-based GIS is an effective medium for publication of spatial data. Web-web-based GIS
is not a single technology, there are many combined components to build web
based GIS, such as software and hardware. These technologies are related to web
HTML and web scripting, and the theories about GIS. It is important to define
the different forms of web-based GIS, before selecting a specific location for any
given application.
One type of web-based GIS applications is Map Generators. Map
generators use a web-based browser form. The user enters specifications of
drought event such as location, thematic layers and symbols on the form. The
form is passed to the web server. A gateway at the web server passes the request
to a GIS server. For instance, the gateway could pass the request in the form of
AML to an Arc/INFO server. The Arc/INFO server generates a graphic file,
which is converted to a GIF image. The GIF image is sent back to the client and
viewed using native browser capability. The advantage of map generators is
creating custom maps on the fly. Disadvantages include lack of access to the raw
spatial data, typically at a slower speed, limited predefined user choices, and
III.
RESEARCH METHODOLOGY
3.1 Time and Location
The research was conducted from February until June 2007 at
MIT-BIOTROP covering Karawang District, West Java. Image processing and
analysis of satellite data have been conducted from March to May 2007 at the
National Institute of Aeronautics and Space (LAPAN).
3.2 Data and Sources Properties
1. Remote sensing data (Landsat-7 ETM+) obtained from LAPAN between
2003 until 2006 (series data per year for wet or dry session).
2. Vectors data (administration from Bakosurtanal and irrigation network
from Local Government) and DEM-SRTM from USGS.
3. Climatic data from BMG (series data rainfall 1971-2000, air temperature
and wind velocity 1995 – 2002) and from PJT-II Jatiluhur (series data
rainfall 2004-2006).
4. Field data (coordinate position, land cover and land use checking from
classification Landsat ETM+ between actual conditions in the field).
5. Statistical data (drought vulnerability, paddy field, discharge and volume
of water).
3.3 Required Tools
The hardware tools used for this research consist of Personal Computer
(Pentium IV with Processor 1.8 GB, RAM 526 MB, Hard disk 60 GB), LaserJet
2500 Printer, and hand held Global Positioning System (GPS) device, while the
The softwares used to publish information through Web GIS are:
- MS4W (Map Server for Windows). MS4W, a free software package, that is
Apache for web server application i.e., Map Server; this software is used to
develop web based GIS application. With the use of PHP script, map server
script can process the spatial database and non-spatial database
- MySQL 4.0.18 is a software used to store and manage all related data. This is
a free software for database application
- Macromedia Dreamweaver MX 2004 is used to develop web pages.
3.4 Methodology
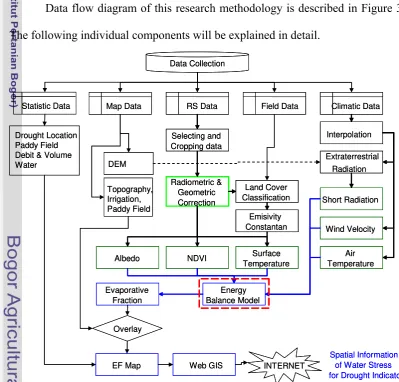
Data flow diagram of this research methodology is described in Figure 3.
The following individual components will be explained in detail.
Map Data RS Data Field Data Climatic Data
Selecting and Cropping data Radiometric & Geometric Correction NDVI Albedo Surface Temperature Land Cover Classification Emisivity Constantan Short Radiation Wind Velocity Air Temperature Extraterrestrial Radiation Topography, Irrigation, Paddy Field DEM Interpolation Energy Balance Model Evaporative Fraction EF Map Overlay Spatial Information of Water Stress for Drought Indicator
Statistic Data
Drought Location Paddy Field Debit & Volume Water
Web GIS INTERNET Data Collection
Map Data RS Data Field Data Climatic Data
Selecting and Cropping data Radiometric & Geometric Correction NDVI Albedo Surface Temperature Land Cover Classification Emisivity Constantan Short Radiation Wind Velocity Air Temperature Extraterrestrial Radiation Topography, Irrigation, Paddy Field DEM Interpolation Energy Balance Model Evaporative Fraction EF Map Overlay Spatial Information of Water Stress for Drought Indicator
Statistic Data
Drought Location Paddy Field Debit & Volume Water
[image:40.595.104.504.346.728.2]Web GIS INTERNET Data Collection
3.4.1 Image Pre-Processing
3.4.1.1 Selecting and Cropping Data
The aim of selecting data is to get the free cloud-cover image data. Furthermore,
to get the efficiency in image processing, the selected data are cropped for the
study area.
3.4.1.2 Radiometric and Geometric Correction
Radiometric and geometric errors are the most common types of error
encountered in remotely sensed imagery. To remove or minimize the error the
following should be done:
1. Radiometric correction, using histogram adjustment
2. Geometric correction is the basic operation in geometric rectification
which covers collecting ground control point (GCP), transformation and
resampling. The topographic map from Bakosurtanal of Karawang district
with the scale of 1:25.000 is used to correct the image data.
3.4.2 Data Processing and Analysis
Satellite imagery data is analyzed using ER Mapper 7 and vector data is
processed using ArcView 3.3. Field data are collected from surveys and position
of the location is taken by using GPS. Field data is used to verify result of land
cover. Result analysis is thematic images of evaporative fraction from 2003 until
2006.
3.4.3 Energy Balance Modeling
Energy balance estimation has been performed using daily meteorological
data from surface station and daily remote sensing data from Landsat. The flow
Remote Sensing Data
Climate Data
NDVI Ts α Ta U2 Rs
Net Radiation (Rn)
( )4
16 . 273 ) 1 ( − + − +
= Rs Rl Ts
Rn α εσ
Net Radiation (Rn)
( )4
16 . 273 ) 1 ( − + − +
= Rs Rl Ts
Rn α εσ
Sensible Heat Flux (H)
) ( 273 900
2Ts Ta
U Ta
H −
+ =γ λ
Sensible Heat Flux (H)
) ( 273 900
2Ts Ta
U Ta
H −
+ =γ λ
Soil Heat Flux (G)
) 0.98NDVI -(1 ) 007 . 0
(0.0038α α2 4
α +
=Ts Rn
G
Soil Heat Flux (G)
) 0.98NDVI -(1 ) 007 . 0
(0.0038α α2 4
α +
=Ts Rn
G Energy Evapotranspiration (λE)
) (Rn G H E= − − λ
Energy Evapotranspiration (λE)
) (Rn G H E= − − λ
Evaporative Fraction (EF)
G Rn E EF − = λ
Evaporative Fraction (EF)
G Rn E EF − = λ
Figure 4. Flow diagram of energy balance modeling
3.4.4 Development of Web GIS
In this research we also develop a web GIS to publish the spatial
information of energy balance (Figure 5). Developing web GIS is divided into
three major steps. First, is the design data information of drought indicator.
Second, is building web page based on drought information. The last step is
publishing the spatial drought information through the internet.
The raw materials for information system are data input, i.e. the
representation of facts or concepts that becomes usable when processed. Data is
required to produce information which is needed by users. There are conceptual,
logical and physical database designs. Conceptual design focuses on what data
should be stored in the database, while the function model deals with how the data
is processed. To put this in the context of the relational database, the data model
is used to design the relational tables. The functional model is used to design the
queries that will access and perform operations on those tables. Logical database
design focuses on constructing a model of information used in an enterprise based
on specific data model. Logical model explains the logic of database which is the
process of constructing a model of information used in an enterprise based on
specific data model, but independent of particular DBMS and other physical
considerations. Physical design describes the physic of database visualization,
which allows the designer to make decisions on how the database is to be
implemented. Physical model describes the data physically where entity is set
based on database software.
This phase building web page also applies to the programs which process
the database. In the system development approach, the parallel activities could be
observed. The designed web page of the system is divided into two parts.
1. Design of spatial modeling includes spatial data selection and spatial data
manipulation.
2. Design of output includes map, graph and table.
The last step is implementation to improve the system. A standard web browser
spatial database. The server sends back a result of request to the client. An
interface will be developed which allows user to query the spatial database. The
result is returned to the user’s browser as an HTML file that contains the dataset
IV.
RESULTS AND DISCUSSION
4.1. Energy Balance
The component is analyzed from Landsat-7 and climate data. Landsat-7 ETM+ image data used is from 2003 to 2006. Mosaic process is applied only to data 2006 to see land cover condition. The data actually was invalid since 2003 and a lot of striping data cannot be analyzed. Climate data are obtained from BMG (air temperature and wind velocity data acquisition 1995 to 2002) and from PJT-II Jatiluhur (rainfall data acquisition 2004 to 2006).
4.1.1. Existing Land Use
The exiting land use map is obtained by interpreting Landsat-7 ETM+ image in October 2006. The land use map consists of paddy field, industrial area, residential area, fish pond, vegetation cover, unirrigated land and water body. Table 5 shows Karawang district where 22% of the total area is paddy field area and 1.8% industrial area. Because in October 2006 usually start of the rainy season, but there was no rainfall observed. Based on data form BPS Karawang total area paddy field at 2006 is 82,285 ha. So existing paddy field detected is low and partly detected is unirrigated land. Data used is Landsat-7 ETM+ after mosaic process.
Table 5. The existing land use of Karawang district
No Land Use Area (ha) Area (%)
1 Paddy Field 42,424 22
2 Industry 3,476 2
3 Residential 10,282 5
4 Fish Pond 14,777 8
5 Vegetation 51,889 27
6 Unirrigated Land 69,891 36
7 Water 357 0
Total 193,097 100
4.1.2. Albedo
direction and direction distribution of incoming radiation. Around 20,000-30,000 ha area cannot be analyzed due to a striping data since 2003.
Acquisition: 6/3/2003 Acquisition: 4/18/2004 Acquisition: 6/5/2004
Acquisition: 7/23/2004 Acquisition: 4/21/2005 Acquisition: 7/10/2005
Table 6. Albedo from Karawang district
6/3/2003 4/18/2004 6/5/2004 7/23/2004 4/21/2005 7/10/2005 8/11/2005 10/1/2006
0-0.1 22,364 19,029 39,652 28,152 25,128 46,825 15,435 12,972
0.1-0.2 149,146 149,049 110,634 135,556 115,995 116,127 150,699 156,612
0.2-0.3 583 1,035 6,623 6,341 13,220 1,137 1,711 2,581
0.3-0.4 74 287 3,150 337 4,958 320 357 49
0.4-0.5 49 262 3,826 47 4,198 164 312 6
0.5-0.6 3 48 2,811 0 1,255 29 171 0
0.6-0.7 0 0 519 0 0 0 16
0.7-0.8 0 0 0 0 0 0 0 0
0.8-0.9 0 0 0 0 0 0 0 0
0.9-1 0 0 0 0 0 0 0 0
No Data 21,022 23,533 26,026 22,808 28,486 28,639 24,540 21,022
Total 193,241 193,241 193,241 193,241 193,241 193,241 193,241 193,241 Albedo/
Date
Area (ha)
0
Table 6 shows area of albedo range in Karawang district, and the distribution of albedo. The dominant albedo is 0.1-0.2, the indicator area are vegetation, residential, industrial, and unirrigated lands. Albedo with range of 0-0.1 is dominant in water body and fish pond areas. It indicaties that a lot of radiant reflected from surface is low and radiation absorbed is high.
4.1.3. Surface Temperature
Land surface temperature is one of the key parameters of land surface process, combining surface-atmosphere interaction and energy fluxes between the atmosphere and the ground. Table 7 shows the distribution of surface temperature at Karawang district. The value of land surface temperature ranges from 24-34 oC detected from thermal sensor of Landsat-7 ETM+ satellite. Based on Figure 7 the surface temperature value of October 01, 2006 is high.
Table 7. Surface temperature in Karawang district.
6/3/2003 4/18/2004 6/5/2004 7/23/2004 4/21/2005 7/10/2005 8/11/2005 10/1/2006
24-25 0 102 4,782 24,432 10,941 1,135 289 2
25-26 10 317 5,443 11,181 8,533 4,587 515 7
26-27 205 1,885 6,325 17,096 36,622 16,748 1,086 32
27-28 44,197 64,421 42,995 46,838 102,035 125,211 83,370 2,539
28-29 94,448 85,636 92,316 52,874 6,255 14,563 67,609 25,529
29-30 32,642 16,389 15,119 16,530 360 2,328 15,516 42,425
30-31 715 923 235 1,464 9 30 316 40,766
31-32 2 25 1 19 1 1 0 40,497
32-33 0 0 0 0 0 0 0 12,
33-34 0 0 0 0 0 0 0 8,
No Data 21,022 23,543 26,026 22,808 28,486 28,639 24,540 21,022
Total 193,241 193,231 193,241 193,241 193,241 193,241 193,241 193,241
TS/ Date Area (ha)
Acquisition: 6/3/2003 Acquisition: 4/18/2004 Acquisition: 6/5/2004
Acquisition: 7/23/2004 Acquisition: 4/21/2005 Acquisition: 7/10/2005
Acquisition: 8/11/2005 Acquisition: 10/1/2006 Legend (oC) Figure 7. Distribution of surface temperature in Karawang district
surface is relatively dry because there was no rain for a successive time and limited distribution of water from Jatiluhur dam, consequently the surface temperature of non-vegetation is higher (29-34 oC ), while for vegetation area it is less than 29 oC.
4.1.4. NDVI
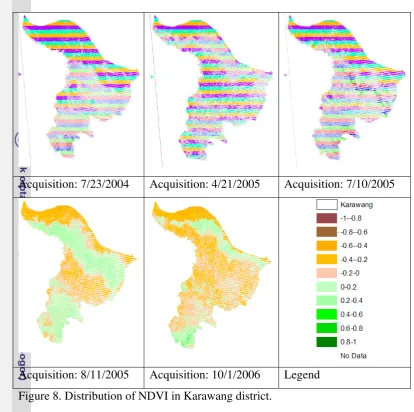
Based on Figure 8 the vegetation index number in April 2004 is higher than in June-July 2004, while the condition in 2005 showed that for the wet season it is lower than dry season (July-August). Furthermore, in 2003 the vegetation index is moderate especially in paddy field areas, while in 2006 the distribution is different with low vegetation index or mostly negative. Vegetation index area (Normalized Different Vegetation Index) is dominant at moderate level (0-0.6) except in October 2006 where the dominance is at low level (-0.6-0). Table 8. NDVI in Karawang district.
6/3/2003 4/18/2004 6/5/2004 7/23/2004 4/21/2005 7/10/2005 8/11/2005 10/1/2006
-1--0.8 0 5 0 1 33 12 0
-0.8--0.6 123 131 93 60 57 56 4 119
-0.6--0.4 9,545 6,881 8,884 10,385 6,716 7,044 5,215 5,208
-0.4--0.2 41,670 31,168 48,430 59,101 53,720 44,969 36,733 52,157
-0.2-0 42,765 38,734 46,870 40,907 59,219 37,240 48,599 70,431
0-0.2 32,341 37,598 41,678 34,672 29,609 30,227 45,068 30,470
0.2-0.4 42,600 53,387 19,602 24,113 14,692 39,125 32,745 13,427
0.4-0.6 2,730 1,591 1,149 924 190 5,478 1 393
0.6-0.8 0 0 0 0 0 0 0
0.8-1 0 214 508 269 518 452 336 11
No Data 21,467 23,533 26,026 22,808 28,486 28,639 24,540 21,022
Total 193,241 193,241 193,241 193,241 193,241 193,241 193,241 193,241 NDVI/
Date
Area (ha)
1
3
Acquisition: 7/23/2004 Acquisition: 4/21/2005 Acquisition: 7/10/2005
[image:50.595.95.510.73.485.2]Acquisition: 8/11/2005 Acquisition: 10/1/2006 Legend Figure 8. Distribution of NDVI in Karawang district.
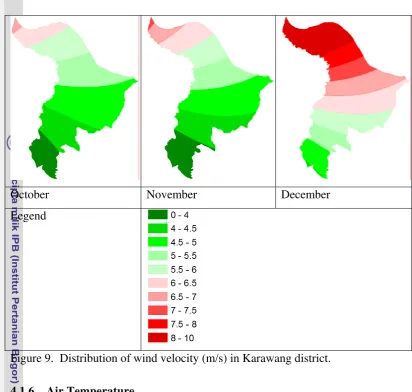
4.1.5. Wind Velocity
Southern area of Karawang district is high land with air pressure higher than the northern area.
January February March
April May June
October November December Legend
Figure 9. Distribution of wind velocity (m/s) in Karawang district.
4.1.6. Air Temperature
January February March
April May June
October November December Legend
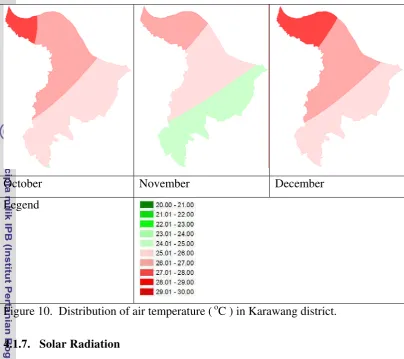
Figure 10. Distribution of air temperature ( oC ) in Karawang district.
4.1.7. Solar Radiation
4.1.8. Net Radiation
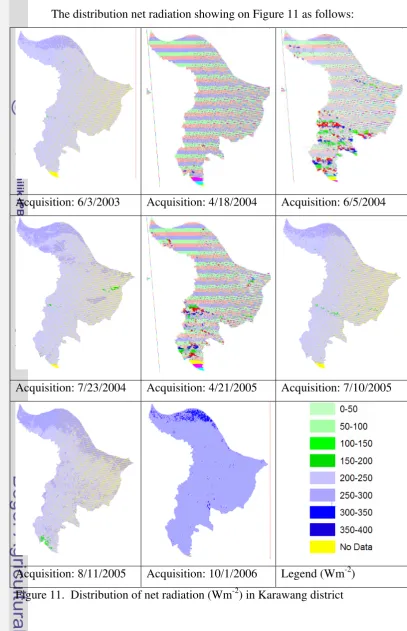
The distribution net radiation showing on Figure 11 as follows:
Acquisition: 6/3/2003 Acquisition: 4/18/2004 Acquisition: 6/5/2004
Acquisition: 7/23/2004 Acquisition: 4/21/2005 Acquisition: 7/10/2005
[image:55.595.98.506.105.737.2]Net radiation is calculated based on position of latitude and time of Julian day. Total net radiation is shown in Table 9.
Table 9. Total net radiation in Karawang district
6/3/2003 4/18/2004 6/5/2004 7/23/2004 4/21/2005 7/10/2005 8/11/2005 10/1/2006
0-50 0 0 0 0 0 0 0 0
50-100 0 0 156 0 0 0 0 0
100-150 23 40 6,014 7 1,187 121 273 0
150-200 181 415 6,923 676 7,719 739 658 6
200-250 160,020 2,876 146,872 144,047 34,338 155,413 119,073 257
250-300 11,995 169,079 12,893 28,689 131,469 15,098 52,908 187,332
300-350 0 1,167 0 0 1,035 0 0 5,582
350-400 0 0 0 0 0 0 0 0
No Data 21,022 19,664 20,382 19,822 17,493 21,871 20,329 63
Total 193,241 193,241 193,241 193,241 193,241 193,241 193,241 193,241
Rn/ Date Area (ha)
In April Karawang district has net radiation between 250-300 Wm-2, in May-August 200-250 Wm-2 and October 250-300 Wm-2. In October almost all area receive net radiation around 250-300 Wm-2, or 187,000 hectare from total area of Karawang (193000 hectare). Geographically in Karawang district the influence on amount of the net radiation which reaches the land surface is not significant.
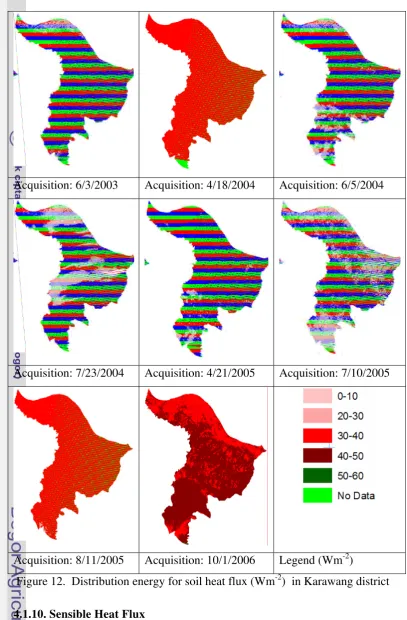
4.1.9. Soil Heat Flux
Soil heat flux distribution is shown in Figure 12. Based on Table 10 it is found that in Karawang district potential energy for soil heating is 30-40 Wm-2, except for the data of October 01, 2006 when total energy used to heat soil is about 40-50 Wm-2 for areas near water body or fish pond and for water body and fish pond it is about 30-40 Wm-2.
Table 10. Area of energy for soil heat flux
6/3/2003 4/18/2004 6/5/2004 7/23/2004 4/21/2005 7/10/2005 8/11/2005 10/1/2006
0-10 445 437 551 496 551 544 501 10
10-20 0 0 84 1,784 0 0 0 2
20-30 12,385 333 29,965 47,818 9,181 71,299 1,085 3
30-40 159,389 172,806 142,259 123,321 166,016 99,527 171,327 65,900
40-50 0 1 0 0 0 0 0 127,263
50-60 0 0 0 0 0 0 0 0
No Data 21,022 19,664 20,382 19,822 17,493 21,871 20,329 63
Total 193,241 193,241 193,241 193,241 193,241 193,241 193,241 193,241 Soil /
Date
Acquisition: 6/3/2003 Acquisition: 4/18/2004 Acquisition: 6/5/2004
Acquisition: 7/23/2004 Acquisition: 4/21/2005 Acquisition: 7/10/2005
Acquisition: 8/11/2005 Acquisition: 10/1/2006 Legend (Wm-2)
Figure 12. Distribution energy for soil heat flux (Wm-2) in Karawang district
4.1.10. Sensible Heat Flux
[image:57.595.100.508.74.695.2]about 100-150 Wm-2. Except data in October 01, 2006 where total energy used is higher than the other data about 100-200 Wm-2. The dry months before October 2006 is long i.e. about 4-5 months, therefore the total energy used to heat air is high.
Acquisition: 6/3/2003 Acquisition: 4/18/2004 Acquisition: 6/5/2004
Acquisition: 7/23/2004 Acquisition: 4/21/2005 Acquisition: 7/10/2005
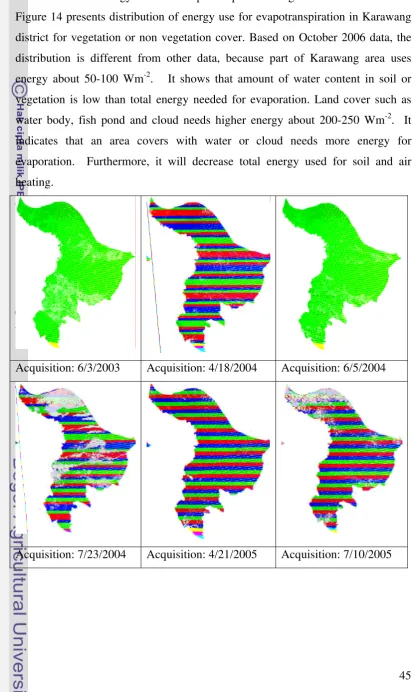
4.1.11. Evapotranspiration
[image:59.595.98.513.123.816.2]The total energy used for evapotranspiration ranged from 100-200 Wm-2. Figure 14 presents distribution of energy use for evapotranspiration in Karawang district for vegetation or non vegetation cover. Based on October 2006 data, the distribution is different from other data, because part of Karawang area uses energy about 50-100 Wm-2. It shows t