Urea treated cocoa pod as barley grain substitution in ruminant ration on
microbial metabolism and feed degradation (Rusitec Study)
Despal1 and Abel, H2.
1) Dept. Animal Nutrition and Feed Technology, IPB, Indonesia. Jl. Agatis Kampus IPB Darmaga 16680 Bogor, Indonesia. Phone: ++62-251-7130310, email: [email protected] 2) Institute for Animal Nutrition and Animal Physiology, Georg-August University, Goettingen,
Germany.
Abstract
Limited sustainable supply of high quality feedstuff is the major constrain in ruminant production in most of tropical countries. Aim to convert underutilized cocoa pod to quality feedstuff and its inclusion in ruminant ration have been done. Cocoa pod was treated with 20 g urea per kg fresh material. The effects of replacing barley grain by urea treated cocoa pod on methane release, SCFA production as well as the amount and efficiency of microbial-N fixation in Rusitec have been studied. The experiment included six different rations (T1 = 10 g/d hay; T2 = T1 + 4 g/d barley-soybean mixture (barley); T3 = T1 + 3 g barley + 1 g cocoa pod); T4 = T1 + 2 g barley + 2 g cocoa pod; T5 = T1 + 1 g barley + 3 g cocoa pod and T6 = T1 + 4 g cocoa pod) and three running of Rusitec in a block random design. Substitution of barley by urea treated cocoa pod up to 100% in hay based rations did not decrease the rate of ration DM disappearance, and fiber degradation even tended to be increased. Microbial N-fixation decreased with the inclusion of cocoa pod in the rations, but the efficiency of microbial N-fixation was increased in line with the cocoa pod level. Methane release per unit NDF disappearance decreased inversely to the cocoa pod level. Urea treated cocoa pod cannot replace barley/soybean meal-mixture equivalently, but can be used as a feedstuff for low performance ruminants.
Keywords: Methane, microbial protein, ruminant, Rusitec, urea treated cocoa pod
Introduction
Background
Cocoa pod is a potential feed source for ruminants. Their availability increase inline with the escalation of world-wide cocoa demand. ICCO (2003) reported of 3 million tons world cocoa seed production which released about 6 million tons of cocoa pod meal (a 1 to 2 cocoa bean to cocoa pod meal ratio (DUKE, 1983)). Cocoa pods is quite palatable, however its utilisation by ruminant is limited according to low protein content and high cell wall constituents. As a late-maturing plant component, the pod contains high lignocellulosic and low non-polysaccharide substances. To be used as ruminant feedstuff, cocoa pod needs quality upgrading.
applied by CHENOST (2001) for rice straw equivalent to 5.3 kg urea per 100 kg DM or WILLIAMS et al. (1984) who applied 4 kg urea per 100 kg barley straw, it seems necessary to test the possible toxicity of urea treated cocoa pod in a more physiological rumen model such as Rusitec. A too high consumption of dietary urea would however be toxic for the animal (HELMER & BARTLEY, 1971; BARTLEY & DEYOE, 1981; VAN SOEST, 1982).
According to SMITH (1974), urea toxicity can be minimized by ensuring an adequate matched supply of available energy instead of replacing urea with more expensive NPN sources. In this study, the urea treated cocoa pods were mixed with different amounts of barley as an energy source and constant amounts of these mixtures were combined with constant amounts of hay in Rusitec.
Objectives
The research aimed at investigating the effects of replacing barley/soybean meal-mixture by urea treated cocoa pod in ruminant feed rations on methane release, SCFA production and N-metabolism as well as the efficiency of protein synthesis of rumen microbes. Another objective of this research was to study the effect of the substitution level on rate of disappearance of DM and nutrients from the feed used as substrate in Rusitec.
Material and methods
Urea treated cocoa pod preparation
The cocoa pods (CPs) of AFR (Forastero) cultivar were collected after harvesting the beans. The cocoa trees at the Cikasungka Cocoa Plantation in Bogor-Indonesia were about 20 years old and ranged from 1.5 to 3 m height at the time of the harvest. The cocoa pods were treated with urea (20 g/kg fresh materials or equal to 140 g/kg DM (w/w)).
The treatment was processed manually. Firstly, cocoa pods were sliced into about 2 mm thickness and samples of 2 kg each were weighed. The pods were put into 40 x 50 cm and 0.12 cm thin poly-bags. Urea was added layer by layer in order to achieve homogeneous mixtures. The bag was then pressed to reduce the air contents and sealed with nylon tape. Finally, the bag was stored at room temperature. After 14 days the bag was opened and the contents sun dried (about 18 hours light intensity). The dried material was then ground with a laboratory bur mill to pass a 0.5 mm sieve for further analyses.
Experimental ration
The experiment was conducted in rumen simulation technique fermenters. The fermenters were supplied with 10 g of hay without or with 4 g of concentrate daily. Barley grain enriched with extracted soybean meal (to achieve the same crude protein (CP) content as urea treated cocoa pod) was used as standard concentrate. The standard concentrate was gradually replaced with increasing levels of treated cocoa pod.
The resultant six treatments were (T1 = 10 g/d hay; T2 = T1 + 4 g/d barley-soybean mixture (barley); T3 = T1 + 3 g barley + 1 g cocoa pod); T4 = T1 + 2 g barley + 2 g cocoa pod; T5 = T1 + 1 g barley + 3 g cocoa pod and T6 = T1 + 4 g cocoa pod. The nutritional composition of the feed components is shown in Table 1. The daily amounts of the different feed components supplied to six fermenters in Rusitec and their chemical composition are shown in Table 2.
The study was conducted in Rusitec fermenters following the procedure which has been developed by CZERKAWSKI & BRECKENRIDGE (1977). The trial was repeated three times (3 replications) with 6 fermenters for each run. Each run lasted 14 days including day 0 to day 9 as preliminary phase and day 10 to 14 as the collecting phase. The Rusitec procedure is explained below:
Water bath and fermenter. Water bath was set at 39oC using a thermostat heater. Water circulated through a circulating pump. The water bath contained 6 fermenters. Each fermenter had a volume of 1060 ml and was filled with 690 ml rumen fluid which was collected from two rumen fistulated steers. A nylon bag containing 80 g of rumen solid fraction was introduced into a covered bottle at day 0 together with two bags containing hay and concentrate respectively. The cover and the bottom of the bottle had several holes to allow free fluid movement when introduced into the cylindrical fermenter. The bottle cover was connected to a wheel allowing an automatic stroke frequency of the bottle of about 400 times per hour. The fermenter was filled with buffer and closed. Nitrogen gas was blown for about 2 minutes to pull oxygen out and to maintain anaerobic conditions. The overflow of the fermenter was connected to a 1000 ml Erlenmeyer containing 1 ml HgCl2. The gas produced was collected in a gas bag.
Buffer (MCDOUGAL, 1948) was pumped continuously using an automatic pump at a flow rate of 620 ml/d. The fermenter was maintained under anaerobic conditions by infusing N2 gas each time it was opened. The arrangement of fermenters, pump and thermostat heater in the Rusitec system is shown in Figure 1.
Ration.The daily ration was put into two nylon bags. A 60 m pore size bag was used for concentrate and a 100 m pore size bag for hay. At day 0, the bag containing rumen solid fraction was introduced and removed after 24h. For the rest of experimental period, the fermenters were fed with feed ration only. Each bag containing feed ration was incubated in the fermenter for 48 h. The residual ration in the nylon bag served to calculate the rate of disappearance and was therefore washed with 60 ml buffer which was returned to the fermenter.
15
N infusion. 15N-Urea with 95% enrichment was used as a tracer for the determination of microbial growth. The amount of 0.2259 g (15NH2)2CO was weighed and solved in 100 ml distilled water. Five ml of the solution was added to 5 liters of fresh buffer. The quasi-steady state condition in the fermenters with a nearly constant 15N-concentration of the ammonia pool was achieved after 5 days.
Parameters. Overflow, gas production, pH, redox-potential and NH3 concentration were measured daily. Protozoal counts and gas composition were analyzed every two days during the preliminary phase and daily during the collection phase. The SCFA and 15N-NH3 were analyzed in the overflow samples of the collection phase, while the disappearance rate of the feed ration was measured during the collection phase by analyzing the residual contained in the nylon bag after fermentation.
Rate of disappearance
The DM-disappearance rate of the feed ration was determined by subtracting the residual ration in nylon bags after 48 h of incubation from the amount of ration introduced into the fermenter. The disappearance of OM, CP, CF, NDF and ADF was determined by analyzing the residual solids for crude ash (XA), crude protein (CP) and crude fiber (CF) according to NAUMANN & BASSLER (1997) and for NDF and ADF according to VAN SOEST et al. (1991).
The composition of produced fermentation gas was analyzed by gas chromatography (SimadzuGC-8A) in collected gas samples on a packed silica gel column, at 80oC injection port and detector temperature and 40oC column temperature (isothermal), Tdetector (Simadzu C-R1B) and argon as carrier gas (DA COSTA GOMEZ, 1999). Gas samples were taken from the gas bag using a 1 ml syringe.
A standard gas consisting of CO2, N2, CH4 and H2 in the proportions of 65, 30, 4 and 0.9% respectively was used. The peak of graph was achieved at the 2nd minute for H2, after 2.85 minutes for N2, 3.89 minutes for CH4 and 20.95 minutes for CO2.
Short chain fatty acid (SCFA)
A 10 ml sample of the effluent was centrifuged in a Martin Christ centrifuge (Type UJ 1S) for 10 minutes at 3900 g. The supernatant was separated from the sediment. An internal standard
solution consisting of 4% 2-methyl valeric acid in formic acid (w/w) was prepared. 250 l of the internal standard solution was mixed with 5 ml supernatant using a vortex. About 1.5 ml of the mixture was transferred to a covered centrifuge cup and centrifuged at 15000 g (Biofuge A,
Heraues Sepatech) for 10 minutes. The amount of 1.4 l of the centrifuged sample was injected to GC using a 10 l syringe.
SCFA was detected using a gas chromatograph (GC-14B, Simadzu) equipped with a packed column (10% Carbowax 20 MTPA SP 1000 with 1% H3PO4 on Cromosorb WAW 80/100) and flame ionization detector connected to a chromato-integrator (D-2000 Merck-Hitachi). H2 at 120 kPa pressure served as carrier gas. The injection oven temperature was set at 170oC while the column and detector temperatures were set at 120oC and 220oC respectively.
The peak curve was measured after a retention time (min) of approximately 3.33 for C2 (acetate), 4.90 for C3 (propionate), 5.66 for iC4 (iso-butyrate), 7.51 for nC4 (butyrate), 9.23 for iC5 (iso-valerate), 12.73 for nC5 (valerate) and 14.64 for the internal standard.
Additionally to the internal standard, an external standard was also used which consisted of (mol/ml) 30 acetic acid, 20 propionic acid, 1 iso-butyric acid, 10 butyric acid, 2 iso-valeric acid and 3 valeric acid. To determine the concentration of SCFA, a combined internal/external standard procedure was applied.
Microbial protein synthesis (MPS)
Microbial protein synthesis (MPS) was determined by the continuous infusion technique applying 15N-urea as a tracer (ABEL et al., 1990). Three drops of silicon oil (anti foam), 8 drops of Thymolphthalein (2% in ethanol solution) or methyl red, 10 ml boric acid buffer (in 1 N KCl solution adjusted with 1 N KOH to pH 9.5) and 4.5 ml 1N KOH were added to 100 ml effluent (pooled 10% collection phase overflow samples). The solution was distilled and the distillate collected in a beaker glass containing 0.1 N H2SO4. Basically 0.1 N H2SO4 would be enough to bind the NH3 released. The amount of 0.1 N H2SO4 needed to bind NH3 was calculated as the concentration of NH4-N/100 ml sample divided by 1.401 plus 1 ml. The beaker volume was filled to 40 ml with distilled water. The distillation process was terminated when 200 – 250 ml of distillate were collected which occurred in approximately 12 minutes.
solution was transformed into a tin cup and further dried at 105oC. The cup was then formed to a small pellet and placed into a pallet. The pellets were analyzed for 15N enrichment by means of a mass spectrometer (Finnigan MAT Delta C, Bremen, connected to an elemental analyzer, Fisons 1108 Rodano, Milano).
Assuming steady state conditions, microbial nitrogen was derived according to equation: Microbial N (mg/d) = ri x ((si/sp) – 1), where r = infusion rate (mg/d), si = 15N-excess in infusion, sp = 15N-excess in NH4-N pool. Microbial protein synthesis (MPS) in mg/d can be calculated as microbial-N divided by (8/100), assuming 8% N in microbial cells (CZERKAWSKI, 1986). The efficiency of microbial protein synthesis (EMPS) is calculated according to EMPS (mg/g OMAD) = MPS/OMAD, where OMAD is organic matter apparently degraded.
Experimental design and statistical analysis
The trial had a randomized block design with 6 rations in 6 fermenters as treatments and 3 runs as block. The linear model used for the analysis was: Yij = + i jij, where, Yij is the observation value of ration i and run j, is the overall mean of observations, i is the additive effect of ration i, j is the effect of run j and ij is experimental error of ration i and run j.
Results
Fermentation characteristics
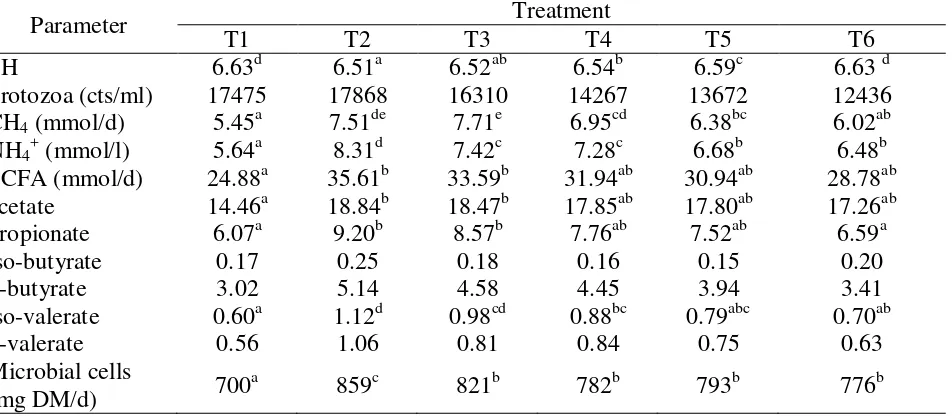
The effect of replacing the barley/soybean meal-mixture with urea treated cocoa pod on fermentation in Rusitec is shown in Table 3. There was a significant decrease in pH due to the addition of concentrate (T2 – T5). However, the substitution of barley/soybean meal-mixture by treated cocoa pod resulted in a gradual increase in pH at a rate that was nearly proportional to the increased cocoa pod proportion in the ration (T3 – T6). A 100% replacement of barley/soybean meal-mixture by urea treated cocoa pod resulted in a pH similar to that in T1 with hay as the sole substrate.
Addition of concentrate (barley/soybean meal-mixture) to hay based ration (T2) tended to increase protozoal counts. Replacing the concentrate with urea treated cocoa pods, however, reduced the protozoal counts inversely to the cocoa pod level below the value of T1. Methane production was significantly increased by the addition of concentrate (T2 – T5). The increment could be reduced to the T1 level by replacing 100% concentrate with urea treated cocoa pods (T6).
Although ammonium production was decreased by the replacement of barley/soybean meal-mixture with urea treated cocoa pods (T3 – T6), the level was still higher than T1. Total and partial SCFA production showed the same trend (significantly or just by tendency). Addition of concentrate (T2 – T6) increased the values compared to the pure hay ration T1. Replacement of barley/soybean meal-mixture with urea treated cocoa pod (T3 – T6) decreased the production inversely to the cocoa pod level and approached the T1 level at the 100% substitution (T6).
Microbial cell production was also enhanced by the addition of concentrate (T2 – T6). However, urea treated cocoa pod (T3 – T6), resulted in lower increment compared to the barley/soybean meal-mixture, T2.
Development during Rusitec
preliminary phase (day 0 – 9) and then stabilized during the collecting phase (day 10 – 14). Ammonium production also showed the same trend and ranged from 4.8 – 9.0 mmol/l. The number of protozoa decreased with increasing time. The average count of protozoa at day 0 was about 50000/ml and was reduced to a tenth in the collection phase.
Rate of disappearance
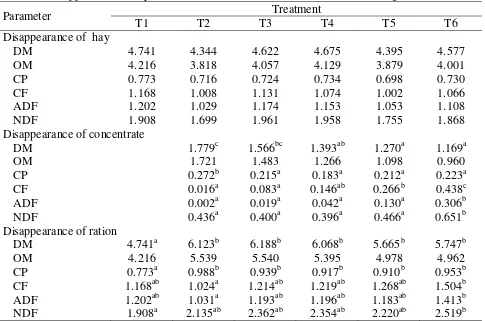
The rate of disappearance of DM and nutrients is shown in Table 4. There were no significant differences in hay disappearance between the treatments. The disappearance of DM of concentrate T3 (substitution of 25% barley/soybean meal-mixture by urea treated cocoa pod) was not significantly different from that in T2, however, increasing the proportion of urea treated cocoa pod (T4 – T6) resulted in a gradual decrease in DM disappearance. The OM disappearance of concentrate also tended to decrease with increasing amounts of cocoa pod, while the disappearance of CP decreased significantly when barley/soybean meal-mixture was partially or completely replaced by cocoa pod. The fiber fractions of concentrate disappeared in most cases in higher amounts with the cocoa pod containing rations.
The disappearance of DM and CP of the total feed ration increased compared to the pure hay ration (T1) when concentrate regardless of substitution level was added. There was no clear effect of the substitution level on fiber disappearance. The hay/cocoa pod concentrate 0-ration (T2) showed significantly lower crude fiber and ADF disappearance than the hay/cocoa pod concentrate 100-ration (T6), whereas, the lowest NDF disappearance was observed for the pure hay ration T1.
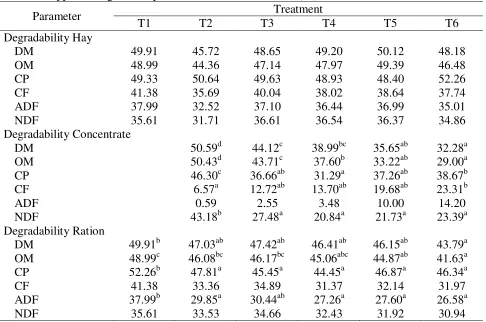
The proportions of the disappeared DM and nutrients (apparent degradability) are shown in Table 5. There were no significant differences in hay degradability between treatments. The inclusion of urea treated cocoa pod decreased the degradability of DM, OM, CP and NDF of the concentrate whereas it was increased for CF and ADF.
The substitution of up to 75% barley/soybean meal-mixture by cocoa pod (T5) did not significantly decrease the degradability of DM and OM of the ration. The substitution of 100% barley/soybean meal-mixture did not affect the degradability for CP, CF, ADF and NDF of the feed ration. Compared to pure hay (T1), the addition of concentrate decreased the degradability of the total rations.
Discussion
The ammonium concentration in the liquid phase (4.8 - 9.0 mmol/l) and the pH (6.4 - 6.8) during the experiments showed that the conditions in the fermenters were within the physiological range for rumen microbes (SATTER & SLYTER, 1974; MCDONALD et al., 1995). However, the counts of protozoa in the rumen fluid (4x10⁴ - 6x10⁴ per ml) were less than is usual for the normal rumen physiology where up to 10x106 protozoa per ml may be expected (MCDONALD, et al., 1995). The protozoa were even decreased in Rusitec to about 5000 counts/ml during the collection phase. Apart from methodological reasons associated with the discrepancy between protozoal generation interval and substrate exchange, the survival of only one tenth of the initial introduced protozoa during the collection phase might also have been caused by the restricted substrate available for protozoa when high fiber diets are used (WELLER & PILGRIM, 1974; COLEMAN et al., 1980).
fermented (mol/d) = (A + P)/2 + B + V, where A is acetate, P is propionate, B is butyrate and V is valerate expressed in mol/d respectively. The amount of hexose fermented (g/d) is calculated as 162 x HF. The fermentation of 100 g carbohydrate (hexose) is assumed to result in the synthesis of 30 g microbial cells (MC; BERGNER & HOFMANN, 1996). MC synthesis measured for the different treatments was similar to those theoretically calculated on the basis of HF.
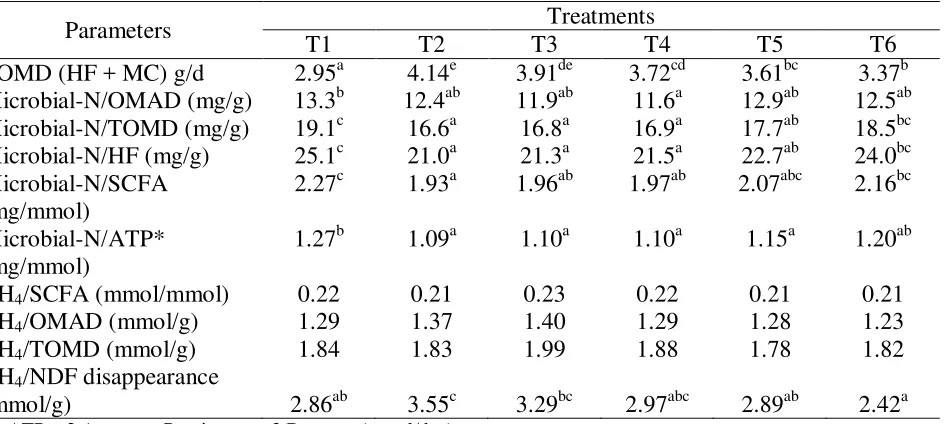
The efficiency of microbial metabolism depends on the amount of microbial cells as well as the amounts of methane per unit of fermented substrate. It can be expressed in different terms. Calculated values of microbial N in relation to organic matter apparently degraded (OMAD), to truly digested organic matter (TOMD = truly degraded organic matter), to hexose fermented, to SCFA and to ATP are shown in Table 7. The highest efficiencies for microbial growth can be stated for the pure hay ration (T1). Addition of barley (T2) led to a significant reduction in EMPS, whereas the replacement of increasing barley/soybean meal-mixture by urea treated cocoa pod caused a slight recovery of EMPS and reaching almost similar to T1 values at replacement of 100% barley with cocoa pod (T6).
With the exception of methane per unit NDF disappearance, the methane release remained unaffected by the different treatments. However, less methane was produced per unit NDF disappearance when 100% cocoa pod concentrate (T6) was supplied to the fermenters instead of 0% (T2), 25% (T3), and 50% (T4) cocoa pod concentrates. It may also be noted that the lower amounts of produced microbial protein observed when cocoa pod containing concentrates served as the substrate, were associated with a slightly but not significantly increase in EMPS.
Conclusions
It was found that the substitution of barley/soybean meal-mixture by urea treated cocoa pod up to 100% in hay based rations did not decrease the rate of ration DM disappearance, and fiber degradation even tended to be increased. Even though the microbial N-fixation decreased with the inclusion of cocoa pod in the rations, the efficiency of microbial N-fixation was increased in line with the cocoa pod level. Methane release per unit NDF disappearance decreased inversely to the cocoa pod level.
List of References
ABEL, HJ.; COENEN, G.; IMMIG, I., 1990: Untersuchungen zum Einfluß von Fett- und Stärkezulagen auf den mikrobiellen Stoffwechsel im Pansensimulationssystem RUSITEC. J. Anim. Physiol. Anim. Nutr. 64, 62 – 73.
BERGNER, H.; HOFMANN, L., 1996: Bionergetik und Stoffproduktion Landwirtschaftlicher Nutztiere. Harwood Academic Publishers. Singapore.
CHENOST, M., 2001: Optimizing the use of poor quality roughages through treatments and supplementation in warm climate countries with particular emphasis on urea treatment. http://www.fao.org/ag/AGA/AGAP/FRG/ECONF95/HTML/CHENOST.HTM.
COLEMAN, G.S.; DAWSON, R.M.C.; GRIME, D.W., 1980: The rate of passage of ciliate protozoa from the ovine rumen. Proc. Nutr. Soc. 39, 6.
CZERKAWSKI, J.W., 1986: An Introduction to Rumen Studies. Pergamon Press, Oxford.
CZERKAWSKI, J.W.; BRECKENRIDGE, G. 1977. Design and development of a long-term rumen simulation technique (rusitec). British J. Nutr. 38, 371 – 374.
DA COSTA GOMEZ, C., 1999: In-vitro-Unterschungen zur reduktiven Acetogenese im Pansen. Diss.agr.Göttingen, pp. 18 - 25.
DEMEYER, D.I.; VAN NEVEL, C.J., 1975: Methanogenesis, an integrated part of carbohydrate fermentation and its control. In: McDonald, I.W.; Warner, A.C.I. (Eds.), Digestion and Metabolism in the Ruminant. University of New England Publishing Unit. Armidale. pp. 366 – 382.
DEMEYER, D.I.; WOESTYNE, M.V.; PRINS, R., 1995: Mikrobiologie der Verdauung. In: ABEL, HJ.; MOLNAL, S.; FLACHOWSKY, G.; JEROCH, H., (Eds.): Nutztierernährung: Potentiale – Verantwortung – Perspektiven. Gustav Fischer Verlag. Jena, 18 – 206.
HELMER, L.G.; BARTLEY, E.E., 1971: Progress in the utilization of urea as a protein replacer for ruminants. J. Dairy Sci. 54, 25 – 51.
MCDONALD, P.; EDWARDS, R.A.; GREENHALGH, J.F.D.; MORGAN, C.A., 1995: Animal Nutrition 5th ed. Pearson Education Limited, Edinburgh Gate, Harlow.
MCDOUGAL, E.I. 1948: Studies on ruminant saliva I. The composition and output of sheep’s saliva. Biochem. J. 43, 99 – 109.
NAUMANN, C.; BASSLER, R., 1997: VDLUFA-Methodenbuch Band III, Die chemische Untersuchung von Futtermitteln. 3rd ed. VDLUFA-Verlag, Darmstadt, Germany.
VAN SOEST, P. J.; ROBERTSON, J.B.; LEWIS, B.A., 1991: Methods for dietary fiber, neutral detergent fibre and non-starch polysaccharides in relation to animal nutrition. J. Dairy Sci. 74, 3583 – 3597.
WELLER, R.A.; PILGRIM, A.F., 1974: Passage of protozoa and volatile fatty acids from the rumen of the sheep and from a continuous in vitro fermentation system. British J. Nutr. 32, 341 – 351.
Table 1: Nutritional composition of the feed components
Component DM ASH CP XL CF NDF ADF
% % DM
Hay 93.4 7.92 15.8 1.32 30.2 57.3 33.9
Barley 87.6 2.48 12.7 2.48 7.26 30.8 8.46
Soy bean meal extract. 89.2 7.12 52.2 1.82 4.66 10.6 5.86
Treated cocoa pod 90.5 8.58 15.9 0.74 51.9 76.9 59.4
Table 2: Composition of the feed rations
Ingredients T1 T2 T3 T4 T5 T6
Hay (g) 10 10 10 10 10 10
Barley (g) 0 2.4 1.8 1.2 0.6 0
Soy bean meal
extract.(g)
0 1.6 1.2 0.8 0.4 0
Treated cocoa pod (g) 0 0 1.0 2.0 3.0 4.0
Mineral mix (g) 0.15 0.15 0.15 0.15 0.15 0.15
Nutrient contents
DM (%) 93.5 91.9 92.1 92.3 92.5 92.7
ASH (%DM) 9.73 7.64 8.02 8.40 8.78 9.15
CP (% DM) 15.6 15.9 15.8 15.8 15.7 15.7
XL (% DM) 1.30 1.60 1.49 1.37 1.26 1.14
CF (% DM) 29.7 23.6 26.7 29.8 32.8 35.9
NDF (% DM) 56.4 48.9 52.2 55.5 58.8 62.1
ADF (%DM) 33.3 26.5 30.0 33.6 37.0 40.5
Table 3: Effect of replacing barley/soybean meal-mixture by urea treated cocoa pod on fermentation characteristics in Rusitec
Parameter Treatment
T1 T2 T3 T4 T5 T6
PH 6.63d 6.51a 6.52ab 6.54b 6.59c 6.63 d
Protozoa (cts/ml) 17475 17868 16310 14267 13672 12436
CH4 (mmol/d) 5.45a 7.51de 7.71e 6.95cd 6.38bc 6.02ab
NH4+ (mmol/l) 5.64a 8.31d 7.42c 7.28c 6.68b 6.48b
SCFA (mmol/d) 24.88a 35.61b 33.59b 31.94ab 30.94ab 28.78ab
acetate 14.46a 18.84b 18.47b 17.85ab 17.80ab 17.26ab
propionate 6.07a 9.20b 8.57b 7.76ab 7.52ab 6.59a
iso-butyrate 0.17 0.25 0.18 0.16 0.15 0.20
n-butyrate 3.02 5.14 4.58 4.45 3.94 3.41
iso-valerate 0.60a 1.12d 0.98cd 0.88bc 0.79abc 0.70ab
n-valerate 0.56 1.06 0.81 0.84 0.75 0.63
Microbial cells
(mg DM/d) 700
a
Table 4: Disappearance of dry matter and nutrients of the feed ration in Rusitec (g/d)
Parameter Treatment
T1 T2 T3 T4 T5 T6
Disappearance of hay
DM 4.741 4.344 4.622 4.675 4.395 4.577
OM 4.216 3.818 4.057 4.129 3.879 4.001
CP 0.773 0.716 0.724 0.734 0.698 0.730
CF 1.168 1.008 1.131 1.074 1.002 1.066
ADF 1.202 1.029 1.174 1.153 1.053 1.108
NDF 1.908 1.699 1.961 1.958 1.755 1.868
Disappearance of concentrate
DM 1.779c 1.566bc 1.393ab 1.270a 1.169a
OM 1.721 1.483 1.266 1.098 0.960
CP 0.272b 0.215a 0.183a 0.212a 0.223a
CF 0.016a 0.083a 0.146ab 0.266b 0.438c
ADF 0.002a 0.019a 0.042a 0.130a 0.306b
NDF 0.436a 0.400a 0.396a 0.466a 0.651b
Disappearance of ration
DM 4.741a 6.123b 6.188b 6.068b 5.665b 5.747b
OM 4.216 5.539 5.540 5.395 4.978 4.962
CP 0.773a 0.988b 0.939b 0.917b 0.910b 0.953b
CF 1.168ab 1.024a 1.214ab 1.219ab 1.268ab 1.504b
ADF 1.202ab 1.031a 1.193ab 1.196ab 1.183ab 1.413b
Table 5: Apparent degradability of the feed ration in Rusitec (%)
Parameter Treatment
T1 T2 T3 T4 T5 T6
Degradability Hay
DM 49.91 45.72 48.65 49.20 50.12 48.18
OM 48.99 44.36 47.14 47.97 49.39 46.48
CP 49.33 50.64 49.63 48.93 48.40 52.26
CF 41.38 35.69 40.04 38.02 38.64 37.74
ADF 37.99 32.52 37.10 36.44 36.99 35.01
NDF 35.61 31.71 36.61 36.54 36.37 34.86
Degradability Concentrate
DM 50.59d 44.12c 38.99bc 35.65ab 32.28a
OM 50.43d 43.71c 37.60b 33.22ab 29.00a
CP 46.30c 36.66ab 31.29a 37.26ab 38.67b
CF 6.57a 12.72ab 13.70ab 19.68ab 23.31b
ADF 0.59 2.55 3.48 10.00 14.20
NDF 43.18b 27.48a 20.84a 21.73a 23.39a
Degradability Ration
DM 49.91b 47.03ab 47.42ab 46.41ab 46.15ab 43.79a
OM 48.99c 46.08bc 46.17bc 45.06abc 44.87ab 41.63a
CP 52.26b 47.81a 45.45a 44.45a 46.87a 46.34a
CF 41.38 33.36 34.89 31.37 32.14 31.97
ADF 37.99b 29.85a 30.44ab 27.26a 27.60a 26.58a
NDF 35.61 33.53 34.66 32.43 31.92 30.94
Table 6: Stoichiometry of fermentation in Rusitec
Parameter Treatment
T1 T2 T3 T4 T5 T6
Microbial cell (MC) measured in Rusitec (mg/d)
700a 859c 822bc 783b 793b 776b
Hexose Fermented (HF)
HF (mmol/d) 13.9a 20.3e 19.1de 18.1cd 17.4bc 16.0b
HF (g/d) 2.25a 3.28e 3.09de 2.93cd 2.82bc 2.60b
MC calculated from
HF(mg/d) 675
a
Table 7: Efficiency of microbial protein synthesis expressed in different terms
Parameters Treatments
T1 T2 T3 T4 T5 T6
TOMD (HF + MC) g/d 2.95a 4.14e 3.91de 3.72cd 3.61bc 3.37b Microbial-N/OMAD (mg/g) 13.3b 12.4ab 11.9ab 11.6a 12.9ab 12.5ab Microbial-N/TOMD (mg/g) 19.1c 16.6a 16.8a 16.9a 17.7ab 18.5bc
*) ATP = 2 Acetate + Propionate + 3 Butyrate (mmol/day)
Figure 1: Rumen simulation technique instruments