Vol. 17 No. 3, p 115-119 EISSN: 2086-4094
Nursery Culture Performance of
Litopenaeus vannamei
with Probiotics
Addition and Different C/N Ratio Under Laboratory Condition
WIDANARNI∗∗∗∗∗, DEBY YUNIASARI, SUKENDA, JULIE EKASARI
Department of Aquaculture, Faculty of Fisheries and Marine Science, Bogor Agricultural University, Darmaga Campus, Bogor 16680, Indonesia
Received January 4, 2010/Accepted August 18, 2010
Application of bioflocs technology and probiotics has improved water quality and production of Pacific white shrimp (Litopenaeus vannamei) culture. This experiment was to verify the effect of probiotic bacteria addition and different carbon:nitrogen (C:N) ratio on water quality and performance of Pacific white shrimp nursery culture. Nursery culture was carried out for 25 days in an aquarium under laboratory condition with stock density of one Post-Larvae (PL) (poslarval) per liter (24 PL/aquarium) of PL16 shrimp. Different C:N ratio resulted a significant difference on shrimp production performance. Treatment of 10 C:N ratio demonstrated the best shrimp growth (20.37 + 0.48% per day in weight and 6.05 + 0.41% per day in length), harvesting yield (1180 + 62 g/m3) and feed efficiency (121 + 6%). There was however no significant difference observed between treatments in water quality.
Key words: C:N ratio, shrimp, growth, water quality, probiotics
___________________________________________________________________________
http://journal.ipb.ac.id/index.php/hayati DOI: 10.4308/hjb.17.3.115
_________________
∗ ∗∗
∗∗Corresponding author. Phone: +62-251-8628755,
Fax: +62-251-8622941, E-mail: [email protected] INTRODUCTION
The State of World Fisheries and Aquaculture (FAO 2009) reported that shrimp was the largest commodity in term of value, it was 17% of the total value of internationally-traded fishery products in 2006. To meet the demand of this aquaculture product, which continues to increase as the global population increases, shrimp aquaculture are therefore should be increased. The efforts to enhance shrimp production as well as other aquaculture species are however constrained by several factors; one of them is water quality management. Water quality deterioration is one of the most common problems in aquaculture that not only hindered directly the total production but also generating other problems indirectly such as disease transmission.
Waste accumulation is commonly occurred in aquaculture system, in particular intensive systems which applying high density of cultured organism and high input of feed. Crab et al. (2007) illustrated that one hectare of intensive farm may produce organic waste as much as 23,000 IE (Inhabitant Equivalent). The types of wastes produced in aquaculture farms are basically similar, which are dominated by nitrogenous wastes. Differences are usually found in the quality and quantity of waste components which depend on the cultured species and culture practices applied. The wastes in aquaculture farms can be categorized as residual food and fecal matter, metabolic by-products, residues of biocides and biostats, fertilizer derived wastes, wastes produced during molting and collapsing algal blooms (Sharma & Scheeno 1999 in
Anthony & Philip 2006). Waste accumulation in aquaculture system not only affects production itself but
also may pollute the receiving water bodies when this water is discharged without any further treatment. Therefore water quality management is one important point in aquaculture practices. Mc.Intosh et al. (2001) proposed that there are several methods to reduce water quality deterioration in aquaculture system, i.e. (i) reducing nutrient waste by improving feed quality and feeding management; (ii) applying water treatment to reduce waste discharged; and (iii) reducing water volume used for aquaculture activities into zero or minimum water exchange. Limited water volume used for aquaculture will result in the accumulation of organic matter inside the system; therefore this practice should be done simultaneously with water treatment to ensure that the water quality is appropriate for the welfare of the cultured organisms.
Addition of organic carbon to stimulate the growth of heterotrophic bacteria was found to be beneficial to improve water quality in aquaculture system (Avnimelech 1999, 2007; Hari et al. 2006; Crab et al. 2007, 2008; Azim & Little 2008; de Schryver et al. 2008; de Schryver & Verstraete 2009). At a sufficient C:N ratio, heterotrophic bacteria will immobilize inorganic nitrogen, which is the major waste nutrient in aquaculture, and convert it into microbial biomass. This microbial biomass under certain conditions will form bioflocs which further can be utilized by the cultured organisms as supplemental feed. Hence, overall nutrient utilization in the system will be much more efficient (Avnimelech 2007; Samocha et al. 2007; de Schryver et al. 2008).
Probiotics application has been considered to have beneficial effects on aquaculture production. Verschuere
et al. (2000) suggested that a probiotic is defined as a live
enhancing its nutritional value, by enhancing the host response towards disease, or by improving the quality of its ambient environment. Furthermore, the FAO defined the development of affordable yet efficient vaccines, the use of immunostimulants and nonspecific immune enhancers, and the use of probiotics and bioaugmentation for the improvement of aquatic environmental quality as the major areas for further research in disease control in aquaculture (Subasinghe 1997).
The objective of this experiment was to verify the effect of probiotics bacteria addition and different C:N ratio on water quality and production performance of Pacific white shrimp (Litopenaeus vannamei) nursery culture.
MATERIALS AND METHODS
Experimental Treatments and Set-Up. Fifteen units of aquaria (50 x 30 x 25 cm3) were randomly assigned to five
treatments: without probiotics and molasses addition (control), probiotics addition without molasses addition (C:N 0), and three treatments with probiotics bacteria and molasses addition with a different C:N ratio 10, 15, and 20. Molasses (61.45% carbon) was added once a day based on the calculation as described in Avnimelech (1999). Probiotics bacteria mixture applied in this experiment was isolates obtained from previous study (Pranoto 2007) and added at the concentration of 108 CFU/ml every 5 days.
Prior to shrimp nursery culture, aquaria were washed, dried, and filled with water. Calcium hypochlorite (60% chlorine) was subsequently added with a dosage of 100 mg/l for 2 days to sterilize the containers. Afterwards, the water was discharged and the aquaria were subsequently filled with 24 l of filtered seawater. Each aquarium was equipped by aeration line to provide sufficient dissolved oxygen (DO) level. Pacific white shrimp (L. vannamei) postlarvae (PL 16) with an average body weight of 15.39 + 2.31 mg and average length of 1.32 cm was stocked at a density of 1 individual/l (equal to 160 PL/m2). They were fed 5 times a day with commercial
shrimp pellet containing 40% crude protein at a rate based on feeding program provided by the feed company. The experiment was conducted for 25 days without any water replacement (zero water exchange).
In order to monitor water quality and shrimp production performance, sampling was carried out every 5 days. Water quality parameters observed were pH, temperature, dissolved oxygen (DO), nitrite, nitrate, total ammonia nitrogen (TAN), and total plate count. These parameters were measured and determined following “Standard Methods for examination of water and wastewater” (APHA 1998). Whereas shrimp production performance parameters such as survival, growth and feed efficiency were analyzed at the end of the experiment. All data were further analyzed statistically using the one-way ANOVA with SPSS statistical software.
RESULTS
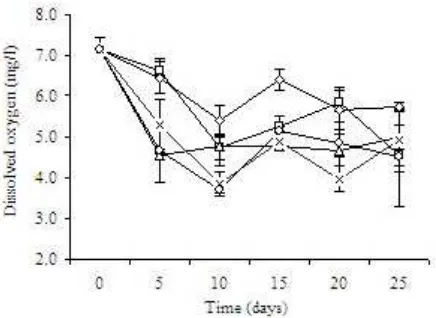
Water Quality. Dissolved oxygen concentration tended to decrease as C:N ratio increased. The highest
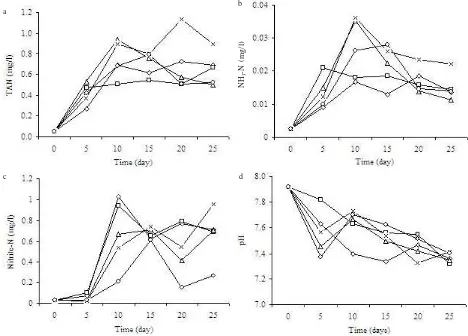
DO concentration of each treatment was noted only on the initial day of culture, and tended to decrease onward (Figure 1). The lowest mean of DO concentration was observed in C:N 20 treatment which was 4.99 + 1.16 mg/l (Table 1). Water pH of all treatments were not differed significantly with a range of 7.52-7.63 (Table 1). There was however a tendency of pH declining observed in all treatment over the culture period (Figure 2). No significant difference was observed in TAN, nitrite-N, nitrate-N, and ammonia-N concentrations amongst treatments (Table 2). Total plate count in water of all treatments tended to increase in time (Figure 3). Although tended to fluctuate in time, TAN and nitrite-nitrogen of all treatment at the end of the experiment was higher than that observed on the initial day (Figure 4).
SGR weight (%/day) SGR length (%/day)
Figure 1. SGR in weight and length of Pacific white shrimp (L.
vannamei) in nursery culture with a different C:N ratio.
SGR weight, SGR length.
Table 1. Mean, minimum and maximum value of pH and DO of water in Pacific white shrimp (L. vannamei) nursery culture with different C:N ratio
Treatment Mean values in the same column with a different superscript are differed significantly (P < 0.05).
Table 2. Mean, minimum and maximum value of TAN, nitrite-nitrogen, nitrate-nitrogen and ammonia-nitrogen of water in Pacific white shrimp (L. vannamei) nursery culture with different C:N ratio
Parameter
TAN Nitrite-N Nitrate-N Ammonia
Min Max Mean + Stdev Min Max Mean + Stdev Min Max Mean + Stdev Min Max Mean + Stdev Treatment
Control C:N 0 C:N 10 C:N 15 C:N 20
0.05 0.05 0.05 0.05 0.05
0.73 0.67 0.94 1.14 0.79
0.50 + 0.28a 0.46 + 0.21a 0.56 + 0.30a 0.69 + 0.40a 0.49 + 0.25a
0.03 0.03 0.03 0.02 0.03
1.03 0.94 0.90 0.96 0.63
0.54 + 0.40a 0.53 + 0.38a 0.43 + 0.33a 0.47 + 0.38a 0.22 + 0.22a
0.09 0.14 0.12 0.18 0.15
0.52 0.52 0.52 0.52 0.52
0.21 + 0.15a 0.25 + 0.14a 0.29 + 0.14a 0.35 + 0.14a 0.34 + 0.14a
0.003 0.003 0.003 0.003 0.003
0.018 0.021 0.035 0.036 0.028
0.012 + 0.006a 0.015 + 0.006a 0.017 + 0.011a 0.020 + 0.012a 0.016 + 0.010a Mean values in the same column with a different superscript are differed significantly (P < 0.05).
Figure 3. Total bacteria count in water in Pacific white shrimp (L.
vannamei) nursery culture with different C:N ratio.
control, C/N 0, C/N 10, C/N 15, C/N 20.
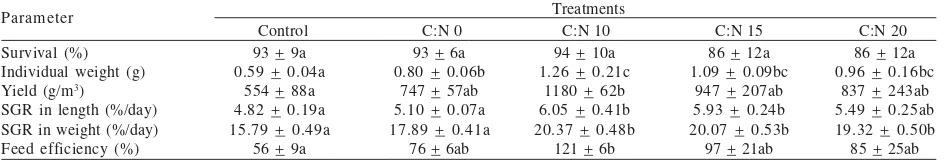
Shrimp Production Performance. Shrimp survival, growth, and feed efficiency at harvest are summarized in Table 3. There was no significant difference in shrimp survival with a range of 83-94%. However, there was a tendency of lower survival when C:N ratio was more than 10. Significant differences were observed on growth and feed efficiency (P < 0.05), where treatment with C:N ratio of 10 revealed the highest value of SGR both in length and weight (6.05 9 + 0.41 and 20.37 + 0.48%/day) and feed efficiency (121 + 6%). Although not differed significantly to other treatment, survival of this treatment was also the highest, i.e. 94 + 10%. Shrimp individual weight and yield at the end of the experiment of treatment C:N 10 were also significantly higher than other treatment.
Figure 4. a. TAN, b. ammonia-nitrogen, c. nitrite-nitrogen, and d. pH profiles of water in Pacific white shrimp (L. vannamei) nursery culture with different C:N ratio. control, C/N 0, C/N 10, C/N 15, C/N 20.
a b
c d
NH
3
DISCUSSION
The tendency of DO reduction over culture period was likely due to the weight gain of shrimp and the enhancement of bacterial population in the cultured water. Nevertheless, the DO in all treatments was still in an optimal range for white shrimp culture. Fast and Boyd (1992) noted that 3 mg/l is a minimum DO standard for shrimp’s good growth, low feed conversion ratio and high survival.
Addition of molasses in this study was aimed to stimulate the growth of heterotrophic bacteria which will be functioned to immobilize inorganic ammonia in the water. Furthermore, Avnimelech (1999) noted that manipulation of C:N ratio is a potential inorganic nitrogen control method for aquaculture systems. In contrast to other study (Samocha et al. 2007), addition of probiotics bacteria and molasses in this experiment apparently did not affect TAN and nitrite-nitrogen profile in cultured water. This might be related to the total N loading into the system, as higher biomass will result in a higher N organic loading. With this respect, the biomass of the treatments with molasses addition was higher than control (Table 3) which further followed by higher feed input and higher amount of waste loaded into the system. The similarity of TAN and nitrite-N profile amongst treatments showed that regardless of higher N organic loaded in treatments with molasses, there was an immobilization process of inorganic N that resulted in TAN and nitrite-N concentration as low as in control. The range of TAN, nitrite-nitrogen, nitrate-nitrogen and ammonia-nitrate-nitrogen were respectively 0.46-0.69, 0.22-0.54, 0.21-0.35, and 0.012-0.020 mg/l. Nevertheless, the level of inorganic nitrogen particularly ammonia observed in this study was in an optimal range aquaculture which must be less than 0.62 mg/l (Stickney 2005). A study by Samocha et al. (2007) showed that nursery culture of white shrimp in raceways with pressurized sand filter with molasses addition resulted in TAN and nitrite-nitrogen of 0.7 and 4.4 mg/l, respectively, which were higher than what has been observed in this experiment.
Hargreaves (1998) pointed out that heterotrophic bacteria could assimilate inorganic nitrogen at a rate of approximately 40 times higher than nitrification bacteria. The presence of nitrite-nitrogen and nitrate-nitrogen in all treatments including the treatments with molasses addition suggesting that there might be a process of nitrification occurred. Un-ionized ammonia concentration
(NH3) was fluctuated in time and more likely related to pH fluctuation as ammonia will be converted to ionized ammonia (NH4+) at high pH (> 7) (Ebeling et al. 2006).
At the end of the experiment, total bacteria count of treatments C:N 15 and 20 were significantly higher than other treatments (P < 0.05). This might be related to the fact that higher C:N ratio favor the growth of heterotrophic bacteria (Avnimelech 1999; Ebeling et al. 2006; Samocha
et al. 2007). Burford et al. (2003) noted that C:N ratio
enhancement in white shrimp pond culture increases the total bacteria count in water. Whereas other study in catfish culture showed that addition of molasses at a C:N ratio of 15 resulted in two log units higher total bacteria count than control (Rohmana 2009). There was no significant difference of total bacteria count between treatment without (control) and with probiotics addition (C:N 0) suggesting that this treatment has no effect on bacterial density in water.
Addition of probiotics bacteria significantly influenced individual weight of shrimp at the end of the experiment. Verschuere et al. (2000) noted that probiotics application in aquaculture may improve aquaculture production performance with various mode of action including improving food digestion and water quality. Addition of molasses apparently affected shrimp individual weight at harvest and growth. However, there was a tendency that more addition of molasses to increase C:N ratio more than 10 did not result in a better performance. In general, even though not differ significantly in water quality, treatment C:N 10 resulted in an outstanding production performance in comparison to other treatments. This indicates that addition of probiotics and molasses at C:N ratio 10 favor the growth of the shrimp. This result was in contrast to previous study by Samocha et al. (2007) that addition of molasses did not result in a significant different in shrimp growth performance at nursery stage.
Addition of organic carbon source resulted in a significantly better growth performance of Pacific white shrimp (L. vannamei) in particular at a C:N ratio of 10. Individual weight at harvest and feed efficiency of shrimp in this treatment was more than 2 fold higher than control (P < 0.05). The effect of carbon source addition on shrimp growth performance was more significant than probiotics addition. The effect of probiotics, which was shown by the comparison of control and C:N 0 treatments, was revealed significantly only in shrimp individual weight at harvest. On the other hand, there was no significant difference observed in water quality parameters. Table 3. Pacific white shrimp (L. vannamei) nursery production performance with different C:N ratio
REFERENCES
Anthony SP, Philip R. 2006. Bioremediation in shrimp culture systems. Naga, World Fish Center Quarterly 29:62-66. APHA. 1998. Standard methods for the examination of the water
and wastewater. 22nd ed. Washington: American Public Health
Association.
Avnimelech Y. 1999. Carbon/nitrogen ratio as a control element in aquaculture systems. Aquaculture 176:227-235.
Avnimelech Y. 2007. Feeding with microbial flocs by tilapia in minimal discharge bio-flocs technology ponds. Aquaculture
264:140-147.
Azim ME, Little DC. 2008. The biofloc technology (BFT) in indoor tanks: Water quality, biofloc composition, and growth and welfare of Nile tilapia (Oreochromis niloticus).
Aquaculture 283:29-35.
Burford MA, Thompson PJ, McIntosh RP, Bauman RH, Pearson DC. 2003. Nutrien and microbial dynamics in high-intensity, zero exchange shrimp ponds in Belize. Aquaculture 219:393-411.
Crab R, Avnimelech Y, Defoirdt T, Bossier P, Verstraete W. 2007. Nitrogen removal in aquaculture towards sustainable production. Aquaculture 270:1-14.
Crab R, Kochva M, Verstraete W, Avnimelech Y. 2008. Bio-flocs technology application in over-wintering of tilapia. Aquac Eng 40:105-112.
de Schryver P, Crab R, Defoirdt T, Boon N, Verstraete W. 2008. The basics of bio-flocs technology: The added value for aquaculture. Aquaculture 277:125-137.
de Schryver P, Verstraete W. 2009. Nitrogen removal from aquaculture pond water by heterotrophic nitrogen assimilation in lab-scale sequencing batch reactors. Bioresource Technology
100:1162-1167.
Ebeling JM, Timmons MB, Bisogni JJ. 2006. Engineering analysis of the stoichiometry of photoautotrophic, autotrophic and heterotrophic removal of ammonia-nitrogen in aquaculture sistems. Aquaculture 257:346-358.
Fast AW, Boyd CE. 1992. Water circulation, aeration and other management practices. In: Fast AW, Lester LJ (Ed).
Development in Aquaculture and Fisheries Science. NY:
Elsevier. p 457-495.
[FAO] Food and Agriculture Organization. 2009. The state of world fisheries and aquaculture 2008. Rome: FAO.
Hargreaves JA. 1998. Nitrogen biogeochemistry of aquaculture ponds. Aquaculture 166:181-212.
Hari B, Kurup BM, Varghese JT, Schrama JW, Verdegem MCJ. 2006. The effect of carbohydrate addition on water quality and the nitrogen budget in extensive shrimp culture sistems.
Aquaculture 252:248-263.
McIntosh D, Samocha TM, Jones ER, Lawrence AL, Horowitz S, Horowitz A. 2001. Effects of two commercially available low-protein diets (21 and 31%) on water and sediment quality, and on the production of Litopenaeus vannamei in an outdoor tank system with limited water discharge. Aquac Eng 25:69-82.
Pranoto SH. 2007. Isolasi dan seleksi bakteri nitrifikasi dan denitrifikasi sebagai agen bioremediasi pada pemeliharaan udang vaname Litopenaeus vannamei [Skripsi]. Bogor: Departemen Budidaya Perairan, Fakultas Perikanan dan Ilmu Kelautan, Institut Pertanian Bogor. p 64.
Rohmana D. 2009. Konversi limbah budidaya ikan lele, Clarias
sp. Menjadi biomasa bakteri heterotrof untuk perbaikan kualitas air dan makanan udang galah, Macrobrachium
rosenbergii [Thesis]. Bogor: Institut Pertanian Bogor.
Samocha TM, Patnaik S, Speed M, Ali AM, Burger JM, Almeida RV, Ayub Z, Harisanto M, Horowitz A, Brock DL. 2007. Use of molasses as carbon source in limited discharge nursery and grow out sistems for Litopenaeus vannamei. Aquac Eng
36:184-191.
Stickney RR. 2005. Aquaculture: An introductory text. Cambridge, USA: CABI Publ. p 256.
Subasinghe R. 1997. Fish health and quarantine. In: Review of the state of the world aquaculture. Rome: FAO Fisheries circular no. 886. FAO. p 45-49.
Verschuere L, Rombaut G, Sorgeloos P, Verstraete W. 2000. Probiotic bacteria as biological control agents in aquaculture. Microbiol