PREDICTION OF THE EROSION AND SEDIMENTATION RATE
USING SWAT MODEL IN KEDUANG SUB-WATERSHED
WONOGIRI REGENCY
Prima Nugroho
1, Yuli Priyana
1, Sigit Haryadi
2 1Universitas Muhammadiyah Surakarta, Faculty of Geography
2
Watershed Management Agency
[email protected]
Abstract
Increased rate of erosion and sedimentation undeniably will bring degradation to the affected
area, particularly in the watershed ecosystem. This problem, however, can be reduced by
applying a proper watershed management, especially in the upstream. Watershed management
would be carried out based on analysis of the watershed performance. A hydrological model
frequently used to determine the impact of the landuse and physical environmental conditions on
the rate of erosion and sedimentation spatially and temporally is Soil Water Assessment Tool
(SWAT), This research aimed: (1) to determine the accuracy of the monthly model simulation
and, (2) to analyze the rate of erosion and sedimentation in Keduang sub-watershed. The
statistical method used to test the model was Nash-Sutcliffe efficiency (NS) and the coefficient of
determination. Result of model validation obtained value of R
2= 0.79 and NS = 0.41. The area
with a high erosion rate was as much as 17,950.75 ha (51.22%) and very high erosion rate was
7,771.25 ha (22.17%). Average of sedimentation rate in the outlet of Keduang sub-watershed,
which was retrieved from the simulation in 2011-2014, was 408.19 tons/ha/year.
Keywords: Erosion, Keduang sub-watershed, sedimentation, SWAT.
Presenting Author’s biography
1.
Introduction
Erosion is evidenced to affect the environment, not only limited on the offsite area, but it also potential to extend to the onsite area. In addition, the impact of erosion is higher in the watershed areas. Its direct impact ranged from decreasing levels of soil fertility, narrowing of productive agricultural land and forestry, and expanding the number of critical land. Meanwhile, its indirect impacts comprise the chemical pollution from fertilizers and pesticides as well the degradation of water quality as surface water due to the process of sedimentation (Nugroho,S.P et.al., 2002). In this context, watershed management activities which carried out generally to control or reduce the rate of sediment due to losses of the sedimentation process was much greater than benefits (Asdak, 2001).
Keduang river is the largest contributor of sediment erosion as 33% from the total sedimentation in Gajah Mungkur (Rahman, 2012) comes from this river. According to (Maridi, 2012), ecosystem condition of the catchment area of Bengawan Solo watershed, particularly the upstream of Keduang sub-watershed endures severe degradation. The amount of sediment from Keduang sub-watershed is 1,218,580 m3/year
in which total sediment in Wonogiri reservoir is 3,178,510 m3/year. Keduang sub-watershed is dominated
by the hills with the slope of > 30%, located in high rainfall areas with the domination of latosol soil types which prone to erosion, and poor conservation facilities. This condition, however, worsens the level of land average loss which reaches 5,112 tons/year (Maridi, 2012).
SWAT is developed to predict the impact of land management practices on water, sediment and agricultural chemical yields in large complex watershed with varying soils, land-use and management conditions over long periods of time (Neitsch, S.L et.al, 2005). Based on the background, this study aimed to conduct further assessment on the rate of erosion and sedimentation and to determine the ability of SWAT model to predict the rate of erosion and sedimentation Keduang sub-Watershed.
2.
Material and Methods
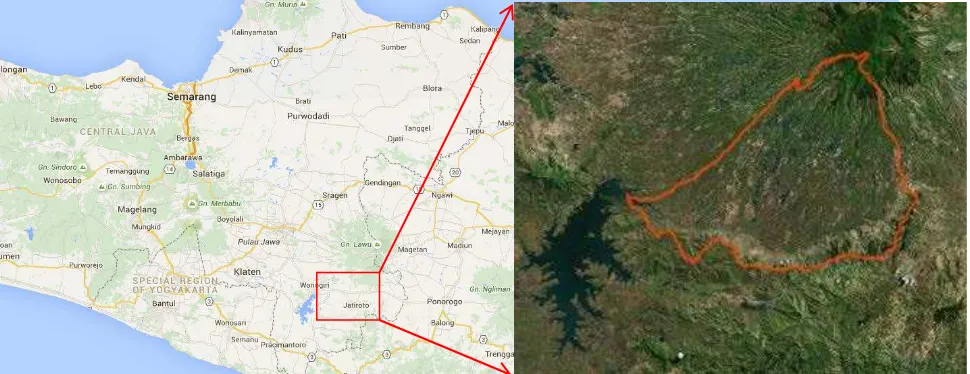
2.1. Case Study – Keduang Sub-Watershed
2.2. Data Collection
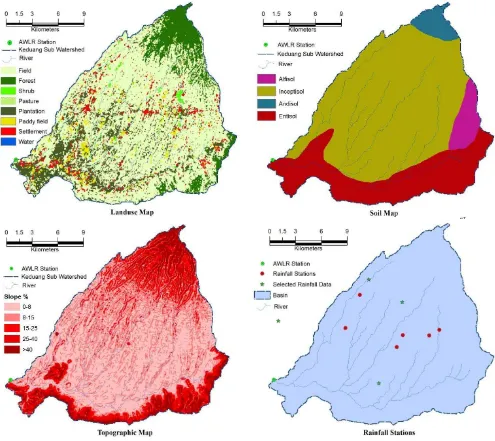
Data collection included the secondary data, such as land-use map, soil type maps, contour data, and climate data from related institutions.
Fig.2 Spatial distribution of Landuse, Soil types, Topographic and Rainfall Stations
2.3. Observation
2.4. Processing
SWAT models predicted erosion by rain and surface flow using the Modified Universal Soil Loss Equation (MUSLE), which was a further development of the Universal Soil Loss Equation (USLE) developed by Wischmeier and Smith (1978). USLE predicts average annual gross erosion as a function of rainfall energy. In contrast to USLE, MUSLE use factor flows to predicted results of sediment, so Sediment Delivery Ratio (SDR) are not needed because the runoff factor represents energy used in detecting and transporting sediment (Neitsch, S.L et.al, 2005).
Results of sediment on the model SWAT were calculated using the equation below:
���= 11.8 ( ����� .����� .����ℎ�� )0.56 .�����.�����.�����.������.���� (1)
Where sed is the sediment yield on a given day (metric tons); Qsurf is the surface runoff volume (mm
H2O/ha); qpeak is the peak runoff rate (m3/s); Areahru is the area of the HRU (ha); Kusle is the USLE soil
erodibility factor, Cusle is the USLE cover and management factor; Pusle is the USLE support practice
factor; LSusle is the USLE topographic factor and CFRG is the coarse fragment factor.
2.5. Analysis
Results of the simulation are generated using quantitative analysis of SWAT model by comparing the results of model simulations with actual data. SWAT CUP using Sufi-2 (Sequential Uncertainty Fitting ver.2) was used to analyze calibration and validation. Statistical models were testing the model used the equation of Nash-Sutcliffe efficiency (NS) and the coefficient of determination in (Putra, 2015).
��
= 1
−
∑∑��=1( ����−���� )2of simulation result and, ���� is a variable of average simulation result.
3.
Result and Discussion
3.1. Model Result
This stage is the most important process, because all the results of modeling should be accompanied by a calibration and validation of the data by comparing the simulation results and the actual data in the field to determine whether the model used to present the existing conditions in the field. The model was calibrated and validated only for flow, due to lack of annual sediment load data in outlet station.
The parameters sensitive to the flow rates that used for calibration derived in previous studies by Gunadi (2014). From the results of calibration can know the result of accuracy of the models and parameters sensitive that resulted from the calibration process. The calibration period is from 2008-2011 and for the validation period is from 2012-2014. This study uses 1 iteration with 100 simulations for each simulation period.
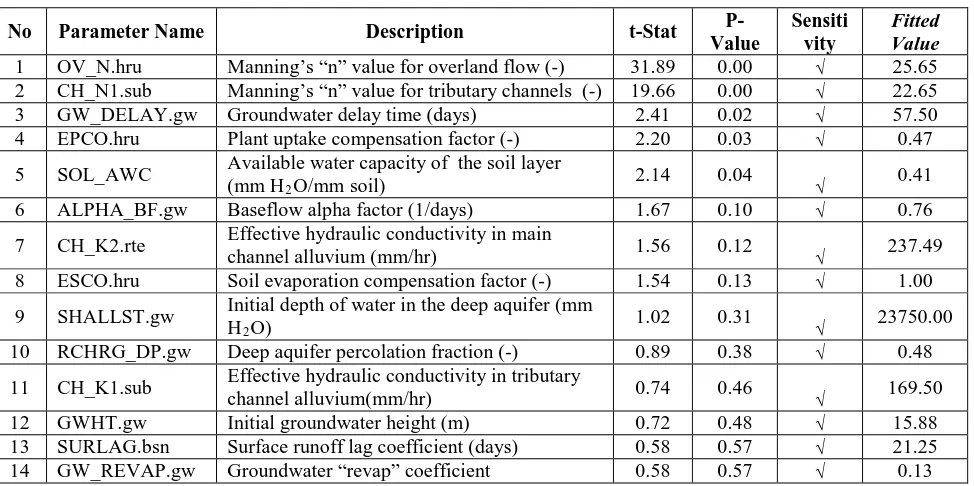
expert judgment or on sensitivity analysis. Sensitivity analysis is the process of determining the rate of change in model output with respect to changes in model inputs (parameters) (Arnold.J.G et.al, 2012)
Tab. 1. Results of Sensitive Analysis of monthly Calibration
No Parameter Name Description t-Stat
P-Value
5 SOL_AWC Available water capacity of the soil layer (mm H2O/mmsoil)
2.14 0.04
√ 0.41
6 ALPHA_BF.gw Baseflow alpha factor (1/days) 1.67 0.10 √ 0.76
7 CH_K2.rte Effective hydraulic conductivity in main
channel alluvium (mm/hr) 1.56 0.12 √ 237.49 8 ESCO.hru Soil evaporation compensation factor (-) 1.54 0.13 √ 1.00
9 SHALLST.gw Initial depth of water in the deep aquifer (mm H2O)
1.02 0.31
√ 23750.00
10 RCHRG_DP.gw Deep aquifer percolation fraction (-) 0.89 0.38 √ 0.48
11 CH_K1.sub Effective hydraulic conductivity in tributary
channel alluvium(mm/hr) 0.74 0.46 √ 169.50 12 GWHT.gw Initial groundwater height (m) 0.72 0.48 √ 15.88 13 SURLAG.bsn Surface runoff lag coefficient (days) 0.58 0.57 √ 21.25 14 GW_REVAP.gw Groundwater “revap” coefficient 0.58 0.57 √ 0.13
The result of monthly calibration obtained by comparing data flow simulation results and the actual value of R2 = 0.86 and NS = 0.77. When the value closer of 1, then the model will be more accurate in predicting the actual conditions in the field.
Fig. 3 Monthly Calibration Graph in 2008-2010
Figure 3 shows a graph comparing the monthly results with simulated data and actual data from 2008 to 2011. The results of simulation looks overestimated, but the trend graph illustrated flow simulation results almost describe the actual conditions in the field
Fig. 4 Plot of Observation and Simulation Values
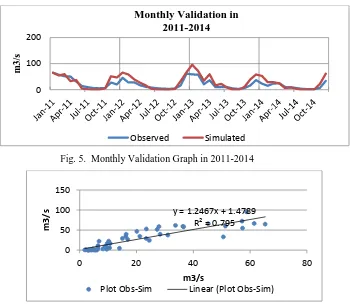
Result of model validation obtained value of R
2 = 0,79 and NS = 0,41. According (Moriasi et.al,2007) models can be accepted if the value of R2> 0.5, so the SWAT models used in the Keduang sub-watershed acceptable. Results of the validation model can be seen in the image below. Figure 5 shows monthly and Simulation Validation Graph and Figure 6 shows the Plot of Observation and Simulation Values.
Fig. 5. Monthly Validation Graph in 2011-2014
Fig. 6. Plot of Observation and Simulation Values
3.2. Erosion Rate and Sedimentation
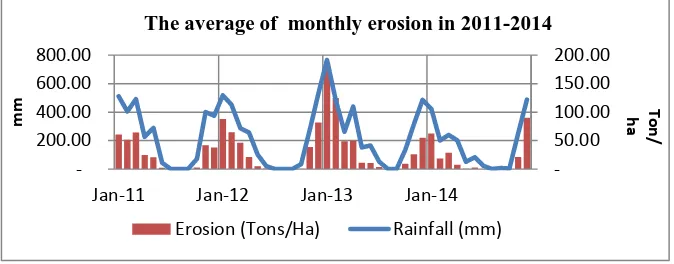
Result of SWAT simulation to predict erosion rate in 2011-2014 is shown in Figure 7. The graph shows the increase in erosion following the higher average monthly rainfall in Keduang sub-watershed, this means that rainfall greatly affect the amount of erosion. Rain factor is not only affecting the high of
Fig. 7. The average of erosion rate in 2011-2014
From Figure 8 below shows the graph the rate of erosion of 2011-2014 increased in 2013, this is caused by the high rainfall in 2013. The higher the rainfall, the higher the resulting erosion, as well as the resulting sedimentation also will be even greater. This phenomenon will also be very detrimental, in addition to the level of agricultural productivity declining and the encouragement to open new lands and also sedimentation in Gajah Mungkur Reservoir will be higher which would need huge costs for the normalization.
Fig. 8 The average of monthly erosion in 2011-2014
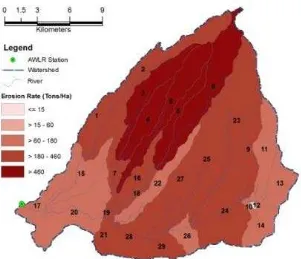
High erosion rate in sub-watersheds 1, 2, 7, 9, 16, 18, 19, 21, 23, 24, 25, 27, 28, 29, and a very high erosion rate is in 3, 4, 5, 6, 8. Fig. 8 is a map of erosion rate of Keduang sub-watershed. The map shows mostly a high erosion rate and very high erosion rate in the area of the upstream watershed. According (Asdak, 2001), upstream ecosystems is an important part because it has the function of protection against all parts of the watershed, among others, in terms of water function. Sub-watersheds below is a priority area that needs to be done by the conservation measures related institutions to improve the performance of Keduang sub-watershed.
The average of erosion in 2011 -2014
Erosion (Ton/Ha) Rainfall (mm)
The average of monthly erosion in 2011-2014
Fig. 8. Erosion Rate of Keduang Sub-watershed
The Classification erosion rate in Keduang sub-watershed, researcher used classification based on (Ministry of forestry, 2013) according to the Regulation of the Minister of Forestry Number. P.3 / V-SET / 2013 on Guidelines for Identification of Characteristics Watershed. In the table below shows the rate of erosion in Keduang sub-watershed with 51.22% erosion rate is high and 22.17% erosion rate is very high. It has explained the conditions of land degradation are quite severe.
Tab. 2. Area of Erosion Rate in Keduang Sub-Watershed
Erosion rate Description Area (Ha) %
≤ 15 Very low 21.50 0.06
> 60 – 180 Moderate 9,305.00 26.55
> 180 – 460 High 17,950.75 51.22
> 460 Very high 7,771.25 22.17
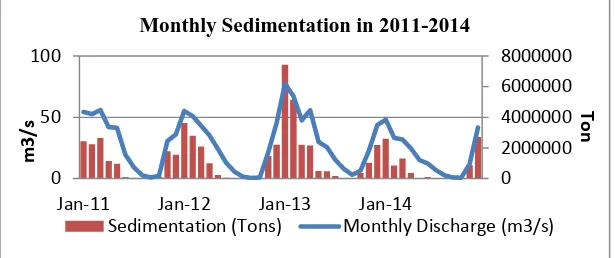
Fig. 9. Monthly sedimentation in 2011-2014
4.
Conclusion
Result of model validation obtained the value of R2 = 0.79 and NS = 0.41, according to (Moriasi et.al,
2007) models is assumed to be valid if the value of R2> 0.5, thus, SWAT model used to analyze Keduang
sub-watershed is accurate and acceptable. As much as total area of 17,950.75 ha (51.22%) was classified as high attrition rate, while as much as 7,771.25 ha (22.17%) was very-high attrition rate. In addition the average sedimentation in Keduang sub-watershed derived from the simulation in 2011-2014 was 408.19 tons/ha/year.
Despite the expectation of result of this study, it only used monthly simulation and involved 8-years rainfall data. It is suggested to conduct further research which includes longer period of data input as well as daily simulation to obtain more accurate result and better model.
References
[1] Nugroho,S.P et.al. (2002). The Impact of Landuse Change on Surface Runoff, Sediment and Nutrient. Journal of Sains and Technology , BPPT Vol.4 No.5.
[2] Asdak, C. (2001). Hydrology and Watershed Management. Yogyakarta: University of Gadjah Mada Press.
[3] Rahman, M. (2012). Study of Conservation Management in Keduang Sub Watershed, Bengawan Solo Watershed. Journal of irrigation techniques .
[4] Maridi. (2012). Vegetative approach in Bengawan Solo Watershed Conservation Efforts, A Case Study in Keduang Sub Watershed. Journal Environment and Soil Science , Vol.2, No.7.
[5] Neitsch, S.L et.al. (2005). Soil and Water Assessment Tool Theoretical Documentation. Texas: Agriculture Research Servise and Texas Agriculture Experiment Station.
[6] Putra, A. (2015). The Analysis of Ciawi Reservoir Effectiveness Using SWAT Model As Ciliwung Watershed Flood Control Effort. Bogor: University of Agricultural Bogor.
[8] Moriasi et.al. (2007). Model Evaluation Guidelines for Systematic Quantification of Accruracy in Watershed Simulations. Journal ASABE , Vol.50(3):885-900.
[9] Ministry of forestry. (2013). Guidelines on the Indentification Characteristics Watershed. Jakarta: Ministry of forestry.
[10] Firdaus, G. (2014). Hydrological Respons Analysis towards Soil Conservation Practices Application in Lengkong Watershed using SWAT model. Bogor: University of Agricultural Bogor.