GROWTH AND PROTEIN CONTENT OF Ulva prolifera
MAINTAINED AT DIFFERENT FLOW RATES IN
INTEGRATED AQUACULTURE SYSTEM
WASTU AYU DIAMAHESA
GRADUATE SCHOOL
BOGOR AGRICULTURAL UNIVERSITY BOGOR
DECLARATION OF THESIS AND INFORMATION SOURCES OF INFORMATION AND PATENT
Hereby I genuinely stated that the master thesis entitled Growth and protein content of Ulva prolifera maintained at different flow rates in integrated aquaculture system is true of my own work under the supervisor advisory board and that has not been submitted before in any forms and universities. The content of this thesis has been examined by the advising advisory board and external examiner. All the information taken and quoted from published or unpublished scientific paper from other writers have been mentioned in the script and listed in the references at the end of this thesis.
I hereby handed the copyright of my thesis to Bogor Agricultural University.
Bogor, Oktober 2016
Wastu Ayu Diamahesa
RINGKASAN
WASTU AYU DIAMAHESA. Pertumbuhan dan kandungan protein Ulva prolifera yang dipelihara dengan laju aliran berbeda pada sistem budidaya terpadu. Dibimbing oleh DEDI JUSADI, MIA SETIAWATI dan TOSHIRO MASUMOTO
Limbah utama budidaya ikan adalah nitrogen dalam bentuk amonia. Peningkatan aktivitas budidaya akan meningkatkan jumlah limbah budidaya. Upaya mereduksi dampak peningkatan limbah terhadap penurunan kualitas air dapat dialihkan dengan cara memanfaatkan limbah anoganik tersebut sebagai sumber nutrisi rumput laut. Aliran air atau debit air merupakan aspek penting untuk mengelola ketersediaan hara. Peningkatkan aliran air, akan menyebabkan aliran nutrien meningkat dan memungkinkan peningkatan produksi biomass yang lebih tinggi sehingga serapan hara akan lebih rendah. Oleh karena itu penelitian ini bertujuan untuk menentukan tingkat pertumbuhan dan kandungan protein Ulva prolifera yang dipelihara dengan debit air yang berbeda pada sistem budidaya terpadu.
Ikan Yellowtail sebanyak 9 ekor dengan biomassa 5.095 g dan berat rata-rata 566,11 ± 81,51 g dipelihara dalam tangki kapasitas 540 L selama 24 hari, dan diberi air mengalir dengan debit 10 L min-1. Air dari tangki budidaya ikan didistribusikan ke dalam tangki sedimentasi kemudian dialirkan ke dalam 6 tangki pemeliharaan Ulva pada debit 0,5, 1,0 dan 1,5 L min-1, masing-masing 2 ulangan.
Ulva ditebar sebanyak 0,83 ± 0,02 g pada tangki berukuran 30 L. Parameter uji yang diukur adalah kinerja pertumbuhan ikan Yellowtail, biomass Ulva prolifera,
kandungan protein Ulva prolifera, dan total ammonia nitrogen.
Hasil pengukuran menunjukakan bahwa biomass ikan meningkat menjadi 5,408 g, sedangkan biomassa Ulva meningkat menjadi 42 g, 156 g dan 155 g untuk masing-masing laju aliran 0,5 L, 1,0 L dan 1,5 L min-1. Kadar protein dari
Ulva di semua perlakuan sama (P>0,05). Pada perlakuan 1,0 dan 1,5 L min-1, pertumbuhan Ulva secara signifikan lebih tinggi dari Ulva di 0,5 L min-1 (P<0,05). Hasil pengukuran tersebut menunjukkan bahwa debit air yang tinggi (1,0 L dan 1.5 L min-1) akan menghasilkan biomassa yang lebih tinggi sebesar 156 g, namun efisiensi penyerapan nutrien akan semakin rendah dengan nilai kadar protein 25%. Namun kadar protein rumput laut tersebut pada akhir pemeliharaan selama 24 hari meningkat sekitar 4,4 – 4,9 kali. Pada debit air 1,0 L dan 1,5 L min-1 pada penelitian ini waktu yang dibutuhkan untuk 100% pergantian air pada tangki rumput laut berukuran 30 L untuk dapat menyerap nutrien dengan baik adalah 30 menit dan 20 menit berturut-turut. Total ammonia pada tangki outlet (0.0202 - 0.1137 mg N L-1) Ulva lebih kecil dari inletny (0.0286 - 0.1394 mg N L-1). Namun penurunan NH3 di setiap perlakuan sama. Oleh karena itu
dapat disimpulkan bahwa tingginya nilai debit yang diaplikasikan pada Ulva
mempengaruhi kecepatan pertumbuhan, tetapi tidak mempengaruhi kadar protein
Ulva.
SUMMARY
WASTU AYU DIAMAHESA. Growth and protein content of Ulva prolifera
maintained at different flow rates in integrated aquaculture system. Supervised by DEDI JUSADI, MIA SETIAWATI, and TOSHIRO MASUMOTO
The main waste source of fish farming is nitrogen in the form of ammonia. Rapid development of aquaculture activity has been accompanied by an increase in environmental impacts. Efforts to reduce the impact of waste improvement on degradation of water quality can be transferred by utilization of inorganic waste as a source of seaweed nutrition. Water flow is an important aspect of managing nutrient availability. Increasing the water flow would cause increased nutrient flow and allow the higher production of biomass thus nutrient uptake will be lower. Therefore, this study aims to determine the growth and protein content of
Ulva prolifera maintained at different flow rates in integrated aquaculture system. Yellowtail as many as 9 fish stocked with 5.095 g with an average weight of 566.11±81.51 g were kept in a tank capacity of 540 L for 24 days of cultivation period, by water flowing at the rate of 10 L min-1. Water from the fish tank was distributed into the sediment tank and then go to 6 Ulva tanks with the flow rate of 0.5, 1.0 and 1.5 L min-1. Ulva stocked up 0.83± 0.02 g on the tank size of 30 L. Test parameters measured were growth performance of Yellowtail, biomass of
Ulva prolifera, protein content of Ulva prolifera, and total ammonia nitrogen. The measurement results showed that the biomass of fish increased to 5.408 g, then biomass of Ulva increased to 42 g, 156 g and 155 g for flow rate of 0.5 L, 1 L and 1.5 L min-1, respectively. The protein content of Ulva for all the treatments was the same (P> 0.05). In the flow rates of 1.0 and 1.5 L min-1, Ulva
growth were significantly higher than Ulva in 0.5 L min-1. The results show that
the high flow rates (1.0 L and 1.5 L min-1) obtained higher biomass amounted to 156 g yet the efficiency of nutrient absorption will be low with the protein content of 25%. However, the protein content of the seaweed at the end of the maintenance for 24 days increased approximately 4.4 to 4.9 times. In the flow rates of 1.0 L and 1.5 L min-1 in this study, the time required for 100% water exchange on the 30 L seaweed tank to absorb nutrients well was 30 minutes and 20 minutes respectively. The measurement results showed that the biomass of fish increased to by using high water flow obtained a total of ammonia in the tank outlet of Ulva (0.0202 - 0.1137 mg N L-1) were smaller than those were in the inlet (0.0286 - 0.1394 mg N L-1). However, the decrease in NH3 in all treatments was similar. Therefore it can be concluded that the high value of flow rates applied in Ulva affects the growth rate, but does not affect the protein content of
Ulva.
©
Copyright of Bogor Agricultural University, 2016
All rights reserved
Any unauthorized quotation of all contents or any part thereof is strictly
prohibited. Citation is only for educational purpose, research, scientific writing, reports writing, critique and problem analysis; and citations would not give any disadvantage on behalf of Bogor Agricultural University.
GROWTH AND PROTEIN CONTENT OF Ulva prolifera
MAINTAINED AT DIFFERENT FLOW RATES IN
INTEGRATED AQUACULTURE SYSTEM
WASTU AYU DIAMAHESA
A Thesis submitted for the Degree Programs of Master of Aquaculture Science
GRADUATE SCHOOL
BOGOR AGRICULTURAL UNIVERSITY BOGOR
FOREWORD
First and foremost, all praises to my Lord Allah SWT for the gifts and His blessing to accomplish my research and master thesis with title “Growth and Protein Content of Ulva prolifera Maintained at Different Flow Rates in Integrated Aquaculture System”. This thesis was based on research conducted from January to February 2016. This thesis submitted for Master program of Aquaculture science.
I would like to sincerely deliver my greatest gratitude to Dr. Dedi Jusadi and Dr. Mia Setiawati as supervisors in Bogor Agricultural university for their enormous help throughout the completion of my thesis. I would like to express my sincere gratitude to Prof. Toshiro Masumoto of Kochi University for provision of tools and materials, encourage support, immense knowledge, and his motivation. It is also an honor to thank Prof. Kei Okamura and Prof Masanori Hiraoka for express my gratitude to Dr. Dinamella Wahjuningrum, M.Si as the head of study program and Dr. Eddy Supriyono, M.Sc who have been very kindly taking care of the paper work concerning the process of my study in Aquaculture Department of Bogor Agricultural University.
My appreciations were also extended to Indonesian Government Scholarship (Beasiswa Pascasarjana Dalam Negeri) during the first year of my study in Indonesia, Japan Student Services Organization (JASSO) Scholarship for granting scholarship during the study and experiment in Kochi University and also for SUIJI-JDP (Six University Initiative Japan-Indonesia Joint Degree Program) who allowed me to expand my knowledge and experiences in Japan. The part of this research was conducted by The Kochi University President's Discretionary Grant.
I also addressed my gratitude to all lecturer, staff, and classmate in Aquaculture Science, Graduate School of Bogor Agricultural University 2013 for all support, encouragement, joy, and pray. The last but not least, I would like to send my deeply thankful to my family members and BDP 42 (Majek, Angga, Anita, Wanya and Zizah), SUIJI JDP 2015 (Rusdah, Liza and Supriadi), HUMAIRA (Bu Nurul, Irma, Sari, Rara, Yanti, Aii, Rizqa and Majek) who have been praying, loving and supporting as always. I truly hope, this master thesis can be useful for society. Hopefully, it will give addition to the existing knowledge and information for the development of sustainable aquaculture.
Bogor, Oktober 2016
TABLE OF CONTENT
LIST OF PICTURES xii
LIST OF APPENDIX xii
1. Introduction Background 1
Objectives 2
2. Materials and Methods 2
Time and place of experiment 2
Experimental design 2
Research procedure 3
Preparation of integrated aquaculture system 3
Experimental set-up 3
Observations and measurements 4
Growth performance of Seriolla quinqueradiata and Ulva prolifera 4
Protein content of Ulva prolifera 4
Water quality monitoring 5
3. Results and Discussion 5
Results 5
Discussion 8
4. Conclusion and Recommendation 13
References 13
Appendix 17
LIST OF PICTURES
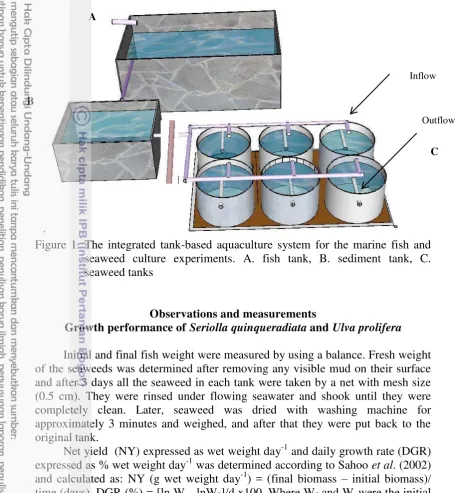
1. The integrated tank-based aquaculture system for 4 the marine fish and seaweed culture experiments. A. fish tank,
B. sedimentation tank, C. seaweed tanks cultured at different flow rates with fish culture outflow water (▓)
and cultured from direct seawater (░)
5. Total ammonia nitrogen (TAN) of yellow tail 7
Seriolla quinqueradiata in the inlet water of seaweed tanks at different flow rates (0.5 L min-1 (♦), 1 L min-1 (■) and 1.5 L min-1 2. Multiple comparisons dependent variable of daily growth rate 18
3. Homogenous subsets of daily growth rate 18
11. Initial and final size of Ulva prolifera cultured in integrated aquaculture 22 system
12. The integrated tank-based aquaculture system for 23 the marine fish and seaweed culture experiments. The right image is
a top view of the system
13. Kjedahl Methods 23
INTRODUCTION
Background
A rapid development of aquaculture industry in coastal areas throughout the world has been accompanied by an increase in environmental impacts (Diana et organic and inorganic compounds such as ammonium, phosphorus, dissolved organic carbon and organic matter. These numbers vary greatly with species, sizes, activity, water temperature, season, dissolved oxygen and other environmental conditions. In the term of species, for example, the ratio of protein to energy must be determined separately for each fish species in order to create an effective diet. Properly formulated prepared feeds have a well-balanced energy to protein ratio. Similarly, feeding activity should be paid attention by the fish farmers in order to help determine feed acceptance, calculate feed conversion ratio and feed efficiencies (Craig and Helfrich, 2002).
In intensive production marine aquaculture such as flow-through systems and cages, most of the waste water from flow through systems is not treated (Metaxa et al., 2006) and the waste water is flushed out directly to the environment by water exchange (van Rijn et al., 2006). Furthermore, the high nutritional status in the ecological aspect may significantly cause a series of ecological events, including eutrophication (Pérez-Mayorga et al. 2011) such as red tides, green tides and other disasters (Glibert et al. 2011; Schumacher et al.
2014).
One effort to reduce this waste is by using integrated aquaculture system. In integrated aquaculture system, by-products (wastes) from one species become nutrients for other co-cultured species (Hussenot, 2006). The integration of finfish aquaculture with seaweed culture is one such practice for reduction of pollution (Al-Hafedh et al. 2014) and lead to a sustainable aquaculture (Crab 2007). In addition, algae require dissolved N for their growth (Neori et al. 2004). Moreover, the nutrients could be transformed into valuable products or flushed out from the system (Chopin et al. 2010).
The criteria of seaweed to an integrated aquaculture operation are the rapid growth, the accumulation of N and some added value (Neori et al. 2004). Ulva assimilation of nutrients (Cohen and Fong, 2006).
As part of an effort to develop integrated aquaculture technology, Al-Hafedh et al (2014) had evaluated tank-based integrated system using green alga,
2
culture conditions, such as the water flow and nutrient concentration (Buschmann
et al. 2001). The nutrient uptake efficiency is defined as the average reduction (%) in the nutrient concentration. Meanwhile, the nutrient uptake rate which is the amount of nutrient removed per unit of time. Stocking densities and water turnover rate greatly affect the two concepts for a certain period. (Buschmann et al. 2001).
In tank culture, water flow is an important aspect to managing nutrient availability. By increasing the water flow, nutrient flux increases that determine that seaweeds will not be nutrient limited, permitting a higher biomass production, and in this condition, the nutrient uptake efficiency will be lower. Moreover, if the flow rate is low, nutrients will become limiting, biomass production will decrease, but the nutrient uptake efficiency will be higher. Consequently, it is essential to establish the main target of the culture to intend to optimize its functioning (Buschman et al. 2001). Therefore, It is important to utilize the physiological potential of the seaweed to design an efficient integrated aquaculture system (Troell et al. 2003). Al-Hafedh et al. (2014) found that the effluent flow rate has a significant impact on the performance of the seaweed than stocking density. This Experiment had been applied on Yellowtail Seriolla quinqueradiata and Seaweed
Ulva prolifera.
Objective
The objective of this study was to determine the growth and protein content of Ulva prolifera maintained at different flow rates in integrated aquaculture system.
MATERIALS AND METHOD Time and place of experiment
This research was conducted from January to February 2016 at Usa Marine Biological Center, Fish Nutrition Laboratory, and Center for Advanced Marine Core Research, Kochi University, Japan.
Experimental design
The experiment was set up as a completely randomized design. In a preliminary study was used two different flow rates of 0.5 and 1.5 L min-1. Results showed that using both the flow rates, Ulva could absorb ammonia. To ensure the best flow rate, then 3 ranges of different flow rates were created. Therefore in this study was used three different flow rates, 0.5 L, 1.0 L, and 1.5 L min-1 with two replications. The experimental design was described by a mathematical model as follows:
Yij(t) = μ + P(i) + ε(i)
Annotation:
Yij(t) = response of each parameter were observed μ = mean
3
Data analyses were performed using variance (ANOVA) with F test at 95% confidence interval using the program Ms. Exel and SPSS 20.0 (Appendix 1-10). If significant, to see the difference among the treatments then tested further by Tukey test (Steel & Torrie 1993).
The parameters analyzed were included the weight of the seaweed and yellow tail, the rate of growth of seaweed and yellow tail, the survival rate of yellow tail and the value of ammonia. Water quality data were analyzed descriptively through appropriate reference. Data were presented in tables and charts.
Research Procedure
Preparation of integrated aquaculture system
Integrated aquaculture system was installed at Usa Marine biological center, Kochi University as a layout described in Fig 1. The system consisted of one rectangular fish culture tank (1.5 m length, 0.9 m width, 0.6 height and 0.4 depth, total volume approximately 540 L), one rectangular sediment tank (0.8 m length, 0.6 width, 0.4 m depth, total volume approximately 192 L) and six round seaweed culture tanks (each with total volume 30 L). The fish tank was covered by a net and plastic roof to avoid direct sunlight. Fish tank and seaweed tank were aerated using air stones connected to a 13 mm pipe with an air blower (Hi blow air pump 17.7 kpa, 120 L/min, the Phillippines).
Experimental set-up
The experimental fish culture tank received non-filtered seawater from Usa bay about 10 L min-1 and stocked with 5,095 g of the 9 fish with an average weight of 566.11 ± 81.51 g (Fig. 1A and Appendix 12). Water flowed continuously from the sea to the fish tank (Fig. 1A) and to sedimentation tank (Fig. 1B) and finally to seaweed tanks (Fig. 1C) in a water flow-through model. Growth performance and feed utilization of the fish were determined and calculated by using the following formulae: Daily weight gain (DWG; g day-1) = (final weight - initial weight)/no.of fish/time (days); Feed conversion ratio (FCR) = feed intake (g)/weight gain (g).
In this study, Ulva prolifera (Appendix 11) with the length of 1 cm was obtained from seaweed laboratory, Kochi University. The initial protein content of this seaweed was 5.63 % (in dry weight). The seaweed was cultivated in 3 different tanks (with a different flow rate of 0.5 L min-1, 1 L min-1 and 1.5 L min-1, low, medium and high flow rate) in two replicates. The seaweed was stocked at a stocking density of approximately 0.83 ± 0.02 g in each 30 L seaweed tank. Seaweed was set up with strong aeration thus allowing the seaweed floated in the water column (Hiraoka and Oka, 2008).
4
same time seaweed biomass was weighed. The experiment was conducted in 24 days for growth performance of seaweed.
Figure 1. The integrated tank-based aquaculture system for the marine fish and seaweed culture experiments. A. fish tank, B. sediment tank, C. seaweed tanks
Observations and measurements
Growth performance of Seriolla quinqueradiata and Ulva prolifera
Initial and final fish weight were measured by using a balance. Fresh weight of the seaweeds was determined after removing any visible mud on their surface and after 3 days all the seaweed in each tank were taken by a net with mesh size (0.5 cm). They were rinsed under flowing seawater and shook until they were completely clean. Later, seaweed was dried with washing machine for approximately 3 minutes and weighed, and after that they were put back to the original tank.
Net yield (NY) expressed as wet weight day-1 and daily growth rate (DGR) expressed as % wet weight day-1 was determined according to Sahoo et al. (2002) and calculated as: NY (g wet weight day-1) = (final biomass – initial biomass)/ time (days), DGR (%) = [ln Wt –lnW0]/d x100. Where W0 and Wt were the initial
and final wet weights in grams respectively, t is days of culture.
Protein content of Ulva prolifera
At the end of the experiment, to determine the quality of the seaweed, sample collection was conducted. Seaweed tissues from each tank in the integrated aquaculture system were stored in freezer at -30oC. Furthermore, at the analysis time they were dried at 60oC for 24 hours and then stored in a dry place until protein determination at Fish Nutrition laboratory, Kochi University. All
Inflow
Outflow
A
B
5
samples were analyzed according to the method described by Takeuchi (1988) and determined by using Kjeldahl (Appendix 13).
Water quality monitoring
Temperature and dissolved oxygen were measured in situ by using DO meter (multi HQ 40 d multimeter, USA) at the sampling time. The daylight lasting was 9 hours and 57 minutes. Water samples were collected at the outflow fish tank, inflow and outflow seaweed tank to measure total ammonia-nitrogen (TAN). Sampling was done once on day 20 at 0 h, 2 h, 4 h, 6 h, 8 h, 10 h, 12 h, 18h, 21 and 24 h after feeding. Furthermore, the water samples were kept in freezer -30 oC until analyzed. The ammonia-N content was determined by phenate method (Strickland and Parsons, 1972) and using autoanalyzer-spectrophotometer (SWAN version 1.41 BLTEC) at Core Center, Kochi University.
RESULTS AND DISCUSSION
Results
Data for growth performance of fish are shown in Table 1. The fish were fed
at satiation. Initial and final average weights of the fish during the experiment were 566.11 g fish-1 and 600.89 g fish-1, respectively. Total initial fish biomass was 5,095 g, and the final fish biomass was 5,408 g. During 24 days rearing in the integrated system, the fish increased body weight. The daily weight gain and total gain were 1.45 g fish day-1 and 313 g, respectively. Feed intake was 778.5 g, and the value for FCR was obtained to be 2.49.
Table 1. Seriola quinqueradiata stocking and growth data in the integrated aquaculture system
Parameters Values ± Standard deviation
Average initial fish weight (g)
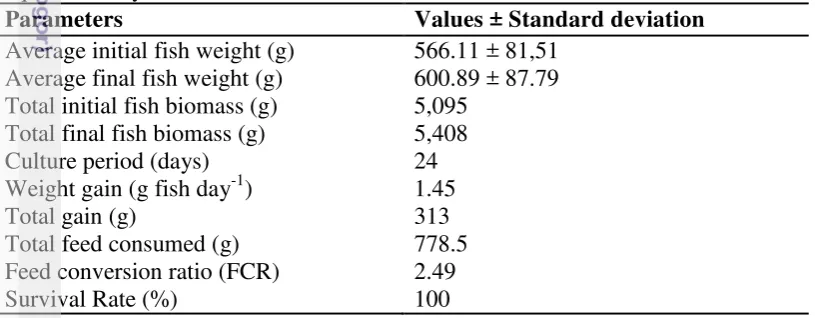
Growth and fresh biomass production of the green seaweed, Ulva prolifera
were compared at three different flow rates (0.5 L min-1, 1.0 L min-1 and 1.5 L min-1) (Fig. 2). Ulva prolifera yield achieved values of 42 g at low flow rate, 156 g, and 155 g at medium and high flow rates, respectively. The biomass of the Ulva
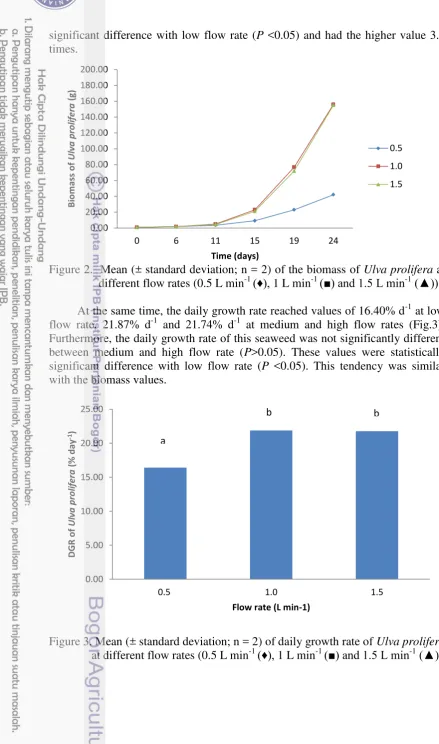
6 At the same time, the daily growth rate reached values of 16.40% d-1 at low flow rate, 21.87% d-1 and 21.74% d-1 at medium and high flow rates (Fig.3). Furthermore, the daily growth rate of this seaweed was not significantly different between medium and high flow rate (P>0.05). These values were statistically significant difference with low flow rate (P <0.05). This tendency was similar with the biomass values.
Figure 3.Mean (± standard deviation; n = 2) of daily growth rate of Ulva prolifera
at different flow rates (0.5 L min-1 (♦), 1 L min-1 (■) and 1.5 L min-1(▲))
a
7
The protein content of Ulva cultured with fish effluent at different flow rate did not significantly different (P>0.05) and had the values about 25-27.5% (Fig.4). Protein content of this seaweed at the end of the maintenance for 24 days increased approximately 4.4 to 4.9 times. This value indicates that the nitrogen in water affected the growth of seaweed.
Figure 4. Crude protein content (% in DW) of Seaweed Ulva prolifera cultured at different flow rates with fish culture outflow water.
Based on Fig. 5, the nutrient in the fish tank inlet from non-filtered seawater within 24 hour was low and had flat value with a range of 0.0020 – 0.0113 mg N L-1. It means that the source of water applied in this study had the same amount of nutrients. After passing through the fish tank, the range value of nutrients in the water inflow of the seaweed tank within 24 hours was 0.0286 - 0.1394 mg N L-1. Total ammonia nitrogen (TAN) in the inlet water of seaweed tanks showed a not significantly different value (P>0.05) at a different flow rate.
8
However, after it passed through the sedimentation tank and seaweed tank, the nutrient content was reduced to be 0.0202 - 0.1137 mg N L-1 (Fig.6). This result proves that the seaweed could absorb ammonia properly. The source of nutrients reached the maximum level at 4-8 hours after feeding. Meanwhile, temperature and dissolved oxygen measured were in the ranges of 11.7-17.6oC and 6.14-9.35 mg L-1, respectively.
Figure 6. Total ammonia nitrogen (TAN) of yellow tail Seriolla quinqueradiata in the outlet water of seaweed tanks at different flow rates (0.5 L min-1 (♦), 1 L min-1 (■) and 1.5 L min-1(▲)) in day 20.
Discussion
9
Effect of nitrogen source content with a flow rate in this study showed that NH3 content was relatively similar to in the inlet water of the seaweed (Fig. 5),
then the trend value was the same for all outlets. Thus, the cause of the different results was the flow rates used in this study. In this regard, NH3 did not have a
significant impact on the water content of seaweed outlet. This can be evidenced by the same value of NH3 at the outlet of seaweed among the treatments (Fig. 6).
Flow rates of 1.0 L min and 1.5 L min-1 in this study obtained biomass of 156 g and 155 g. However, the biomass of the seaweed only reached 42 g on a flow rate of 0.5 L min-1. It indicates that the higher the value of the flow rate was applied, then the higher the growth of seaweed was obtained. Likewise, DGR of 1.0 L min and 1.5 L min-1 yielded in this study were not significantly different (P>0.05), with the values of 21.87% and 21.76% respectively. In this study, seaweed was cultured in 30 L tanks with the initial biomass of 0.83 g each tank. However, the final biomass of 1.0 L min-1 and 1.5 L min-1 were 3.7-fold from flow rate of 0.5 L min-1. These experiments suggest that an increment of the flow rates in seaweed culture tanks allowed to almost 200 times the biomass yield obtained in 24 days experiment.
Considering the results described above, it can be stated that the increase in water flow to 1.0 L min-1 and 1.5 L min-1 is adequate to maintain a high yield. The flow rates indicated changes in water flow or velocity in the seaweed tanks. In this study, Ulva prolifera maintained at 30 L tank, could grow optimally at flow rate of 1.0 L min-1. The results mentioned in advance could be positively related to retention time. In this regard flow rate of 1.0 L min-1 in this study need 100% water turnover for 30 L seaweed tank in appropriate time about 30 minutes to absorb nutrient well. Subsequently, this result was not significantly different with the growth performance of seaweed cultured at 1.5 L min-1, even though they need a water turnover for once circulation approximately 20 minutes. Thus, to make efficient of the amount of water wasted in the culture process, it is suggested that the optimum flow rate in this study was 1 L min-1. Meanwhile, Al Hafedh et al.
(2014) found that Ulva lactuca maintained on a volume of 1 m3 could grow optimally at a flow rate of 10 m3 day-1 and was needed 2.4 hours for 100% water exchange. Water motion is extremely important for seaweed because it determines the thickness of velocity and diffussion boundary layers (DBL‟s) around the thallus and leads the movement of ions and gasses to and from the thallus surface (Hurd, 2000). Photosynthesis rates are also reduced under slow flow (Koch, 1993). This is in accordance with Gao et al (1992), that the basic principle seaweed technology has been the vertical movement, by bottom aeration, of seaweed suspensions in tanks and ponds, and the passage of nutrient-laden water through them. The vertical movement of an optimally stocked seaweed pond allows each algal frond to be exposed to an optimal light exposure. The water turbulence generated by the aeration thins the hydro boundary layer around the frond surface, speeding the inflow to the fronds of nutrients and outflow from the frond of excess oxygen.
The DGR results in the present study were higher than that reported in the previous study by Al- Hafedh et. al (2014) with maximum value only 10.60% on
10
at an average of 4.0% per day during the treatment (fishpond outflow channel). In addition, U. clathrata that was cultured in tanks receiving waste water from a shrimp aquaculture pond showed daily growth rate attaining 12%, (Copertino et al. 2009). Another study from Ale and Mikkelsen (2011) found that Ulva lactuca
maximum growth rates (13.8% d-1) were recorded at the lowest density (1.5 g FW l-1). Yield reached a maximum (40 g DW m-2 d-1) at a density of 2.5 g FW l-1, decreasing at higher densities (6 g FW l-1) to least than 10 g DW m-2 d-1. Another author, Nelson et al. 2001 reported that increase in seaweed production depends on the location where they will receive waste water from the adjacent fishponds.
In tank culture, waterflow is important aspect to manage nutrient availability. By increasing the water flow, nutrient flux increases that determines that seaweeds will not be nutrient limited, permitting a higher biomass production, and in this condition, the nutrient uptake efficiency will be lower (Fig.7). Moreover, if the flow rate is low, nutrients will become limiting, biomass production will decrease, but the nutrient uptake efficiency will be higher. A high water turnover specifies a high biomass production capacity, as nutrients are not a limiting factor, however the biofiltering efficiency will decrease. On the other hand if the water turnover rate is reduced, nutrient will begin limited, that making a lower capacity for the algae grow, but an increase of the biofiltering efficiency (Buschman et al. 2001).
Fig. 7 General showing the effect of the water turnover rate on growth and biofiltering efficiency (Buschman et al. 2001)
11
seaweed at the flow rates of 0.5 L min-1, 1.0 L min-1, and 1.5 L min-1 were 27.5%, 25.0% and 26.2%, respectively. These results were higher than those of previous studies conducted by Dhargalkar and Pereira (2005) 19.5% and Mamatha et al. (2007) 21%.
The protein contents of the Ulva at the end of the experiment were the same because the seaweed got the same nutrient sources from fish tank effluent. Then, the effluent was distributed into 3 different flow rates with 2 replications. This causes nutrient values generated in Ulva also similar in each treatment. However, the protein contents of this seaweed at the end of maintenance for 24 days increased approximately 4.4 to 4.9 times. This value indicates that the nitrogen in water affected the growth of seaweed. Although the protein values were not significantly different between treatments. However, the protein harvested at the end of the maintenance was different each treatment. It can be seen from the protein obtained by biomass converted so that the effectiveness values of the use of different flow rate were different. Protein content on flow rate of 0.5 L, 1.0 L and 1.5 L min-1 had different effectiveness values namely, 11.54%, 38.96% and 40.83%, respectively. Therefore, it could be said that the harvested protein was higher on flow rates of 1.0 L and 1.5 L min-1.
Ammonia, a chemically reduced compound, is assimilated as much as two to three times faster than the oxidized nitrate by many types of seaweed (Neori, 1996; Ahn et al., 1998). The most important sources of nitrogen for seaweeds are NH4+ and NO3− and, to a lesser extent, NO2− (Lobban and Harrison 1997).
Theoretically, NH4+ ought to be superior because it can be directly assimilated
into amino acids, while nitrate must be reduced prior to amino acid construction (Barsanti and Gualtieri 2006).
Ammonium (NH4+) and ammonia (NH3), with the unionized moiety toxic to
marine finfish at concentrations around 0.05 mg L−1 (Person-Le Ruyet et al. 1997, Foss et al. 2009). Bacterial biofilters are the most common method of converting harmful ammonia to relatively non-toxic nitrate (NO3−; Timmons et al. 2002). The
microbial oxidation of ammonia (nitrification). Therefore diminishes the performance of the integrated system (Krom et al., 1995; Schuenhoff et al., 2003) and should be avoided. Maintaining the cleanliness of all wet surfaces, including those of pipes, helps prevent the development of nitrifying bacteria (Dvir et al., 1999). The maximal biofiltration of any nutrient occurs, of course, in daytime, yet some TAN is also taken up at night, particularly when the TAN load to the algae is low (Cohen and Neori, 1991; Schuenhoff et al., 2003).
Integrating seaweed into the system is an alternative means to deal with waste nitrogen, it is a net oxygen producer during daylight hours, and it yields marketable biomass. Seaweed integration within landbased aquaculture systems has the potential to improve water quality for finfish cultivation, reduce effluent nutrient concentrations, and increase operational income product diversification.
Algal uptake of nitrogen depends on numerous factors including physical factors namely (light and temperature), environmental nutrient concentration, intracellular nutrient concentrations and biological factors (metabolism, age, etc). Studies on nitrogen form preferences are conflicting. Several studies on nitrogen enrichment of Ulva sp. show that ammonium (NH4+) is physiologically preferred over nitrate
(NO3-) given that less energy is required for its assimilation into the algal biomass
12
NO3- (DeBoer et al., 1978). Ale et al (2011) reported that ammonium is favorably
assimilated by Ulva lactuca; giving rise to a higher relative growth rate (RGR) and biomass yield and the uptake rate of ammonium is higher than that of nitrate.
Algae generally absorb nitrogen gradually, namely: Ammonium> nitrate> nitrite. Utilization of nitrate and nitrite by seaweed is less efficient because of nitrates and nitrites must first be reduced before it is used by cells of the seaweed. Nitrate is used by seaweed for metabolism by the reductase nitrate enzyme obtained (Patadjai 1993). Absorption of nitrate and nitrite by seaweed is affected by the concentration of ammonium in the media.
FCR is a measure of fish efficiency in converting feed mass into increases of the desired output. FCR indicates the efficiency of feed utilization by fish and affects waste load discharged into the aquatic environment. Contributions of N derived from the feed to the waste load will be influenced by FCR and nutrient retention in fish biomass. Differences in the amount of Nitrogen in the feed and fish produced were the amount of N loading into fish culture tank. FCR obtained in this study was 2.49 with 42% protein feed. To grow fish with the weight of 566.11 g to 600.89 g was removed waste as much as 41.35 g N (Figure 8 and Appendix 14).
Nitrogen
52.32 g
Weight gain 313 g
Crude protein of fish 21.9% (Jover et al 1999)
10.97 g (20.96 %)
41.35 g (79.04%)
Fig 8. Influx and efflux of nitrogen in yellowtail culture
CONCLUSION AND RECOMMENDATION
Conclusion
The seaweed U. prolifera can be cultured in integrated aquaculture system. Flow rates of 1.0 L min-1 and 1.5 L min-1 obtained biomass of 156 g and 155 g, respectively. The flow rate affected the growth of the seaweed. However, the flow rate did not affect nitrogen content of the algae.
Recommendation
Further investigation is required to use a larger seaweed tank such as 100 L, 300 L, 500 L, 1 ton, and mass scale. If possible it might be tested using gravity without aeration on the seaweed tank, so the use of electricity can be reduced. This research was conducted in the winter, for further investigation, it might be tested in the spring, summer or autumn so that it can be seen the best time for conducting Ulva prolifera culture. Recirculation system might be used for future applications to be more frugal.
REFERENCES
Ahn, O, Petrell, RJ, Harrison, PJ, 1998. Ammonium and nitrate uptake by Laminaria saccharina and Nereocystis luetkeana originating from a salmon sea cage farm. J. Appl. Phycol. 10, 333–340.
Ale MT and Mikkelsen JD. 2011. Differential growth response of Ulva lactuca to ammonium and nitrate assimilation. J Appl Phycol 23:345-351.
Al-Hafedh, Alam A and Buschmann AH. 2014. Bioremediation potential, growth and biomass yield of the green seaweed, Ulva lactuca in an integrated marine aquaculture system at the Red Sea coast of Saudi Arabia at different stocking dencities and effluent flow rates. Review in Aquaculture
6:1-11.
Barsanti L, Gualtieri P. 2006. Algae: anatomy, biochemistry, and biotechnology. CRC, Boca Raton.
Buschmann, AH, Troell, M and Kautsky, N. 2001. Integrated alga farming: a review. Cahiers de Biologie Marine. 42:83–90
Butcher RW. 1933. Studies on the ecology of rivers. I. On the distribution of macrophytic vegetation in the rivers of Britain. J. Ecol. 21:58–91.
Chopin T, Troell M, Reid GK, Knowler D, Robinson SMC, Buschman AH, Pang S. 2010. Integrated multi-trophic aquaculture part II. Increasing IMTA adoption. Global Aquaculture Advocate. Magazines. 17-20pp.
Cohen, I, Neori, A, 1991. Ulva lactuca biofilters for marine fishponds effluents. Bot. Mar. 34, 475–482.
Cohen RA, Fong P. 2006. Using opportunistic green macroalgae as indicators of nitrogen supply and sources to estuaries. Ecol. Appl. 16,1405–1420.
14
Crab R, Avnimelech Y, Defoirdt T, Bossier P, Verstraete W. 2007. Nitrogen removal techniques in aquaculture for sustainable production. Aquaculture
270:1-14.
Craig S and Helfrich LA. 2002. Understanding Fish Nutrition, Feeds, and Feeding. Virginia Cooperative Extension. Publication 420-256.
Dan A, Hiraoka M, Ohno M, Critchley AT. 2002. Observations on the effect of salinity and photon fluence rate on the induction of sporulation and rhizoid formation in the green alga Enteromorpha prolifera (Müller) J. Agardh (Chlorophyta, Ulvales). Fish Sci 68:1182–1188.
DeBoer JA, Guigli HJ, Israel TL, D‟Elia CF. 1978. Nutritional studies of two red algae. 1. Growth rate as a function of nitrogen source and concentration. J.Phycol. 14:261-266.
Dhargalkar VK and Pereira N. 2005. Seaweeds: promising plants of the millennium. Science and Culture, 71:60-66.
Diana JS, Egna HS, Chopin T, Peterson MS, Cao L, Pomeroy R. 2013. Responsible aquaculture in 2050: 2050 local conditions and human innovations will be key to success. Bio Science 63:255-262.
Dvir, O, van Rijn, J, Neori, A, 1999. Nitrogen transformations and factors leading nitrite accumulation in a hypertrophic marine fish culture system. Mar. Ecol. Progr. Ser. 181, 97– 106.
Fan X, Dong X, Yitao W, Xiaowen Z, Shaona C, Shanli M, and Naihao Y. 2014. The effect of nutrient concentrations, nutrient ratios and temperature on photosynthesis and nutrient uptake by Ulva prolifera: implications for the explosion in green tides.J. Appl. Phycol. 26:537– 544
Foss A, Imsland AK, Roth B, Schram E, Stefansson S. 2009. Effects of chronic and periodic exposure to ammonia on growth and blood physiology in juvenile turbot (Scophthalmus maximus). Aquaculture 296:45–50 Gilbert PM, and Burkholder JM. 2011. Harmful algal blooms and eutrophication.
“Strategies” for nutrient uptake and growth outside the Redfield comfort zone. Chin. J. Oceanol. Limnol. 29:724-738.
Hiraoka M and Oka N. 2008. Tank cultivation of Ulva prolifera in deep seawater
using a new “germling cluster” method. J Appl Phycol (2008) 20:97–102.
Hurd CL. 2000. Water motion, marine macroalgal physiology and production.
Journal of phycology. 36:453-472.
Hussenot J. 2006. Les systemes integres en aquaculture marine: une solution durable pour un meilleur respect de l‟environnement littoral. In: Chaussade, J., Guillaume, J. (Eds.), Peche et aquaculture: pour une exploitation durable des ressources vivantes de la mer et du littoral. Presses Universitaires de Rennes, Rennes, p. 2006.
Koch EW. 1993. The effect of water flow on photosynthetic process of the alga
Ulva lactuca L. Hydrobiologia. 260:457-462.
Krom, MD, Ellner, S, van Rijn, J, Neori, A, 1995. Nitrogen and phosphorus cycling and transformations in a prototype „„non-polluting‟‟ integrated mariculture system, Eilat, Israel. Mar. Ecol. Prog. Ser. 118, 25–36.
15
Lobban CS, Harrison PJ. 1997. Seaweed ecology and physiology. Cambridge University Press, New York.
Mamatha BS, Namitha KK, Senthil A, Smitha J, and Ravishankar GA. 2007. Studies on use of Enteromorpha in snack food. Food Chemistry .10:1707-1713.
Metaxa E , Deviller G, Pagand P, Alliaume C, Casellas C., Blancheton JP. 2006. High rate algal pond treatment for water reuse in a marine fish recirculation system: water purification and fish health. Aquaculture 252: 92–101.
Msuya EF, Kyewalyanga MS, and Salum D. 2006. The performance of the seaweed Ulva reticulata as a biofilter in a low-tech, low-cost, gravity generated water flow regime in Zanzibar, Tanzania. Aquaculture 254(1–4): 284-292.
Nakada M. 2008. Capture-based aquaculture of yellowtail. In: capture-based aquaculture. Global overview . A. Lovatelli & P.F. Holthus (ed.),. Food and agriculture organization of the united nations, Rome. 199–215 pp. Nelson SG, Glenn EP, Conn J, Moore D, Walsh T, Akutagawa M. 2001.
Cultivation of gracilaria parvispora (Rhodophyta) in shrimp-farm effluent ditches and floating cages in Hawaii: a two phase polyculture system.
Aquaculture 193:239-248.
Neori, A. 1996. The form of N-supply (ammonia or nitrate) determines the performance of seaweed biofilters integrated with intensive fish culture. Isr. J. Aquac. Bamidgeh 48, 19– 27.
Neori A, Chopin T, Troell M, Buschmann AH, Kraemer GP, Halling C. 2004. Integrated aquaculture: rationale, evolution and state of the art emphasizing seaweed biofiltration in modern mariculture. Aquaculture. 231:361-391.
Ohno M, Miyanoue K. 1980. The ecology of the food alga Enteromorpha prolifera. Rep Usa Mar Biol Stn 2:11–17
Ohno M. 1993. Cultivation of the green algae, monostroma and enteremorpha “Aonori”. In: Ohno M, Critchley AT (eds) Seaweed Cultivation and Marine Ranching. JICA, Kanagawa, Yokosuka, Japan.7-15pp.
Pandey RS, Ohno M. 1985. An ecological study of cultivated Enteromorpha. Rep Usa Mar Biol Inst Kochi Univ 7:21–31.
Patadjai RS. 1993. Pengaruh pupuk TSP terhadap pertumbuhan dan kualitas rumput laut Gracilaria gigas Harv. [tesis]. Bogor: Program Pascasarjana, Institut Pertanian Bogor. 83 hlm.
Pérez-Mayorga DM, Ladah LB, Zertuche-González JA, Leichter JJ, Filonov AE, Lavín MF. 2011. Nitrogen uptake and growth by the opportunistic macroalga Ulva lactuca (Linnaeus) during the internal tide. J. Exp. Mar. Biol. Ecol. 406:108–115
Person-Le Ruyet J, Galland R, Le Roux A, Chartois H. 1997. Chronic ammonia
toxicity in juvenile turbot (Scophthalmus maximus). Aquaculture
154:155–171.
16
Schumacher J, Dolch T, and Reise K. 2014. Transisitons in sandflat biota since the 1930s: effects of sea-level rise, eutrophication and biological globalization in the tidal Bay Konigshafen, northern Wadden sea
Helgoland Marine Research 201468:389.
Schuenhoff, A, Shpigel, M, Lupatsch, I, Ashkenazi, A, Msuya, FE, Neori, A. 2003. A semi-recirculating, integrated system for the culture of fish and seaweed. Aquaculture 221, 167–181.
Steel RGD and Torrie JH. 1993. Prinsip dan prosedur statistika: suatu pendekatan biometrik. Edisi Kedua. PT. Gramedia. Jakarta.772 hlm.
Strickland JDH and Parsons TR. 1972. A practical handbook of seawater analysis. Fish. Res. Board Can. 328p.
Timmons MB, Ebeling JM, Wheaton FW, Summerfelt ST, Vinci BJ. 2002. Recirculating aquaculture systems, 2nd edn. Cayuga Aqua Ventures, Ithaca
Troell M, Halling C, Neori A., Buschmann, AH, Chopin, T, Yarish, C, Kautsky, N. 2003. Integrated mariculture: asking the right questions. Aquaculture
226: 69–90.
Takeuchi T. 1988. Laboratory work chemical evaluation of dietary nutrients. In: fish nutrition and mariculture. Watanabe T (ed). Department of Aquatic Bioscience. Tokyo University of Fisheries. 179-225p
18
Appendix 1. ANOVA of daily growth rate of Ulva prolifera with different flow rates
Sum of Squares df Mean Square F Sig.
Between Groups 39,106 2 19,553 791,626 ,000
Within Groups ,074 3 ,025
Total 39,180 5
Appendix 2. Multiple comparisons dependent variable of daily growth rate
(I) flow
*. The mean difference is significant at the 0.05 level.
Appendix 3. Homogenous subsets of daily growth rate
flowrates N Subset for alpha = 0.05
19
Appendix 4. ANOVA of Ulva biomass in every day
Sum of Squares df Mean Square
F Sig. Sum of Squares Day 0 Between Groups ,000 2 0,000 0,42
9
0,686
Within Groups ,001 3 0,000
Total ,001 5
Day 6 Between Groups ,000 2 0,000 . .
Within Groups ,000 3 0,000
Total ,000 5
Day 11 Between Groups 2,225 2 1,113 6,66 7
0,079
Within Groups ,501 3 0,167
Total 2,726 5
Day 15 Between Groups 223,665 2 111,832 11,6 70
0,038
Within Groups 28,748 3 9,583
Total 252,413 5
Day 19 Between Groups 3545,93 9
2 1772,969 32,3 92
0,009
Within Groups 164,204 3 54,735
Total 3710,14
3
5
Day 24 Between Groups 17177,3 33
2 8588,667 757, 824
0,000
20
Appendix 5. Tukey HSD Multiple comparisons of Ulva Biomass Mean
21
Flow rates N Subset for alpha = 0.05
1 2
0,50 2 0,8200
1,00 2 0,8200
1,50 2 0,8350
Sig. 0,728
Means for groups in homogeneous subsets are displayed.
a. Uses Harmonic Mean Sample Size = 2,000.
Appendix 7. Tukey HSF day 11 of Ulva Biomass
Flow rates N Subset for alpha = 0.05
1 2
0,50 2 3,4250
1,50 2 4,3800
1,00 2 4,8950
Sig. ,073
Means for groups in homogeneous subsets are displayed.
a. Uses Harmonic Mean Sample Size = 2,000.
Appendix 8. Tukey HSF day 15 of Ulva Biomass
Flow rates N Subset for alpha = 0.05
1 2
,50 2 9,1400
1,50 2 20,9600 20,9600
1,00 2 22,9850
Sig. ,063 ,803
Means for groups in homogeneous subsets are displayed.
a. Uses Harmonic Mean Sample Size = 2,000.
22
Appendix 9. Tukey HSF day 19 of Ulva Biomass
Flow rates N Subset for alpha = 0.05
1 2
,50 2 9,14
1,50 2 20,96 71,8900
1,00 2 76,7550
Sig. ,063 ,802
Means for groups in homogeneous subsets are displayed.
a. Uses Harmonic Mean Sample Size = 2,000.
Appendix 10. Tukey HSF in day 24 of Ulva Biomass
Flow rates N Subset for alpha = 0.05
1 2
,50 2 42,00
1,50 2 155,00
1,00 2 156,00
Sig. 1,00 ,953
Means for groups in homogeneous subsets are displayed.
a. Uses Harmonic Mean Sample Size = 2,000.
23
Appendix 12. The integrated tank-based aquaculture system for the marine fish and seaweed culture experiments. The right image is a top view of the system.
Appendix 13. Kjeldahl methods
Principle: Boiling the sample in concentrated sulfuric acid to the sample, at the same time decomposition and redox reactions takes place, the nitrogen in the sample changes ammonia. The ammonia contained in the concentrated sulfuric acid in the form of ammonium sulfate was combined with sulfuric acid. This is diluted with water, and distilled by adding an excess of concentrated alkali, leading to ammonia to produce an acid solution of a constant concentration. Then, the excess acid was titrated with standard solution alkaline, and calculates the amount of free ammonia as the amount of nitrogen.
Organic N H2SO4→CO2 H2O (NH4)2SO4
(NH4)2SO4 2NaOH→2NH3 NaSO4 2H2O
*Determine quantity of 2NH3 (underlined part).
a. Equipment
Kjeldahl flask and cracker (BUCHI), nitrogen distillation apparatus, volumetric flask (100ml), titrator
b. Reagents
Concentrated sulfuric acid (36.2N)
Mixed catalyst: Mixed potassium sulfate and copper sulfate (9 : 1) that well-milled in a mortar.
30% NaOH
N/14-NaOH: It is preferable to make little thick. You must seek titer (factor).
N/14-H2SO4: It may make it slightly thinner.
Titration indicator: Methyl red 0.2g and methylene blue 0.1g dissolved in 90% ethanol 100ml, and save in a brown bottle.
24
c. Analysis operation
. Decomposition
Weigh sample in powder paper, as it is wrapped in is placed in the Kjeldahl flask (BUCHI).
Add mixed catalyst about 2g.
Added to concentrated sulfuric acid 10 ml using a dispenser, shaken lightly.
(Shaking lightly addition about 10ml of hydrogen peroxide) ←This is optional.
Start the heating in a fume hood (Heating method is described on the drafter).
2. Confirm the rest of H2Oand NaOH a dangerous drug solutions in each
tank. Prepare enough amounts of those solutions before starting analysis. Please order NaOH solution, if you find the reagent is nearly empty.
30% NaOH solution: Kanto Kagaku Chemical Cat No. 37230-87
3. Confirm the color of water in Scrubber (red-purple). If the water is clear, please make neutralizing solution with Na2CO3 (alkali) and phenolphthalein.
Instruction
Open the faucet until the yellow tape.
Power on (right side)
Preheating (twice in cold season, normally single is enough)
<Distillation of the decomposition solution>
Take 1/14-H2SO4 10mL in 100mL Erlenmeyer flask with a dispenser, and
put a small magnet stirrer.
In this case, the rubber tube must be always immersed in the solution.
Put 10 mL of your sample into BUCHI‟s glass tube with a volumetric pipet.
Set the 100mL Erlenmeyer flask and the glass tube.
Press sample button and find your analysis method. Press start.
After the distillation, remove the Erlenmeyer flask from the device, to the titration immediately.
Repeat − until finish
After finishing, do cleaning twice
25
Close the faucet and power off
Waste liquid must be transferred to 20L waste tank (non-organic) after cooling. 20L waste tank becomes full, transfer to Faculty storage place.
. Titration
Titrating the beaker that has finished distilled at 1 / 14N-NaOH (until become green transparent).
Used magnet can be used after sufficiently washed with DW, to another beaker.
d. Calculation
Crude protein (%) = (blank titration value - sample titration value) × FNaOH ×
6.25*1 / sample weight (g)
Determination of NaOH factor
(Factor using known 1 / 10N-HCl as an example)
Five mL of 1/10N-HCl were taken up in 100 mL beaker, and then appropriately diluted with DW, adding titration indicator few drops.
Titrated with 1 / 14N-NaOH, which were prepared.
<Calculation method>
FNaOH = FHCl ×HCl (ml) / titration value (ml) × 14 × normal for HCl
Can also be used although acids other than HCl, factor must be used those known.
*1
6.25 is a conversion factor of nitrogen-protein, which is generally used in our research field.
26
Appendix 14. The value of the weight, retention, and nitrogen production of yellowtail at different flow rates of seaweed tanks
Variables Flow rates
0.5 L min-1 1.0 L min-1 1.5 L min-1
Feed (g) 778.5 778.5 778.5
N in feed (g) 52.32 52.32 52.32
Start
W fish (g) 566.11 ± 81,51 566.11 ± 81,51 566.11 ± 81,51
W seaweed (g) 0.83 ± 0.02 0.83 ± 0.02 0.83 ± 0.02
N seaweed (g) 0.0074 0.0074 0.0074
End
W fish (g) 600.89 ± 87.79 600.89 ± 87.79 600.89 ± 87.79
N fish (%)* 21.9 21.9 21.9
W seaweed (g) 42 156 156
N seaweed (g) 1.81 6.21 6.50
Retention
Seaweed (g) 1.8026 6.2026 6.4926
Production N in fish (g)
10.97 10.97 10.97
27
BIOGRAPHY