158
PAPER ID - C.1
SPATIAL DISTRIBUTION OF REGIONAL DEVELOPMENT LEVEL USING SPATIAL
AUTOCORRELATION APPROACH (A CASE STUDY: CIANJUR REGENCY, WEST JAVA)
Khursatul Munibah
1, Widiatmaka
2, Hermanu Widjaja
3Faculty of Agriculture, Bogor Agricultural University (IPB) Miranti Street Dramaga, Bogor Indonesia
Email: [email protected], [email protected], [email protected]
Abstract
The increasing of population and economic activities will effect to regional development level that marked by high availability of public facilities and high population. The higher availability of public facilities so it can support human activities well. In this cases, public fasilities like education, healty, economic, social fasilities and accessibilities have function for supporting the economic activities. A region related to another region due to their spatial neighborhood. Likewise, the availability of public facilities on a region will effect to its neighboring regions.
A topographic were found in Cianjur Regency are flat, undulating, hilly until mountainous with range of elevation (0-3000) m above sea level and range of slope flat until very steep (>40 %). This physical condition would effected to availability of public facilities and number of population. Finally, the relationship between them would effected to spatial distribution of regional development level.
Research objectives were (1) to analyze the regional development level based on the availability of public facilities and (2) to identify the spatial distributian of regional development level based on spatial autocorrelation Moran’s Inde . Determining of regional development level based on availability of public facilities using schallogram approach. Variable of public fasilities were grouped into education, healty, economic, social fasilities and accessibilities. Identifying of the spatial autocorrelation on the availability of public facilities using Moran’s Inde approa h. Neighborhood Concept in this research was the sub-regency bordering defined as a neighbor with weighted spatially equal 1, otherwise = 0.
This research concluded that majority of sub-regencies in Cianjur Regency clustered into hierarchy II and III and only 5 of 32 sub-regencies clustered into hierarchy I. It means that the regional development in Cianjur Regency was moderate level. Spatial distribution of regional development level in Cianjur Regency was rather clumped that supported Moran’s Inde = 0, 30 and statistical test where Z(I) = 2,299 more bigger than Z1- α =1,645). This research
recommendated to apply the different concept of neighborhood, like an inverse distance weighting and an length of shared boundary between zones.
Key words: Spatial Autocorrelation, Regional Development, Spatial Distribution, Cianjur Regen , Inde ’s Moran
INTRODUCTION
Background
The increasing of population and economic activities will effect to regional development level that marked by high availability of public facilities and high population. The higher availability of public facilities so it can support human activities well. In this cases, public fasilities like education, healty, economic, social fasilities and accessibilities have function for supporting the economic activities. Some regions can grow more rapidly than others that effect to levels of social welfare (Dawkins, 2003). Besides that, Regional accessibility have a statistically significant effect on the spatial dispersal the area of the activity
space, the total distance traveled and housing prices (Cerda and El-Geneidy 2009).
159 li kages used Mora ’s I de ethod
(Wuryandari et al. 2014).
A topographic were found in Cianjur Regency are lowland until upland. In the lowland can be found coastal area in southern, hilly area in center and northern. While in the upland can be found the Gede volcano in northern and structural mountainous in southtern. Elevation were found in Cianjur Regency are 0 m until around 300 m above sea level with slope range flat to very steep (>40%). This physical condition would effected to availability of public facilities and number of population. Sub-regency on the lowland like Cianjur sub-Regency (Kecamatan) has complete public fasilities for supporting human activities. This phenomenon will effect to regional development level.
Research objectives were (1) to analyze the regional development level based on the availability of public facilities and (2) to identify the spatial distributian of regional development level based on spatial autocorrelation.
MATERIAL AND METHOD
Study Area
The study area (Fig. 1) is Cianjur Regency, West Ja a, I do esia a d has oordi ate of ° ’- 7° ’ S a d ° ’- ° ’ E. The total areas cover 361.435 ha, comprising 32 sub-Regency (Kecamatan). Capital Regency is located in Cianjur sub-Regency.
Figure 1. Location of Study Area
Data and Data Processing
Data that used in this research were administration map with scale 1:50.000 and several tabular data from BPS of Cianjur Regency (2014) and atribute of spatial data (Table 1).
Determining of regional development level based on availability of public facilities using schallogram approach (Table 2). Identifying of the spatial autocorrelation on regional development le el usi g Mora ’s I de approa h.
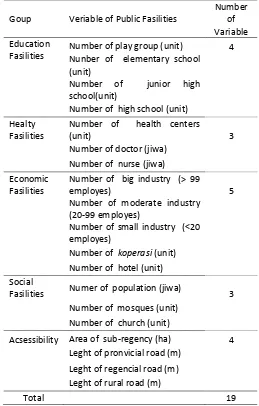
Table 1. Variables for Determining of Regional Development Level
Goup Veriable of Public Fasilities
Number of Variable Education
Fasilities
Number of play group (unit) 4 Nunber of elementary school
(unit)
Number of junior high school(unit)
Number of high school (unit)
Healty Fasilities
Number of health centers
(unit) 3
Number of doctor (jiwa)
Number of nurse (jiwa)
Economic Fasilities
Number of big industry (> 99
employes) 5
Number of moderate industry (20-99 employes)
Number of small industry (<20 employes)
Number of koperasi (unit)
Number of hotel (unit)
Social
Fasilities Numer of population (jiwa) 3 Number of mosques (unit)
Number of church (unit)
Acsessibility Area of sub-regency (ha) 4 Leght of pronvicial road (m)
Leght of regencial road (m)
Leght of rural road (m)
160 Table 2. Step of Schallogram Approach (Rustiadi et al. 2009)
Spatial autocorrelation on the availability of public facilities was calculated by Index Moran formula (O’Sulli a a d U i .
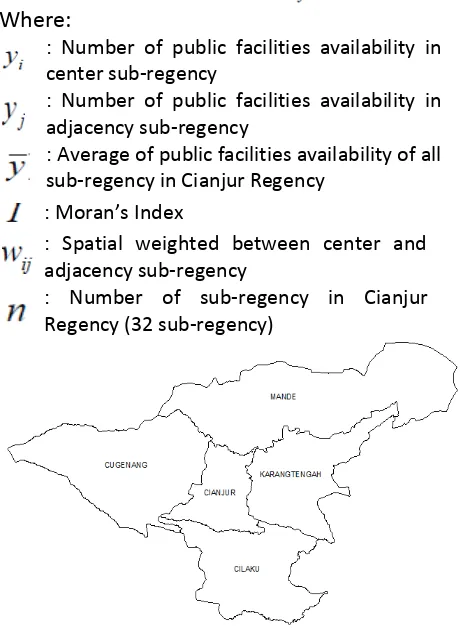
Where:
: Number of public facilities availability in
center sub-regency
: Number of public facilities availability in
adjacency sub-regency
: Average of public facilities availability of all sub-regency in Cianjur Regency
: Mora ’s I de
: Spatial weighted between center and adjacency sub-regency
: Number of sub-regency in Cianjur Regency (32 sub-regency)
Figure 2. Ilustration of Neighborhood Concept
Figure 2. Ilustrates about the concept of neighborhoods, where the districts bordering defined as a neighbor. For example, if Cianjur
District as the center (i) and then Mande, Cilaku, Karangtengah, Cuegenang sub-Regencies were as neighbors (j). In this case, value of wij = 1, otherwise = 0.
The Mora ’s I de supported by tests of significance with a significance level of 5%, indicating that there was a similarity value of the availability of public facilities between the region with its neighboring regions. Formula of significance test (Wuryandari et al. 2014):
i.
Hypothesis
H
0:there is no spatial autocorrelation
H
1: there is spatial autocorrelation
ii.
Significance level (α) = 5%
iii.
Statistical test
Z (I) = �−�(�)
I
E (I) = 1
−1
Var (I) =
2�1− �2+3�2
2−1 �
−
[
� �
]
2S0 = =1 =1
S1 =
1
2
(
+
)
2 =1
=1
S2 =
=1
[
=1+
=1]
2
If value of Z (I) > Z1- α then H0 rejected and H1 accepted. It mean that there is spatial autocorrelatian and vice versa. Distribution pattern of the development region level indicated by the value of Z (I), Z1- α and value of Mora ’s I de . T pes of distri utio patter like spread and clumped.
RESULTS AND DISCUSSION
1. Calculate the capacity of public
facilities in every sub-regency :
K
ij=
K f p
Capacity of public fasilities Number of public fasilities Number of population
2.
Calculate the weight capacity of public facilities in every sub-regency
:
r
j=
�
b
ij=
�
n N r b
Number of public fasilities >0 Number of sub-regency Rasio
Weighted
3. Calculate the availability of public facilities in every sub-regency :
IF
i=
(
−
)
min std IF j i Minimum Standart deviation Availability of public fasilities Type of public facilities Sub-regency (32 sub-regency)4.
Determine the level of region development in every sub-regency
:
Hierarchy I :
IF
i≥
(
+
)
Hierarchy II :
IF
i≥
−
< (
+
)
161 Regional Development Level Based on Public
Facilities Availability
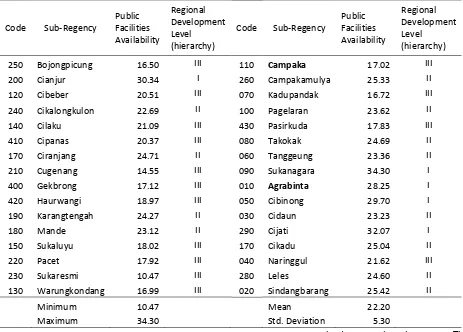
Table 3 shows that 32 sub-regencies in Cianjur Regency Categorized to three clusters based on the availability of public facilities, namely hierarchy I, II and III. The hierarchy levels shows that the smaller hierarchy, the public facilities more available to support the human activities.
There are 5 sub-regencies belong to hierarchy I, namely Cianjur, Sukanagara, Agrabinta, Cibinong and Cijanti. This means that 5 sub-regencies have the public facilities that are capable to support well their human activities. The Cianjur sub-regency is capital of The Cianjur Regency and also the center of economic
activities so that it has become more developed regions than others. While Sukanagara, Agrabinta, Cibinong and Cijanti with a low population so that public facilities still have the ability to support their activities, although the low economic activities.
There are 12 and 15 sub-regencies belong to hierarchy II and III, respectively. The northern of Cianjur Regency dominated by the hierarchy III because high population and low public facilities due to hilly and mountainous topographic. The same topographic were found in the southern of Cianjur Regency however dominated by hierarchy II. This was due to low population and low public fasilities.
Table 3. Index of Public Facilities Availability and Regional Development Level
Code Sub-Regency
Public Facilities Availability
Regional Development Level
(hierarchy)
Code Sub-Regency
Public Facilities Availability
Regional Development Level
(hierarchy)
250 Bojongpicung 16.50 III 110 Campaka 17.02 III
200 Cianjur 30.34 I 260 Campakamulya 25.33 II
120 Cibeber 20.51 III 070 Kadupandak 16.72 III
240 Cikalongkulon 22.69 II 100 Pagelaran 23.62 II
140 Cilaku 21.09 III 430 Pasirkuda 17.83 III
410 Cipanas 20.37 III 080 Takokak 24.69 II
170 Ciranjang 24.71 II 060 Tanggeung 23.36 II
210 Cugenang 14.55 III 090 Sukanagara 34.30 I
400 Gekbrong 17.12 III 010 Agrabinta 28.25 I
420 Haurwangi 18.97 III 050 Cibinong 29.70 I
190 Karangtengah 24.27 II 030 Cidaun 23.23 II
180 Mande 23.12 II 290 Cijati 32.07 I
150 Sukaluyu 18.02 III 170 Cikadu 25.04 II
220 Pacet 17.92 III 040 Naringgul 21.62 III
230 Sukaresmi 10.47 III 280 Leles 24.60 II
130 Warungkondang 16.99 III 020 Sindangbarang 25.42 II
Minimum 10.47 Mean 22.20
Maximum 34.30 Std. Deviation 5.30
Spatial Distribution of Regional Development Level
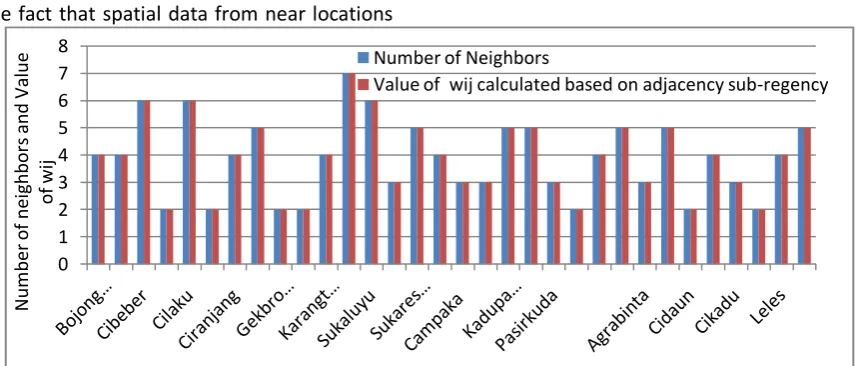
Number of Neighbors and Value of Weighted Spatially
In a spatial analysis to determine the presence of spatial autocorrelation, the main
162 neighbors would be same with value of weighted
spatially (wij=wji).
Based on Figure 3 showed that Mande sub-regency has the maximum neighbor (7) while Cibeber, Cilaku, Sukaluyu have 6 neighbors and others have 2 until 5 neighbors. The number of neighbors will increase the value of auto orrelatio Mora ’s I de .
Value of Spatial Autocorrelation
Spatial autocorrelation is a technical term for the fact that spatial data from near locations
are more likely to be similar that data from dista t lo atio s O’Sulli a a d U i . Tobler (1970) claims that everything is related to everything else, but near things are more related than distant thing. Because objects are spatially related, each observation is longer independent. Mora ’s I de is o e of analysis techniques for knowing the spatial autocorrelation between observed locations.
Figure 3. Number of Neighbors and Value of Weighted Spatially
0 1 2 3 4 5 6 7 8
Num
ber
o
f
nei
g
hbo
rs
an
d
V
al
ue
o
f
wi
j
Number of Neighbors
163 Figure 4. Spatial Distribution of Sub-Regency
Development Level
Based on calculation of Index Moran formula obtained that I (Index Moran) is 0,3. It indicates a fairly positive autocorrelation between levels of regional development in neighboring sub-regencies. This result supported by statistical test, where Z(I) = 2,299 more bigger than Z1- α (1,645). It means H0 rejected and H1 accepted that showed present of spatial autocorrelation. In other words, the spatial distribution of the regional development level was rather clumped (Figure 4).
The other research that support the result a o e area Mora ’s Index on Bush votes in USA = 0.41 which indicated a fairly strong positive correlation (O’Sulli a a d U i . Mora ’s Index on unemployment in Semarang Regency, Central Java was 0.0614 which indicated a positive spatial autocorrelation but very small
correlation (Wuryandari et al. 2014).
CONCLUSION AND RECOMMENDATION
This research concluded that majority of sub-regencies in Cianjur Regency clustered into hierarchy II and III and only 5 of 32 sub-regencies clustered into hierarchy I. It means that the regional development level in Cianjur Regency was moderate. Spatial distribution of regional development level in Cianjur Regency was rather lu ped that supported Mora ’s I de = , and statistical test where Z(I) = 2,299 more bigger than Z1- α =1,645).
This research recommendated to apply the different concept of neighborhood, like an inverse distance weighting and an length of shared boundary between zones.
REFERENCES
164 Cerda A. and El-Geneidy A.M. 2009.
Understanding the Relationships Between Regional Accessibility Travel Behaviour and Home Values. School of Urban Planning McGill University. Canada.
Dawkins C.J. 2003. Regional Development Theory: Conceptual Foundations, Classic Works, and Recent Developments. Virginia. Sage Publications.
Rustiadi E, S. Saefulhakim S and D.R. Panuju. 2009. Regional Planning and Development. Jakarta [ID]. Cresspent Pr. O’Sulli a D. a d D.J. U i , . Geographi
Information Analysis. United State of America [USA]. John Wiley & Sons, INC. Tobler W.R. 1970 A Computer Movie Simulating
Urban Growth in the Detroit Region Economic Geography. 46:234-240. Wuryandari T, A.Hoyyi, D.S.Kusumawardani and
D.Rahmawati. 2014. Identification of Spatial Autocorrelation on Number of Unemployment in Central Java Using Mora ’s I de . Media Statistics 2(1):1-10.