THE DEVELOPMENT OF SPATIAL DECISION SUPPORT SYSTEM
FOR INDUSTRIAL WASTE WATER MONITORING
(A CASE STUDY: UPPER CITARUM RIVER BASIN, WEST JAVA)
Budi Susetyo G051040101
GRADUATE SCHOOL
THE DEVELOPMENT OF SPATIAL DECISION SUPPORT SYSTEM
FOR INDUSTRIAL WASTE WATER MONITORING
(A CASE STUDY: UPPER CITARUM RIVER BASIN, WEST JAVA)
Budi Susetyo G051040101
A Thesis submitted to the degree Master of Science of Bogor Agricultural University
MASTER OF SCIENCE IN INFORMATION TECHNOLOGY
FOR NATURAL RESOURCE MANAGEMENT
GRADUATE SCHOOL
STATEMENT
I, Budi Susetyo, here by stated that this thesis entitled:
The Development of Spatial Decision Support System for Industrial Waste Water Monitoring System (A Case Study: Upper Citarum River Basin, West Java)
are results of my own work during the period of April 2006 until July 2007 and that it has not been published before. The content of the thesis has been examined by the advising committee and the external examiner.
Bogor, September 2007
ACKNOWLEDGEMENTS
Alhamdulillahirrabbil ‘alamien, I would like to express my thanks to Allah the Almighty God, who gives me strength, knowledge and inspirations every time. Without His Grace, Help and Guide, this thesis will never come into being.
I would like to express my gratitude to the University of Ibn Khaldun Bogor (UIKA Bogor) for supporting me to continue my study at the Master of Information Technology for Natural Resource Management (MIT), Bogor Agricultural University.
I would like to express my thanks to my supervisor Prof. Dr. Ir. Kudang B. Seminar, MSc., who has mainly supervised my thesis during research work until reporting. His guidance, encouragement, extensive knowledge and creative thinking is very valuable in finishing the thesis.
I would like also to thank Dr. Yuli Suharnoto, MSc. as Co-supervisor, who has encouraged me to generate and improve the idea toward logically research. Moreover, I am indebted to my External Examiner, Dr. Ir. Setyo Pertiwi, MAgr., who has a lot of constructive comments and discussion to review my research process to become a complete thesis especially related to the method, analysis and writing.
I would like to express my sincere gratitude to MIT Program Coordinator, Dr. Tania June, who has facilitated the research and also to all of MIT Students.
the user of the system; and also Mr. Yahya as a professional reader, who is very concern to help me write this thesis.
I am obliged to many persons at MIT secretariat especially to Mr. Bambang Sulistio and Miss Devi, who support all of the MIT students to finish the courses.
I would like to dedicate this thesis to my lovely wife, Reni Handayani and all of my children, Muhammad Taufiqurrahman, Amrina Husna Salimah, Hanif Hidayaturrahman, and Qonita Nailurrahmah, who have shown their patient, psychological support, understanding, encouragement and for their prayers. Without their sincere support, I never could have finished this thesis.
Finally, my appreciation should go to my parents and my sibling, who have given more pay attention and encouraged me to continue my study. Hopefully this thesis would be valuable to me, useful for every one and mankind’s life. Thank you very much for all.
CURRICULUM VITAE
The Author, Budi Susetyo was born on January 20th 1966 in Semarang, Central Java. He is the youngest son of M. Soewignyo and Sriwidati. His educational background is as follows, studied at the elementary school, SD Kanisius Genuk; Junior High School, SMP N 1; and Senior High School, SMA N 1 and passed in 1984, all of the schools are located in Ungaran, Central Java. Then he studied at the Bogor Agricultural University and received his Ir degree from the Agro-meteorology Study Program in 1991. Since 1991 he worked as professional consultant in several consulting companies until 1998. He took a short course program on Environmental Impact Assessment (Amdal Certificate A and B) in 1993. He experienced in many sectors related to his background (environmental science which is supported by information technology). He has done a several system designs and development such as (1) Cooperation Information System (SIMKOP), (2) Human Development Index Information System (SI-IPM), (3) Database System of Development Planning for Bappeda (SIDANOS), (4) Information system of Imbal Swadaya Management Project (SIMPIS), etc.
ABSTRACT
BUDI SUSETYO (2007). The Development of Spatial Decision Support System for Industrial Waste Water Monitoring (A Case Study: Upper Citarum River Basin, West Java). Under supervision of KUDANG B. SEMINAR and YULI SUHARNOTO.
The study aims to make an industrial pollution monitoring application system as a prototype system, called IWMS System (Industrial Waste Water Monitoring Support System). IWMS System should give some spatial information to support the government decision for the industry monitoring. It is designed in accordance with industrial profile, pollution monitoring reports and the Government Regulation in the format of Water Quality Standard.
Upper Citarum River Basin is selected as the study area due to: (1) The river is one of the high priorities river basin in Indonesia, (2) The region covers the Capital City of West Java, which has a lot of important activities, (3) Many industries are located in this river basin with negative impacts that should be managed, (4) The subject of study should not be too wide, and can be implemented to the other river basins especially in Indonesia; and (5) There is a specific management to achieve the sustainable development, without disruption to the economic growth in this area.
The objectives of this study are: (1) To develop the DSS of industrial wastewater monitoring system as an application system to support the Government Decision, and (2) To implement the IWMS as a prototype of the system.
Visualization of Monitoring Site, Comparing the Chart Pattern, Identifying Polluted Industry, Identifying Polluted River, Findings of Industrial Compliance Level, Findings of the Priority Scale of River, Quick Response of Environmental Cases, Findings of the Potential of Polluted Industry, Water Intake and Exploration Control, Reward & Punishment based on Possessing of License, Reward & Punishment based on Possessing of Environmental Document, and Estimation of BOD Potential (sources).
Research Title : The Development of Spatial Decision Support System for Industrial Wastewater Monitoring (A Case Study: Upper
Citarum River Basin, West Java) Name : Budi Susetyo
Student ID : G051040101
Study Program : Master of Science in Information Technology for Natural Resources Management
Approved by, Advisory Board
Prof. Dr. Ir. Kudang Boro Seminar, MSc. Dr. Ir. Yuli Suharnoto, MSc.
Supervisor Co-Supervisor
Endorsed by,
Program Coordinator Dean of the Graduate School
Dr. Ir. Tania June, MSc. Prof. Dr. Ir. Khairil A. Notodiputro, MS
TABLE OF CONTENTS
STATEMENT ... i
ACKNOWLEDGEMENT ... ii
CURRICULUM VITAE ... iv
ABSTRACT ... v
TABLE OF CONTENTS ... vii
LIST OF TABLES ... xii
LIST OF FIGURES ... xiii
LIST OF APPENDIXES ... xvi
I. INTRODUCTION ... 1
1.1 Background ... 1
1.2 Objectives ... 2
1.3 Problem Identification ... 3
1.4 Location ... 3
1.5 Outcome ... 4
1.6 Expected Benefit... 5
1.7 Scope of Research ... 5
II. LITERATURE PREVIEWS ... 6
2.1 Information System ... 6
2.2 Tools for Analysis ... 8
2.2.1 Decision Support System ... 8
2.2.2 Database Model ... 13
2.2.3 Geographic Information System ... 14
2.3 Industrial Pollutions ... 17
2.4 Water Pollutants ... 19
2.5 Storet Method ... 19
2.6 Global Pollution Policy ... 20
2.8 The Statement of Clean River (Superkasih) ... 21
2.9 System Development ... 22
2.10 The Sta ge of Activity ... 24
III. METHODOLOGY ... 26
3.1 Need Assessment ... 26
3.2 User Identification ... 27
3.3 Data Collection Method ... 27
3.4 Time & Location ... 28
3.5 Database ... 29
3.6 Graphical User interface ... 31
3.7 Hardware & Software Requirement ... 32
3.8 Source of Data ... 32
3.9 Public Perception Processed With Fuzzy Method... 33
3.10 Water Quality Standard ... 35
3.11 Water Quality Evaluation ... 35
3.11.1 The Government Regulation ... 36
3.11.2 River Water Quality ... 36
3.11.2.1 Parameter of the Water Quality ... 36
3.11.2.2 Determination of Water Quality Parameter ... 36
3.11.2.3 Grouping of Water Quality Characteristics ... 36
3.11.2.4 Monitoring the Water Quality ... 37
3.11.3 Evaluation of Water Quality Status ... 38
3.11.3.1 Evaluation of Water Class & Status ... 38
3.11.3.2 Evaluation of Water Quality Status Using Storet Method ... 39
3.11.3.3 Evaluation of Water Quality Status Using Pollution Index Method ... 41
3.11.3.4 Calculation Sample of Pollution Index ... 42
3.11.3.5 Water Quality Monitoring ... 42
3.11.3.6 Industrial and Other Activities with Waste Water Effluent ... 43
3.12 Location of Wastewater Monitoring ... 43
3.12.1 Information of Monitoring Site ... 43
3.12.2 Record of Monitoring Site Location ... 44
3.13 Parameter of Wastewater Quality ... 44
3.14 Quality Standard and Wastewater Quality Status ... 45
3.14.1 Standard of Waste-water Quality ... 46
3.14.2 Status of Waste-water Quality ... 46
3.15 Development of River Basin Map ... 46
3.15.1 Use of Table Field of Monitoring Site as GIS Component... 46
3.15.2 Map Scale ... 48
3.16 Output Design ... 49
3.16.1 Non Spatial Output... 49
3.16.2 Spatial Output ... 49
IV. RESULTS AND DISCUSSION ... 50
User Requirements ... 50
Existing Conditions ... 50
Non-Spatial Database Analysis ... 51
Conceptual Design ... 52
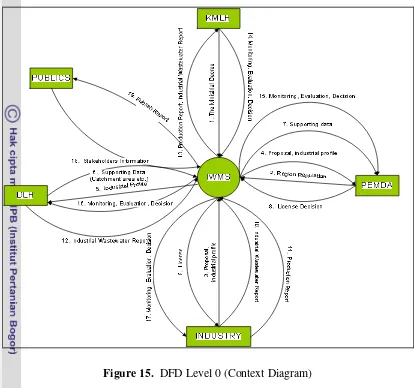
DFD Level 0 (Context Diagram) ... 52
DFD Level 1... 54
Entity Relationship Diagram ... 55
Logical Design ... 58
Physical Design ... 60
Spatial Design ... 60
Conceptual Design - ERD ... 60
Logical Design ... 61
Physical Design ... 62
Data Availability ... 63
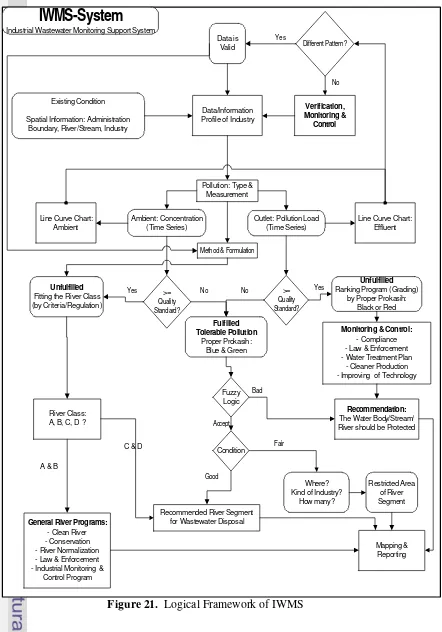
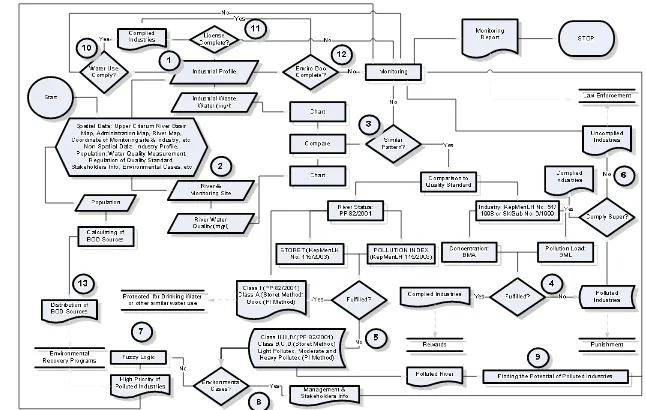
Logical Framework ... 64
Capabilities of The System ... 67
System Implementation... 72
Conventional Security ... 72
Main Menu & Sub Menu ... 73
The Database Systems ... 74
License and Certificate Information ... 76
Industrial Groups... 78
Water Resources ... 78
Industrial Type ... 79
Industrial Production And Market ... 79
Water Treatment Plants ... 80
Ranking Programs ... 81
Environmental Document ... 82
Environmental Management ... 82
River Information... 83
Monitoring Site ... 83
Stakeholders Information ... 84
Cases of Environmental Problems ... 85
Superkasih & Level of Compliance ... 85
Regulation ... 88
River Water Quality Standard ... 89
Industrial Waste-water Quality Standard ... 89
Evaluation And Analysis ... 90
Evaluation of River Pollution ... 90
Industrial Pollution Status ... 92
Fuzzy Logic Analysis... 94
Spatial Information ... 97
Searching The Industry Location ... 97
Layer Editing... 98
River Name Editing ... 99
Industrial Profile ... 99
Monitoring Site ... 100
Evaluation of River Pollution Status ... 100
Evaluation of Industrial Pollution Status ... 101
Searching The Potential Polluted Industries ... 101
Distribution of BOD (source) ... 103
Other Information Layers... 104
Data Communication ... 105
V. CONCLUSION AND RECOMMENDATION ... 107
Conclusion ... 107
Recommendation ... 108
REFERENCES ... 109
LIST OF TABLES
Table 1. Supports provided by DSS (Turban, 1995)... 13
Table 2. Computerized support for decision making (adopted from Turban, 1995) ... 16
Table 3. Relationships between Emitter and Receptor ... 20
Table 4. Question from need assessment ... 26
Table 5 Software Components will be Used... 32
Table 6. Five alternatives for River Segment Evaluation ... 33
Table 7. Purpose of Water Quality Monitoring and Time Period (BPLHD, 2006) ... 37
Table 8. Monitoring Parameters Selection (BPLHD, 2006) ... 38
Table 9. Class of Water and the Usage (PP 82/2001) ... 39
Table 10 Scoring Procedure of Water Quality Parameters (BPLHD, 2006) ... 40
Table 11. Relation Between Score and Water Quality Status (BPLHD, 2006) ... 40
Table 12. Relation Between Score and Water Quality Status ... 42
Table 13. Sample of Geodetic Coordinate ... 47
Table 14. Logical Design for Some Entity ... 58
Table 15. Spatial Logical Design ... 61
LIST OF FIGURES
Figure 1. Study Area ... 4
Figure 2. Components of Information Systems ... 6
Figure 3. DSS as a part of Information System ... 7
Figure 4. Conceptual model of DSS ... 9
Figure 5. A conceptual model of generation of pollution ... 18
Figure 6. Specific Impact in This Research ... 19
Figure 7. System Development Life Cycle - SDLC ... 23
Figure 8. Prototyping Development Stages ... 24
Figure 9. Stage of System Development... 28
Figure 10. Stage of Database Structuring ... 28
Figure 11. Research Location ... 29
Figure 12. Database Design Step ... 29
Figure 13. Hybrid system design ... 31
Figure 14. Logical Framework for IWMS-System ... 52
Figure 15. DFD Level 0 (Context Diagram) ... 53
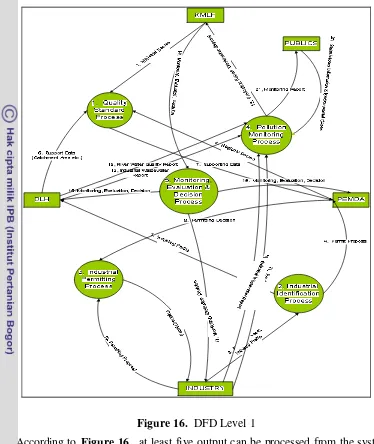
Figure 16. DFD Level 1 ... 55
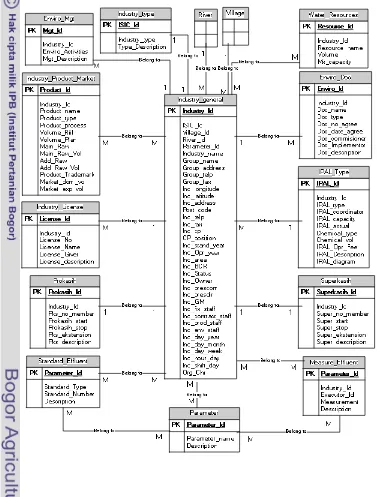
Figure 17.a. ERD of IWMS Database... 56
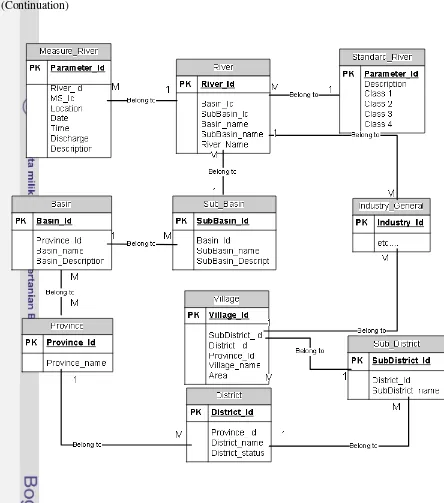
Figure 17.b. ERD of Region and River Related to The Industry ... 57
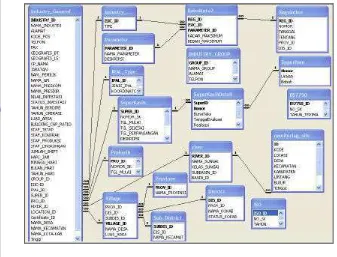
Figure 18. Implemented Relationship of non-spatial data in Microsoft Access ... 58
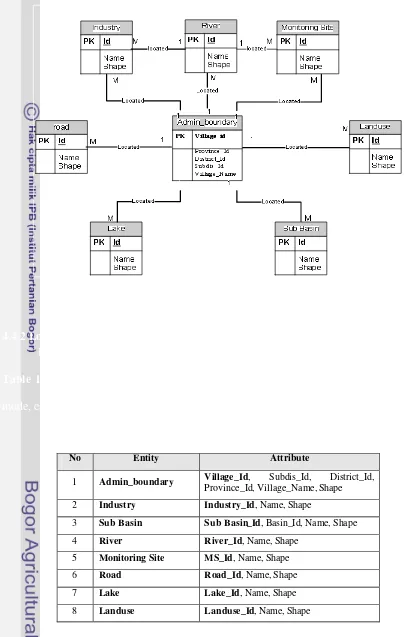
Figure 19. Spatial Entity Relationship Diagram ... 63
Figure 20. Physical Model in ESRI Shape Format (ESRI) ... 67
Figure 21. Logical Framework of IWMS ... 66
Figure 22. Diagram of System Capabilities ... 69
Figure 23. Username & Password... 72
Figure 24. View of System ... 72
Figure 25. Edit Username & Password ... 72
Figure 26. View of the Main Menu and Sub Menu ... 73
Figure 27 Industrial Database ... 75
Figure 29. Information of Permitted Location ... 76
Figure 30. License Information... 77
Figure 31. Information of Certificates ... 77
Figure 32. Group of Industry ... 78
Figure 33. Information of Water Resources... 78
Figure 34. Information of Type of Industry (ISIC) ... 79
Figure 35. Information of Product & Market... 80
Figure 36. Information of Raw Material ... 80
Figure 37. Information of Water Treatment Plant (IPAL) ... 80
Figure 38. Edit IPAL (Detailed Information) ... 81
Figure 39. Information of Ranking Programs ... 81
Figure 40. Information of Environmental Document ... 82
Figure 41. Information of Environment Management ... 82
Figure 42. Information of River ... 83
Figure 43. Information of Monitoring Site ... 83
Figure 44. Edited Form of Monitoring Site ... 84
Figure 45. Stakeholders Information ... 84
Figure 46. Information of Cases Management... 85
Figure 47. Items of Super Evaluation ... 86
Figure 48. List of Super Participant ... 86
Figure 50. Edit of Superkasih Content ... 87
Figure 51. Calculation of Super Compliance ... 88
Figure 52. Recapitulation of Super Compliance Evaluation... 88
Figure 53. Information of River Water Quality Standard ... 89
Figure 54. Regulations of Industrial Waste-water Quality Standard ... 89
Figure 55. Choosing the Parameters ... 90
Figure 56. Calculating of River Pollution Status using PI Method ... 91
Figure 57. Calculating of River Pollution Status using Storet Method ... 91
Figure 58. Chart of River Pollution Status (S. Cilamaya) ... 92
Figure 59. Evaluation of Industrial Pollution... 93
Figure 60. Waste-water Pollution Status of PT. KTSM ... 93
Figure 61. User Interface of Fuzzy Logic ... 94
Figure 63. Calculating of Pollution Status by using Pollution Index (PI) ... 95
Figure 64. Result using Storet Method ... 96
Figure 65. Result using PI Method ... 96
Figure 66. Analysis of Stakeholders Opinion by Using Fuzzy Logic ... 96
Figure 67. Map of Citarum River Basin ... 97
Figure 68. Spatial Information of Industrial Profile ... 98
Figure 69.a. Layer Editing ... 98
Figure 69.b. Layer Editing ... 99
Figure 70. River Name Editing ... 99
Figure 71 Pop Up Database of Industry from Spatial Map... 100
Figure 72. Profile of Monitoring Site... 100
Figure 73. Evaluation of River Pollution Status ... 101
Figure 74. Evaluation of Industrial Pollution Status ... 101
Figure 75. Input The Predicted of Polluted Area (Radius in Km’s) ... 102
Figure 76. Spatial Analysis of Industry around polluted river (5 km’s) ... 103
Figure 77. Distributed Potential BOD’s (Source) ... 103
Figure 78. Additional Information Using ”Add Layer”... 104
Figure 79. Sample Maps As A Maps Explorations ... 105
Figure 80. Utility for export file to other format... 105
Figure 81. Export-Import Utilities ... 106
LIST
OF
APPENDIX
I. INTRODUCTION
1.1.
Background
Natural resources exploitation and sustainable development are two main extreme poles which have interdependence between those two items, within their negative or positive impact. There are two main keywords in this discussion, e.g. environmental and economic perspectives, where both of them should be in balance. It is not easy to keep it in balance; usually the imbalance situation is caused by over exploitation, limitation of resources (or carrying capacity) and may be the weaknesses of environmental management itself. The imbalance situation is usually triggers to the occurrence of negative impacts. To prevent negative impacts, the environmental management is required, especially for the production activity in industrial sector.
The Ministry of Environment has issued the environmental programs, especially for controlling water pollution content from industry through Clean River Program (Prokasih). The aims of Prokasih are to improve the river water quality and to protect the river function based on the class usage. But at the time of study, the Government still doesn’t have a sound application system instrument supporting for monitoring toward achieving the goal (by efficiency, effectiveness and powerfully monitoring to the industrial pollution, etc).
This study is aimed to develop an industrial wastewater monitoring application system, called IWMS System (Industrial Wastewater Monitoring Support System). IWMS System should give some spatial information to support the government decision for the industry monitoring (Spatial Decision Support System). It is designed upon industrial profile, pollution monitoring reports and the Government Regulation in the format of Water Quality Standard.
In the study also, the source of pollutant will be bounded only from industry considering that they are giving the highest contribution of water pollution in the river. The other reason, most of the industries discharge some waste water to the river everyday, and also some industry still didn’t have waste-water treatment plan or may be not installed yet. The focus of research only on industry and its pollution in the Upper Citarum River Basin as a case study, but should be replicated to another river basin, especially in Indonesia.
1.2 Objectives
The objectives of this study are:
(2)To implement the IWMS as a prototype of the system
1.3. Problem Identification
Main issues for industrial wastewater pollutions are:
(1)Most of the industry discharges its waste water to the river without any controllable measure.
(2)Majority of peoples rely on a river as water resource supplies to fulfill their daily need, as a consequence they are very concern about river water quantity and quality.
(3)The river must be protected and conserved by the government, through the control of industrial activities by imposing regulation and do regular monitoring.
(4)At the time of study, the government didn’t have a sound application system to monitor industrial waste water pollution in the location of study.
According the above problem identifications, the government needs some system application to support the decision for controlling the industrial wastewater and their activities.
1.4. Location
Upper Citarum River Basin is selected as the study area, due to: (1)The river is one of the high priority river basin in Indonesia,
(2)The region cover the Capital City of West Java, which have a lot of the important activities
(4)The subject of study not too wide, and can be replicated to the other river basin especially in Indonesia.
(5)There is a special management to achieve the sustainable development, without disruption to the economic growth in this area.
Figure 1. Study Area
1.5. Outcome
1.6. Expected Benefit
The expected benefit of this research as follow:
(1)Able to support the information of industrial profile and environmental status (2)Able to do spatial analysis of industry distribution and river pollution.
(3)Able to get information of the polluted industry and river status
1.7 . Scope of Research
II. LITERATURE REVIEW
To Develop the Spatial DSS and Information system needs several theories: (1) Information System, (2) Decision Support System, (3) System Development Life Cycle, (4) Geographical Information System, (5) Database, (6) Industrial Pollution, (7) Water Pollutant, and (8) The Government Regulation of Environmental Management. This section presents several theories applied in this research.
2.1 Information System
An information system is an organization of people, hardware, software, communication networks and a data resource that collects, transforms, and disseminates information in organization (O’Brien, 2002).
Figure 2 show that there are five components of information systems, i.e. (1) people, (2) software, (3) hardware, (4) data and (5) network resources. According to
O’Brien (2002), people resources include end-user (people who are use an information systems or the information it produces) and information system specialist (people who develop and operate information systems). Hardware resources include all physical devices and materials used in information processing. Software resources include all sets of information processing instructions. Data is more than the raw material of information and includes wide variety of data type, how the data be organized (database) and knowledge bases. Network resources emphasize that communication network are a fundamental resource component of all information systems and include communication media and network support.
The Study is focusing on the two segments of Information System components, i.e. software and data resources. The concepts of software includes not only the sets of operating instruction called programs, which direct and control computer hardware, but also the sets of information processing instructions needed by people, called procedures. Data are vital organizational resources that should be managed. Most organizations could not survive without quality data about their internal operations and external environment.
2.2. Tools for Analysis
2.2.1. Decision Support System
Turban (1995) stated that decision support system is an interactive, flexible and adaptable computer based information system, especially developed for supporting the solutions of a non-structured management problem for improved decision making. A Decision Support System allows decision-makers to combine personal judgment with computer output, in a user-machine interface, to produce meaningful information for support in a decision-making process. Such systems are capable of assisting in solution of all problems (structured, semi -structured and unstructured) using all information available on request. They use quantitative models and database elements for problem solving and an integral part of the decision-maker’s approach to problem identification and solution (Simonovic, 1998).
By definition, decision-making is a process of choosing among alternative courses of action for the purpose of achieving a goal or goals (Turban 1995). Managerial decision-making is synonymous with the whole process of management: planning, directing, controlling, and organizing which involves a series of decision-making activities. Decision Support System (DSS) is an interactive, flexible and adaptable Computer-Based Information System (CBIS), specially developed for supporting the solution of a particular management problem for improved decision-making (Turban 1995).
human judgment in the performance of tasks that have elements, which cannot be specified in advance. Actually, there are many definitions of a DSS. There is a general agreement that these systems focus on decisions and on supporting rather than replacing the user's decision-making process. There is also a general consensus in the definitions of DSS that both database and model components are usually required to fully support decisions. Many of today's DSS focus on problem solving rather than on supporting the modeling process, but the main goal of a DSS should be to provide decision makers with tools for interactively exploring, designing and analyzing decision situations. Users should be able to perform the following functions: they can analyze decision situations according to their personal styles and knowledge; they can build and compare various quantitative models; they can adapt these models to changing conditions; can evaluate different aspects of their activities using a variety of different means (Terfai and Schrimpf, 2004).
DSS is composed of several software components: Data Management, Model Management, Communication (Dialog) Subsystem, and Knowledge Management (Turban, 1995):
(1)Data Management: The data management includes the database which contains relevant data for the situation and is managed by software called database management system (DBMS), where DBMS containing relevant data and computer program utilities to manage a database.
(2)Model Management: A software package that includes various models: statistics, mathematics, economics, environmental, qualitative models that provide system’s analytical capabilities. Model Management System, Modeling Langua ge, Model Directory, Model Execution, Integration, and Command or other quantitative models that provide the system’s analytical capabilities and an appropriate software management
(3)Dialog Management: includes user interface that enables easy, interactive and communicative interaction between users and DSS. Dialog Management is managed by software called dialog management system (DGMS).
(4)Knowledge Management: a subsystem that supports logical interconnection and integration between data and model management. This optional subsystem can support any of the other subsystem or act as an independent component.
Within the framework of management information systems (Mittra in Simonovic, 1998) the DSS has four primary characteristics:
(2)It is flexible and responds quickly to questions; (3)It provides “what if” scenarios; and
(4)It considers the specific requirements of the decision-makers.
In the period since DSS came to prominence there has been considerable growth in the importance of geographic information systems (GIS). This growth in GIS reflects the decreased cost of the required technology and the increasing availability of appropriate spatial data. Recent improvements in mainstream computer technologies facilitate this spread of the use of spatial data. These include inexpensive gigabyte sized hard disks, large high-resolution color monitors, graphics accelerators and CD-ROM storage. This explosion in the use of computer technology can also be seen in other areas, where a virtuous circle of declining hardware costs leads to larger software sales and therefore reduced software costs.
A DSS is an interactive, flexible, and adaptable CBIS, specially developed for supporting the solution of a non-structured management problem for improved decision making. It utilizes data, it provides easy user interface, and it allows for the decision maker’s own insights. DSS may utilize models, is built by an interactive process (frequently by end-users), supports all the phases of the decision-making, and may include a knowledge component.
Most DSS have some of the following ideal features (Turban 1995): (1) Supporting structured, semi -structured, and unstructured problems by bringing human judgment and computerized information, (2) Supporting various managerial levels, ranging from top executive to line managers, (3) Supporting individuals as well as groups (organizations), (4) Supporting interdependent and/or sequential decisions, (5) Supporting all phases of decision process: (a) intelligence, (b) design, (c) choice, (d) implementation, (6) Supporting a variety of decision making processes and styles, there is a fit between the DSS and the attributes of the individual decision makers (e.g., the vocabulary and decision style), (7) Adaptive over time and easy to use, and (8) Utilizing models and knowledge.
sources, formats, and types. Decision makers can make better, more consistent decisions in a timely manner.
Several benefits of DSS can be enumerated as follows: (1) Ability to support fast and objective solution of problems, (2) Ability to explore several alternative solutions under different strategies under different configurations, (3) New insights and learning, (4) Improved management control and performance, (5) Cost savings, (6) Reusable and replicable: DSS can be reused for solving similar problems and be replicated for many users, and (7) Improved workgroup cooperation.
Table 1. Supports provided by DSS (Turban, 1995)
DSS Support Answers to Questions:
Raw data and status access What is…?
General analysis capabilities What is/Why? …
Representation models What will be? …
Causal models (forecasting, diagnosis) What will be/ Why? …
Solution suggestions, evaluation What if/How? …
Solution selection What is best? What is good enough? …
2.2.2 Database Model
constraints. The various database models can be specified into thee groups: object-based logical models, record-based logical models, and physical models.
2.2.3 Geographic Information System
A Geographic Information System (GIS) is a specific information system applied to geographic data and mainly referred to as a system of hardware, software and procedures designed to support the capture, management, manipulation, analysis, modeling and display of spatially-referenced data for solving complex planning and management problems (Burrough, 1986). A geographical Information System (GIS) is a powerful for handling spatial data. It is used for storing, retrieving, maintaining, manipulating, analyzing, and producing the digital format of spatial data. Moreover, it could produce a spatial data in a hardcopy format (Aronoff, 1991).
GIS applications have been developed for wider application of digital data; encourage more sectors to invest in GIS technology that can be run on their existing computer. The growth of GIS application has been paralleled by the extraordinary gains of computer performance. Furthermore, the range of commercially available products of information technology that candidate for the implementation of a GIS has widened, including CAD (computer assisted drafting), DBMS (database management system), geo-processing, remote sensing, GPS (global positioning system), Multimedia, network communication and EDI (electronic data interchange).
There are three important stages of working with geographic data (de By, 2000): (1)Data entry. The early stage in which data about the study phenomenon is collected and
prepared to be entered into the system.
(2)Data analysis. The middle stage in which collected data is carefully reviewed, and for instance, attempts are made to discover patterns.
(3)Data presentation. The final stage in which the results of earlier analysis are presented in an appropriate way.
GIS is gaining importance and widespread acceptance as a tools for decision support in land, infrastructure, resources, environmental management and spatial analysis, and in urban and regional development planning. With the development of GIS, environmental and natural resource managers increasingly have at their disposal information systems in which data are more readily accessible, more easily combined and more flexibly modified to meet the needs of environmental and natural resource decision making. It is thus reasonable to expect a better informed more explicitly reasoned, decision-making process. But despite the proliferation of GIS software systems and the surge of public interest in the application of the system to resolve the real world problems, the technology has commonly seen as complex, inaccessible, and alienating to the decision makers (Sharifi, 2002).
Table 2. Computerized support for decision making (adopted from Turban, 1995)
Phase Description Traditional Tools Spatial
Tools Early Compute, “Crunch Numbers”,
Summarize, Organize
Early computer programs, Management Science Models
Computerized Cartography
Intermediate Find, Organize & Display Decision Relevant Information
Database Management System, MIS
Workstation GIS Current Perform Decision relevant computations
on decision relevant information: organize and display the results, Query based and user friendly approach, “What If “ analysis
Financial Models, Spreadsheets, trend, exploration, operations research models, Decision Support System
Spatial Decision Support System
GIS software is becoming increasingly suitable for use as a generator for a SDSS. As GIS designers gain a greater awareness of decision-making possibilities, their systems will be designed to facilitate interaction with models. GIS software provides a sophisticated interface for spatial information. Even limited functionality GIS software will provide the ability to zoom and to display or highlight different features. GIS provides database support that is designed to allow for the effective storage of spatial data. Furthermore GIS software provides a link between the interface and database to allow the user to easily query spatial data.
2.3 Industrial Pollutions
Scientists tend to define pollution differently to economist. For the economist, pollution is an external cost and occurs only when one or more individuals suffer a loss of welfare (Pearce, et. al. 1990). Even then, economist do not typically recommend the elimination of externality become they argue that the optimal externality is not zero (Pearce, et. al, 1990). The idea of “zero pollution” is not, however, absurd. At least two considerations make it more reasonable than it appears at first sight. These are (a) the fact that the environment tends to have positive assimilative capacity, and (b) the fact that it is possible, to some extent, to divorce economic activity from waste flows. Affecting the environment by introducing pollution abatement (Pearce, et. al, 1990).
Despite the obvious benefits of industrial development, it frequently results in damage to the environment and human health. According to Faisal et.al. (2000), industries cause environmental degradation throughout the life cycle of a product starting from exploration of raw materials and energy resources to disposal of wastes and end products. A conceptual model of generation of pollution at various stages of production process is shown in Figure 5.
Figure 5. A conceptual model of generation of pollution (Faisal et. al., 2000)
In this research, we would like to discuss and more concern about water pollution caused by industrial activities (see Figure 6).
Figure 6. Specific Impact in This Research
2.4 Water Pollutants
The most essential of water pollutant parameters are BOD (Biological Oxygen Demand) and COD (Chemical Oxygen Demand). BOD is defined, as the amount of oxygen needed by aerobic decomposers to breakdown the organic materials in a given volume of water at a certain temperature over a specified time period. Rather same within the BOD definition, but for COD the amount of oxygen needed by anaerobic decomposers to breakdown the inorganic materials.
BOD is caused by organic water pollutants that are oxidized by naturally occurring microorganisms. This ‘biological oxygen demand’ removes dissolved oxygen from the water and can seriously damage some fish species, which have adapted to the previous dissolved oxygen level. Low levels of dissolved oxygen may enable disease-causing pathogens to survive longer in water. Organic water pollutants can also accelerate the growth of algae, which will crowd out other plant species. The eventual death and decomposition of the algae is another source of oxygen depletion as well as noxious smells and unsightly scum. The most common measure for BOD is the amount of oxygen used by
Industrial Activities
Water Pollution Air Pollution Toxic & Hazardous Waste
- Decreasing of River Water Quality
- Decreasing of Air Quality - Soil Pollution
microorganisms to oxidize the organic waste in a standard sample of pollutant during a five-day period. (5-day BOD).
2.5 Storet Method
STORET (short for STOrage and RETrieval) is an EPA developed database for water quality, biological, and physical data that is used by state environmental agencies, EPA and other federal agencies, universities, and private citizens.
2.6 Global Pollution Policy
Pollution arising from one region can change damage in another region. This Trans boundary pollution takes on the features of an externality between the “emitter” and the “recipient” (Peace and Turner, 1990). The typical ‘image” is that polluters are firms and individual people (Peace et.al, 1990). It is wrong to think of polluters only as firms, individual’s polluter, so do government.
Table 3. Relationships between Emitter and Receptor
No External generator Externality Sufferer
1 Firm Firm
2 Firm Individuals
3 Individuals Firm
4 Individuals Individuals
5 Government Firm
6 Government Individuals
2.7 The Clean River Program (Prokasih)
the Act No. 22/1999 on which the districts are given more autonomous status, it is expected that the environmental management could be also handled directly by the local government.
Based on the initiative of the programs, the action programs can be divided into two categories. First, top-down initiative such as, clean river program (Prokasih), clean air program, sustainable coastal and marine program, Proper and Superkasih program. Second, bottom-up initiative is among others 4-R (reduce, reuse, recover, recycle) program and tree bank program.
Clean river program (Prokasih) declared in early 1990s. Provincial and local government involved in this program shall regularly submit information on monitoring result of water quality of rivers. In general, the monitoring result conducted under Prokasih showed that the water quality of rivers is improving.
Prokasih is aimed to reduce of pollution load entering rivers, improve of river quality and, improve of resources and institutions (regulations, human resources, budgets etc.) in the ma nagement of the environment and river water quality. It includes activities to reduce the pollution load and discharges into the rivers. Prokasih activities are carried out by local Governments under the co-ordination of Ministry of Environmental, operating in cooperation with the Department of Interior Affairs and related technical agencies.
2.8 The Statement of Clean River (Superkasih)
In addition to the Proper, the government through decree from the chairman of Environmental Impact Management Agency (Bapedal) introduced the Superkasih program.
Superkasih stand for Surat Pernyataan Kali Bersih, which means a letter of intent to clean river. It is an alternative strategy that is developed based on the voluntary commitment of the industries to process their product through clean production. The program is developed based on several considerations, among others 1) increasing number and type of industries along watershed system, 2) increasing pollution especially
Top down programs that need greater support are among others, Proper and Prokasih program. Constrains faced in the implementation of pollution prevention and reduction strategies lie in the lack of institutional capability especially in the provincial and district levels, and inadequate industrial-stakeholders’ participation which results from weakness in local organizations and lack of awareness of the issues.
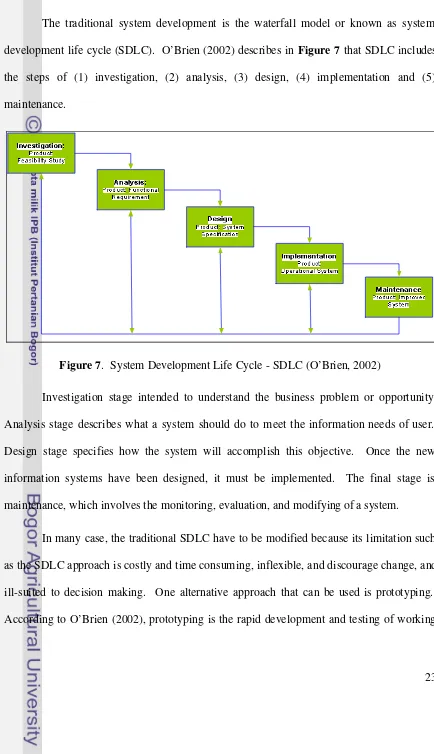
2.9 System Development
The traditional system development is the waterfall model or known as system development life cycle (SDLC). O’Brien (2002) describes in Figure 7 that SDLC includes the steps of (1) investigation, (2) analysis, (3) design, (4) implementation and (5) maintenance.
Figure 7. System Development Life Cycle - SDLC (O’Brien, 2002)
Investigation stage intended to understand the business problem or opportunity. Analysis stage describes what a system should do to meet the information needs of user. Design stage specifies how the system will accomplish this objective. Once the new information systems have been designed, it must be implemented. The final stage is maintenance, which involves the monitoring, evaluation, and modifying of a system.
model, or prototypes, of new application in an interactive, iterative process that can be used by both systems analysts and end-user. Prototyping is an interactive process that combines steps of the traditional systems development.
Figure 8. Prototyping Development Stages (O’Brien, 2002)
The advantages of prototyping are users are involved in design and captures requirements in concrete form. Prototyping makes the development process faster and easier for system analyst, especially for projects where end-user requirements are hard to define.
2.10 The Stage of Activity
In this research, the following step will be taken:
(1)
Need Assessment, this stage is needed for getting initial information before
developing the system, and will do through focus group discussion among
stakeholders (in environmental sectors).
(2)
Problem Analysis, in order to understand several problems faced by the
government in environmental management, in this stage try to know the root of
(3)
Understanding the existing condition
, to understand the procedure and
monitoring activity of industrial pollution.
(4)
Data Mining & Collecting, to collect the industrial data and information of
pollution
(5)
The general design
, to design of Graphical User Interface (GUI) related to
spatial information system.
(6)
Database Structuring, to develop the structure of database (industrial profile
and pollution).
(7)
Preparing the Formulation
, to prepare the formulation which is used by
system according to the several criteria and parameters.
(8)
System Analysis, to develop the system analysis (based on user needs) and data
base design (conceptual design, logical design and physical design).
(9)
Fuzzy System Design, to develop the qualitative decision analysis according to
stakeholders opinion (related to river load condition)
(10)
Coding the spatial program
, writing the code for the sub system of spatial
information (using digital map).
(11)
Coding the Non Spatial Program, writing the code for the sub system of
database (non spatial information: industrial profile, pollution etc.)
(12)
System Prototype, to make system prototype through to combine between
spatial and non spatial system to the one application system, called
IPMS-System (
Industrial Pollution Monitoring Support System).(13)
System Testing, by using Beta Test to know the performance of system
prototype (until valid).
(14)
Data Inputting, to input data and other information related to measurement
result (from industry outlet and river body).
(15)
Reporting, according the printout of system (as output the system and end of
result), the result will write down as a complete thesis.
III. METHODOLOGY
Spatial-Decision Support System was developed to support the Government to monitor the industrial wastewater and the river water quality. As an information system, this system was developed by using SDLC approach (System Development Life Cycle).
3.1 Need Assessment
In the beginning of the analysis and general design phase, intending to elicit an understanding of the scope of a study, a needs assessment was performed to understand the project process, to know what they want to accomplish with the automation, and to involve them at an early stage of the implementation. There are two kind of analysis in this stage, e.g.: system analysis and data need analysis. System analysis, means that the principle of database structure based on the output plan. Data Need Analysis, means that in this analysis will be done identification of data type, data availability, data format, group of data/variable, and data reading technique. Data will be used in database structuring should be made in the same format, which can be done going through standardization all kind of data. There are some questions arise during the need assessment of spatial decision support system for industrial wastewater monitoring. The questions are shown in Table 4.
Table 4. Question from need assessment User as decision maker Researcher
How to do the effective monitor- ing industrial and river water pollution?
• What is the existing information of pollution was covered?
• It’s complete or not?
• Can we display, share or access those data?
From literature review, it was found that monitoring the water pollution needs a system to be implemented. To achieve the goals Spatial Decision Support System will be developed and used.
3.2 User Identification
User identification analysis is needed for defining the specific target and appropriate information. This should be done for designing the system. There are four categories of users:
(1)Central Government (KMLH) as a decision maker needs information of industrial profile and its pollution status .
(2)Local Government (Pemda) in order to release of industrial license and permitting (3)Environmental Agency (BPLHD) in order to make good planning and monitoring of
environmental sectors.
(4)Industry in order to support regular data of industrial waste water and to get information of water quality status.
(5)Public in order to know the industrial and river pollutions status
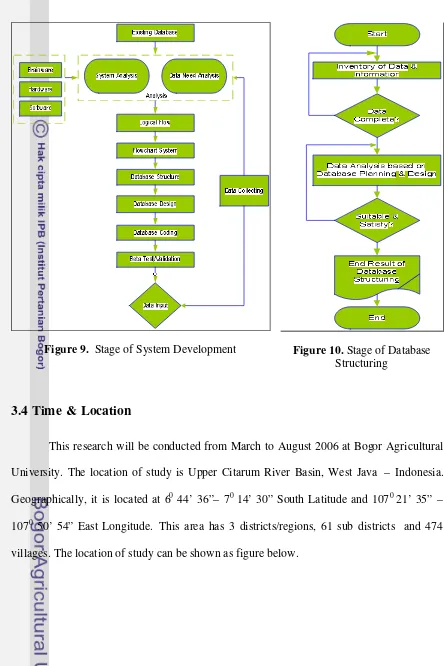
3.3 Data Collection Method
Figure 9. Stage of System Development Figure 10. Stage of Database Structuring
3.4 Time & Location
[image:47.595.77.521.84.750.2]Figure 11. Research Location
3.5 Database
Database design involved defining how graphic will be symbolized (e.g. color, size, symbols, etc), how graphic files will be structured, how non graphic attribute files will be structured, what is the active layer, in what scale shall the layers expose, how GIS products will be presented (e.g. map sheet layouts report format etc), and what management and security restriction will be imposed on file access. Database design proceeds through the steps illustrated in figure below:
In this research, there are two typical of sub system: non-spatial and spatial sub system:
(1)Database Sub System (Non spatial): a. Program Interfacing: Visual Basic 6.0 b. Database: MS Access 2000
c. Crystal Report Ver. 9.0
d. Database Structure: according to need assessment result e. Base line/Reference: Government Regulations.
f. Kind of Data: Administration, Industry Profile, water quality measurement (River & Effluent)
(2)Spatial Sub System:
a. Map Object, ArcView 3.3, ERMapper
b. Base map (Prototype): Digital Base Map Bakosurtanal, scale: 1 : 25.000 (year 2000) c. Landsat Imagery (for really land viewing, as soon as possible and depend on
requirement)
There are three main activities of the database system design with the following activities (Rao, 1993):
(1)Conceptual design: identify data content, describe data, define features and entities, list attributes and characteristics of each entity.
(2)Logical design: converting the conceptual design to the logical design of the GIS database, include logical process modeling and logical data modeling.
(3)Physical design: design of the DSS application system. It describes the actual software and hardware application, including how data is processed and organized on a particular type of machine.
Hybrid architecture manages geospatial data independently and in different software module from the non-spatial data (Worboys and Duckham, 2004). Spatial and non-spatial data in the designed industry and river database have to be linked up for better analysis and visualization of desired output. The link is provided by interface with connectivity function to other related database. Non-spatial database will be designed in MS Access and link up with the spatial data through ActiveX Data Object (ADO). ADO is familiar to database programmers using Microsoft Visual Basic.
Figure 13. Hybrid system design
3.6 Graphical User interface
Graphical user interface is an application that can be used by users and it has specific functions. The system development can be integrated and operated in a personal computer. The interface has been developed using Microsoft Visual Basic and supported by database reference (ADO) and several ActiveX components, i.e. ESRI MapObject.
3.7 Hardware & Software Requirement
The hardware used for this study is one unit of personal computer with Pentium IV processor, 512 MB RAM and 40 GB hard disc. This system was developed by using several software employed to accomplish this research are shown in Table 5.
Table 5 Software Components will be used
No Software Function
1 AutoCAD Map 2000i Preprocessing raw digital data in dxf format. Converting from dxf into shape format. 2 ArcView GIS 3.3 GIS application Spatial data analysis,
Viewing and updating attribute data.
3 MapObject Ver. 2.1
Active X Developing user interface
3 MS Access Database application Developing attribute data, Storing database as tables.
4 Visual Basic Programming software Developing user
interface and database programming 5 Crystal Report Ver. 9.0 Designing The Output (Report) 6 ERMapper Ver. 6.4 Processing the satellite imagery 7 MS Visio Create the Flowchart & ER Diagram
3.8 Source of Data
Mainly the spatial data used for this research acquired from Bakosurtanal. There are two kinds of data, i.e.:
(2) Spatial data: - Vector: administration boundary, industry, river network, road,. The sources of secondary data from:
(1) Current data from PROKASIH (Clean River Program) (2) The government Regulation Document
(3) Monthly Report from Industry (4) Other sources of data
3.9 Public Perception Processed with Fuzzy Method
There are some condition related to the opinions of public/stakeholders, especially for river segment which has low capacity. Although some industry not so polluted, sometimes a river segment has a bad condition (caused by low discharge, high domestic pollution, etc.). In many chances, we need some stakeholders/public opinion related to these rivers condition. By using Fuzzy Logic, the best choice of some alternatives can be resulted. More stakeholders gives opinion is better, because computer can compute it, resulting only the best alternative within certain Alpha -Cut Value as a valid result.
In this research, there are five alternatives can be chosen as follow: Table 6. Five alternatives for River Segment Evaluation
Description L1 L2 L3 L4 L5
River condition Very Good Good Fair Moderate Bad
Description Level 1 is the best choice among five river (an overview to the river condition). It means that the intention usage of this river perform to drinking water or any other use with the similar requirements.
Level 2 is the second choice where the river can be used for service water, recreational, gardening, or any other use with the similar requirements.
Level 3 is the third choice where the river can be used for fresh water aquacultures, farming or any other use with the similar requirements
Level 4 is the forth choice where the river can be used for irrigation water or any other use with the similar requirements.
Making the decision for each status of river segment related to stakeholder’s opinion can use Fuzzy Method. This approach is used to get the best alternative from public side/point of view. For instance some alternative called L1, L2…L5. Which one the best alternative? Each audience has the different choice among some those alternatives.
The method can be explained step by step as follow:
• Step 1. Defining the alternatives, e.g. L1, L2, L3, L4, L5 (Opinion 1,2,3,4,5)
• Step 2: Opinion Collecting according to stakeholders. For instance: P1 = (L1, L3, L2, L4, L5)
P2 = (L2, L1, L3, L4, L5) …. etc. for each stakeholder (P3, P4 … Pn) After this step, We have a lot of alternatives of opinion or solution from many audience
(depend on the number of people opinion or total respondent).
• Step 3: To calculate a lot of opinion where L1 better than L2 and so on.
• Step 4:
To calculate the degree or level of alternatives group Li on Lj
Formulae: S(Li,Lj) = N( Li,Lj)/n ... (1) Where, N(Li,Lj): Number of audience, whose choose Li on Lj.
• Step 5:
To make relation matix of alternatives choicing using fuzzy
• Step 6:
To calculate the α-cuts value according to matrix result above.
• Step 7:
3.10 Water Quality Standard
Water quality standard has been calculated following the calculation below: Maximum Pollution Load
BPM = (Cm)j x Dm x f ……… ...………….. (2) Notes:
BPM = Tolerable Maximum Pollutant Load, (kg parameter per day). (Cm)j = Maximum concentration of parameter j (mg/l).
Dm = Discharge of Maximum Liquid Waste (Liters liquid waste per second per hectare). f = conversion factor = 1 kg/1.000.000 mg * 24 hours/day x 3600 second/hours = 0,086
Actual Pollution Load can be calculated as below:
BPA = (CA)j x (DA) x f ... (3) Notes:
BPA = Actual Pollution Load (kg parameter per day) (CA)j = Actual concentration of parameter j (mg/l). DA = Actual Waste Discharge (liter/s)
f = Conversion factor = 0,086
3.11 Water Quality Evaluation
3.11.1 The Government Regulation
References of the regulation can be listed at follows:
(1)Government Regulation No. 82/2001 about Water Quality Management and Water Pollution Control.
(2)Environmental Ministerial Decree No. 115/2003 about the Guidance of Water Quality Status Calculation.
(3)Regional Regulation - West Java Province No. 3/2004 about Water Quality Management and Water Pollution Control.
(4)Regional Regulation about Guidance of Water Quality Status Calculation. 3.11.2 River Water Quality
3.11.2.1. Parameter of the Water Quality
According to the Government Regulation (PP 82/2001), generally the classification of parameters of water quality is classified into 4 main groups, which are: Physics, Chemistry, Biology & Microbiology and Radioactivity, the later separating chemistry parameter into Inorganic Chemistry and Organic Chemistry.
3.11.2.2 Determination of Water Quality Parameter
The number of water quality parameters depends on the usage and class of water. There is a standard on this subject. Water Quality Standard, called BMA (Baku Mutu Air) which is effectively used in West Java was based on the classification of water as the Group A, B, C, D and Group BDC as well Group CD.
3.11.2.3 Grouping of Water Quality Characteristics
(1) Physics parameter, Anion and Cation; (2) Cation parameters, Anion and pH; (3) Anorganic parameters, Non metal
(4) Biodegradable organic and Dissolved Oxygen: BOD & COD; (5) Metals and Heavy metals;
(6) Non pesticide Organic parameters (7) Pesticide parameters;
(8) Microbiology parameter; (9) Radioactivity parameters; (10) Water flow debit.
3.11.2.4 Monitoring the Water Quality
The procedures of monitoring as well as the parameters to be obtained are depend on the needs and the program (see Table 7)
Table 7. Purpose of Water Quality Monitoring and Time Period (BPLHD, 2006)
No Purposes Code Period
1 Inventory Inv 5 years
2 Status of water quality based on BMA SMA Yearly, representative of two seasons.
3 Recovery modeling, pollution carrying capacity of water and eutrofication.
DTP As needed 4 Calculation of pollution load caused by
inhabitants.
EPP As needed 5 Identification of bacterial pollution’s source
either from human or livestock’s.
BMH As needed
6 PROKASIH Program PKS According to planned
Table 8. Monitoring Parameters Selection (BPLHD, 2006)
No Groups Parameters Monitoring
Purposes Physics Temperature, Temperature Deviation,
Colours, Turbidity, Transparencies.
Inv, SMA, PKS Chemistry
Cation and Anion (KA)
Na, K, Ca, Mg, Cl, SO4, % Na, SAR, RSC, Hardness
Inv, SMA Acidity and Acidity
Alkalinity
pH Inv, SMA, PKS
Alkalinity, Acidity (C02) Inv Inorganic Non Metal
(INM)
B, Cl2, CN, F, H2S-S, SiO2 Inv, SMA
Total P, PO4-P Inv, SMA, DTP
Nitrogen NH4-N, NO2-N, NO3-N, Organik N, Total N
Inv, SMA, DTP, PKS
Organic
Biodegradable and DO (OB)
BOD, COD, DO Inv, SMA, DTP,
EPP, PKS Metal and Heavy
Metals (LB)
Hg, As, Ba, Fe, Cd, Co, Mn, Ni, Cu, Pb, Se, Zn, Cr6
Inv, SMA, PKS Organik Non Pestisida
(ONP)
Detergent , Phenol, Oil - Fats Inv, SMA Pesticide (P) Aldrin/Dieldrin, BHC, Chlordane,
DDT, Endrin, Heptachlor/ Heptachlor epoxide, Lindane, Methoxychlor, Toxaphen
Inv, SMA
Biology Coli secretion, Coli Total Inv, SMA, BMH
Escheresia.Coli BMH
RADIOACTIVITY Gross a, Gross b Inv, SMA
Water flow Debit Water flow Debit Inv, SMA
3.11.3 Evaluation of Class and Status of Water 3.11.3.1 Evaluation of Water Class & Status
Table 9. Class of Water and the Usage (PP 82/2001) Class Intention of Usage
First Class Drinking waters, or any other use with the similar requirements.
Second Class Service water, recreational, gardening or any other use with the similar requirements.
Third Class Fresh water aquacultures, farming, , or any other use with the similar requirements.
Fourth Class Irrigation water or any other use with the similar requirements.
Fifth Class Lower quality than the above classes
3.11.3.2 Evaluation of Water Quality Status Using Storet Method
The determination of water quality status by Stored methods is to compare between water quality and water quality standard according to the suitable using. The classification of water quality status (as a result) as following on Table 10, which is to show the total score (higher than water quality standard/Baku Mutu Air, BMA) and water quality status and also pollution level. The number of score is found from the evaluation for each water quality parameter and its frequency or number of data/number of sample which is higher than BMA on certain monitoring site. Table 11 shows the method of calculating. The assumption of the methods is follows:
(1)Every parameter which fulfills BMA has been scored null (0).
(2)Every parameter which is not fulfilling BMA has been scored minus 1 (-1). This also applicable to a single data, a time series of data where n < 10. Chemical’s parameter which is not fulfilling BMA, scored valued is minus 2 (-2). Biology’s parameter which is not fulfils BMA, scored valued is minus 3 (-3).
(3)Parameters which their average values are not fulfils BMA in term of number of data or sample (< 10) has been scored of physics (-3), chemistry (-6) and Biology (-9).
Table 10 Scoring Procedure of Water Quality Parameters (BPLHD, 2006)
Number of
data /samples Description
Score of Parameter (not fulfils BMA)
Physics Chemistry Biology
1 Single -1 -2 -3
< 10
Maximum -1 -2 -3
Minimum -1 -2 -3
Average -3 -6 -9
>= 10 Maximum -2 -4 -6
Minimum -2 -4 -6
Average -6 -12 -18
Fulfils the
Requirements 0 0 0
Table 11. Relation Between Score and Water Quality Status (BPLHD, 2006)
Total Score Quality Status Pollution Level
0 A Fulfil Standard Water Quality
(-1) to (-10) B Lightly polluted
(-11) to (-30) C Polluted
Less than (-31) D Heavily polluted
Evaluating the water quality with STORET can be applied through current or time series data. Quality status and pollution level obtained from the total score, which reflect the number of unfulfilled parameter’s score, more numbers means more pollution in water.
higher number of class, even this caused by one parameter only. Example; The status of water from Citarum River, sample taken at Nanjung, October 2004:
(1)From one sample, evaluation gave the score -19, therefore conclude as C category (heavily polluted).
(2)At the same year, with 3 set of data from multiple samples, therefore data have the range of minimum, maximum and average values, gave the score -83, therefore conclude as D category (heavily polluted).
3.11.3.3 Evaluation of Water Quality Status Using Pollution Index Method
Pollution Index use to mention the level of pollution in order of to establish it toward Standard Water Quality (BMA). Higher value of pollution index represent more pollutant in the respective water (see Table10).
L
ij represent the parameter’s concentration according to the Usage of Water(j)
, andC
i represent water quality parameter(i)
, thereforePI
j is the Pollution Index for certain usage(j)
as the function fromC
i /L
ij. Every values ofC
i /L
ij attributing the relative pollution caused by any parameter of water quality.Concentration of DO parameter show the higher pollution when the parameter values decreased. Theoritical value or maximum value
C
im (saturated DO value). In this case the measuredC
i /L
ij value are replaced with calculatedC
i /L
ij value. When standard valueL
ij are from the range of values, i.e. in pH value, the calculated valueC
i /L
ij are in use. The equation is shown below:Plj = (v (Ci/Lij)2M + (Ci/Lij) 2
Table 12. Relation Between Score and Water Quality Status
IP Values Quality Status Level of Pollution
0 <= PIj <= 1,0 A Fulfils the requirements 1,0 <= PIj <= 5,0 B Light pollution
5,0 <= PIj <= 10 C Polluted
PIj > 10 D Heavily polluted
3.11.3.4 Calculation Sample of Pollution Index
Pollution Index Method does not cover the calculation of PI in the situation where Standard Water Quality (BMA) is zero (0). Whereas the data value is greater than zero, thus C/L value become infinite. Standard Water Quality (BMA) for Group BCD; oil = 0, the concentration is 0.4 mg/l, C/L = infinitive, therefore the calculated C/L = infinitive, this make the status become D grade or heavily polluted.
Therefore, for Standard Water Quality (BMA) is zero (0), the best practice is to use the Detection Limit Method, even this methode is much depend on the analysis procedure and the accuracy of instrumentation. Example; Citarum case at Nanjung , September 2004, Pollution Index = 7.59, status = C (polluted).
3.11.3.5 Water Quality Monitoring
3.11.3.6 Industrial and Other Activities with Waste Water Effluent
Several type of industry and other activities with waste water effluent classified according to Environment Minister Regulations are as follow:
(1) Kep-51/MENLH/10/1995, about Quality Standard of Liquid Waste for Industrial Activities. This rule regulate 21 kind of liquid waste from industry.
(2) Kep.Gub.No.6/1999about Standard of Waste Water Quality for Industrial Activities in West Java.
(3) Kep-52/MENLH/10/1995, about Quality Standard of Liquid Waste for Hotel Industry.
3.12. Location of Wastewater Monitoring
3.12.1. Information of Monitoring SiteInformation about monitoring site will consist of: (1) Type and activity at the source of waste water effluents. (2) Serial number of the source.
(3) Address and location of the activities.
(4) River or branch of river where the waste water effluent discharge.
3.12.2 Record of Monitoring Site Location
Monitoring site location are recorded at the field base on address and or local information and coordinate measurement.
(1) Location of the effluent source, either industry, mining etc. Also some remark about administration and environmental incharge of the area.
(2) GIS measurement of the coordinates, it have to be done at gate of the private properties or at the fences wherever possible, to eliminate the permit to entry requisition. In case of a necessity the coordinate measurement also can be done at the actual point within the private area.
3.12.3 River at the Discharge of Effluents
Industry as the source of effluents have the discharge canal conveying the waste water effluent into the river or river’s branch. The discharge may also directly into the river if the location are close. The information about the river is important, and must be recorded in Waste Water Information System for the purpose of pollution load calculation. Whenever the industry are within an industrial estate and have the joint waste water treatment facility (IPAL), this inforamtion have to be acknowledge by the syatem.
3.13. Parameter of Wastewater Quality
For certain industry only stipulated the content of parameters, such as for pharmaceutical, pesticides, hotel and hospital. Activities which using Standard of Waste Water Quality in oil and gas sector, only refineries side, since in the exploration side use only the stipulated the content of parameters.
The kind of process in industry have a wide range of variation, causing the also the wide variation in their was water effluents. The parameter to be monitored in term of the requirement of Waste Water Quality are different from one to another industry, but the effluent are discharging into the same river. In some case the waste water quality are fulfils the BMAL’s requirements, but some effluent’s ingredients which potentially as pollutant are not include in the regulation.
Additional parameters such as Hexavalent Chrom (Leat