RICE CROP SPATIAL DISTRIBUTION AND
PRODUCTION ESTIMATION USING MODIS EVI
(case study of Karawang, Subang, and Indramayu Regency)
JAROT MULYO SEMEDI
GRADUATE SCHOOL
BOGOR AGRICULTURE UNIVERSITY
BOGOR
STATEMENT
I, Jarot Mulyo Semedi, hereby stated that this thesis entitled:
RICE CROP SPATIAL DISTRIBUTION AND
PRODUCTION ESTIMATION USING MODIS EVI
(case study of Karawang, Subang, and Indramayu Regency)
is a result of my own work under the supervision of advisory board during the period of May 2011 until July 2012 and that it has not been published ever. The content of this thesis has been examined by the advisory board and external examiner.
Bogor, July 2012
Jarot Mulyo Semedi
ABSTRACT
JAROT MULYO SEMEDI. RICE CROP SPATIAL DISTRIBUTION AND PRODUCTION ESTIMATION USING MODIS EVI (case study of Karawang, Subang, and Indramayu Regency). Under supervision of VINCENTIUS P. SIREGAR and HARTANTO SANJAYA.
Rice in Indonesia generally is harvested twice a year (80-90 growing days)
in well irrigated areas and harvested once a year (100-130 growing days) in
non-irrigated areas. Changes in plant phenology are considered to be a most sensitive
indicator of plant responses to climate change observable on remotely sensed
images. Vegetation Index (VI) is used to diagnose and predict crop behavior over
time by using multi temporal Enhanced Vegetation Index (EVI) from MODIS
imageries to estimate crop areas. The EVI will take full advantage of MODIS
measurement capabilities to correct for various distortions in the reflected light
caused by the particles in the air as well as the ground cover below the vegetation.
The classified EVI were compared with crop statistic of the research area to detect
which group of classification has the rice growth pattern using regression analysis.
Both estimation on rice field area and production from MODIS EVI were under
estimated compared to BPS data with error value of 7,38% for rice field area and
10, 36% for rice productivity. The temporal pattern of MODIS EVI images for
two groups of classification (Group D and F) shows normal pattern of rice growth
since 2008 through 2010, while different pattern showed by Group G, H and J.
The last three classes shows normal growing pattern in 2008 and 2009, but in
2010 show disturbed pattern with many variation of EVI value through time and it
was confirmed with the decreasing production number in BPS data. The
production estimation of rice was very depends on the variety of rice being
planted in the research area. The errors of rice production calculation can be
minimized by identifying the areas of each rice varieties
ABSTRAK
JAROT MULYO SEMEDI. DISTRIBUSI SPASIAL TANAMAN PADI DAN ESTIMASI PRODUKSI DENGAN MENGGUNAKAN CITRA MODIS EVI (Study Kasus Kabupaten Karawang, Subang, dan Indramayu). Dibawah bimbingan VINCENTIUS P. SIREGAR dan HARTANTO SANJAYA.
Padi di Indonesia pada umumnya dapat dipanen sebanyak dua kali dalam
satu tahun (untuk masa tanam 80-90 hari) pada perwahan yang memilliki irigasi
dan satu kali dalam satu tahun pada persawahan tadah hujan (untuk masa tanam
100-130 hari). Perubahan pada fenologi tanaman merupakan indikator yang cukup
sensitif terhadap adanya perubahan iklim, dan hal tersebut dapat diamati dengan
teknologi penginderaan jauh. Indeks Vegetasi (IV) dapat digunakan untuk
menggambarkan fenologi dari tanaman dengan menggunakan formula Enhanced Vegetation Index (EVI) dari sensor MODIS yang di rekam secara temporal sehingga dapat juga digunakan untuk memperkirakan luas lahan sawah. EVI
memiliki kelebihan dibanding Indeks Vegetasi yang lain dengan mampu
mengurangi distorsi yang disebabkan oleh ganguan atmosfir yang disebabkan oleh
uap air. Data temporal EVI yang sudah diklasifikasi kemudian dibandingkan
dengan data statistik pertanian menggunakan analisis regresi untuk menentukan
kelas EVI yang mewakili pola pertumbuhan tanaman padi. Hasil dari perkiraan
luas tanaman padi menggunakan data MODIS EVI menunjukkan bias sebesar
7,38% lebih kecil dibanding dengan data dari BPS dan perkiraan untuk
produktivitas padi menghasilkan bias sebesar 10,36% lebih sedikit dari data BPS.
Dari lima kelas EVI yang menunjukkan tutupan lahan sawah, terdapat dua kelas
(Grup D dan F) yang menunjukkan pola pertumbuhan padi yang normal dari
tahun 2008 hingga 2010. Sedangkan untuk tiga grup lainnya (Grup G, H dan J)
hanya menunjukkan pola normal pada rentang waktu 2008 hingga 2009 dan pada
tahun 2010 terdapat pola pertumbuhan yang tidak normal. Fenomena ini juga
divalidasi dengan data BPS yang menurun pada tahun 2010. Hasil dari perkiraan
produksi padi sangat bergantung terhadap varietaas padi yang ditanam di wilayah
penelitian. Dengan adanya informasi varietas padi yang lebih detil akan
mengurangi bias pada perkiraan produksi padi.
SUMMARY
JAROT MULYO SEMEDI. RICE CROP SPATIAL DISTRIBUTION AND PRODUCTION ESTIMATION USING MODIS EVI (case study of Karawang, Subang, and Indramayu Regency). Under supervision of Vincentius P. Siregar and Hartanto Sanjaya.
Indonesia is one of the rice producers in the world and most of the rice fields is located in Java Island which have the productivity of 60% of nearly 4 x 10⁶ ton of rice (Amien et al., 1996). Rice in Indonesia generally is harvested twice a year (80-90 growing days) in well irrigated areas and harvested once a year (100-130 growing days) in non-irrigated areas (Indonesian Agency for Agricultural Research and Development, 2009). In Indonesia rice usually planted in the beginning of rainy season in October - December then to be harvested in February (Directorate General of Food Crops, 2009).
Optical satellite remote sensing provides a viable means to meet the requirement of improved regional-scale detection and mapping of rice fields. Changes in plant phenology are considered to be a most sensitive indicator of plant responses to climate change observable on remotely sensed images (Linderholm, 2006). Vegetation Indices (VI) has proved particularly popular in the monitoring and characterization of plant cover. VI is used to diagnose and predict crop behavior over time and has been implemented by Potgieter et al. (2007) and Xiao et al. (2005) by using multi temporal Enhanced Vegetation Index (EVI) from MODIS imageries to estimate crop areas. The EVI will take full advantage of MODIS measurement capabilities to correct for various distortions in the reflected light caused by the particles in the air as well as the ground cover below the vegetation. The EVI data product also does not become saturated as easily as the NDVI when viewing rainforests and other areas of the Earth with large amounts of chlorophyll (Earth Observatory, 2009). It is becoming evident that studies of the growing season of land vegetation have become an important scientific issue for research into global climate change. The objectives of this research are to obtain the spatial distribution of rice fields in Karawang, Subang, and Indramayu Regency as national rice barn and to calculate estimation of rice production using medium resolution MODIS satellite imagery.
The main data used for this research is MODIS EVI imagery with the resolution of 250m by 250m with the acquisition date ranging from 1 January 2008 to 31 December 2010. The landuse map and rice production statistic were acquired from Badan Informasi Geospasial (BIG/formerly known as BAKOSURTANAL) and Badan Pusat Statistik (BPS) that will be used to validate the spatial distribution and production estimation of rice field in the research area.
Unsupervised classification of 69 layers of MODIS EVI image was used as the first step to detect rice field in the research area. The signature file from the classified image was used to determine the temporal pattern (phenology) of rice. The result then validated by rice field map derived from landuse map of BIG. Once the area of rice field calculated from the image, the estimation of production can be calculated by multiplying the area by rice productivity. Rice productivity was identified by recognizing the dominant rice species that planted in the research location. Rice calendar data is used to identify the growing stages of rice in Karawang, Subang, and Indramayu Regency. The combination between rice calendar data and Landuse map of West Java Province will provide the information of rice growing season in each area of west java or in other word we could regionalized growing season of rice in research area.
45 classes are selected based on the divergence separability which can explain the patterns of EVI behavior from 2008 to 2010 with the interval of sixteen days. For further analysis, a process of averaging the data annually is being done, as well as the grouping the classes with similar pattern. The crop statistics of research location were attained in tabular format which consists of the number of yield in tons for each Kecamatan of the Regency. The analogue crop area data reported in hectares was entered into Microsoft Excel used in the data processing for this study as an agricultural parameter to map rice distribution and calculate the area estimation.
By using multiple step-wise regression of EVI value of the 19 Classes data and crop production based on BPS data, rice field phenology pattern were shown by 5 out of 19 classes. Each of the EVI classes that shows the phenological pattern of rice in research area then were examine identify the growing season for each location to determine the crop calendar.
The temporal EVI images show the difference of planting date in research location. From the EVI temporal pattern, the planting and harvesting date were rotating starting from the south area towards north of the area. The type of rice field in the research location were dominated by irrigated rice field which causing that the planting and harvesting date moving towards north through time were the irrigation water started from the south region.
Each EVI classes then were examined to determine the growing season of rice for each class as a base for generating a crop calendar. Growing seasons of rice were varied according MODIS EVI temporal pattern. The variations ranging from 96-128 days and for each class there is difference days of planting pattern ranging from 16-48 days where the changes are moving backwards according to number of classes.
The result from regression between classified image and rice production were able to detect the area of rice within 250 by 250m pixel with R2 of 0,89. Based on the regression result, the estimation rice field area can be calculated by summing the area of Group Class.
tons/Ha). The result of estimation of production is 3.696.573,09 Tons for Karawang, Subang, and Indramayu Regencies.
Based on the pattern of temporal MODIS EVI images for Group A, Group B, and Group C, the growing season of rice shows normal pattern of rice growth since 2008 through 2010. Different pattern showed by Group D and Group E. The last two classes shows normal growing pattern in 2008 and 2009, but in 2010 show disturbed pattern with many variation of EVI value through time.
Based on the result of the research, it can be concluded that MODIS EVI with 250m by 250m resolution able to view spatial distribution of rice field in Karawang, Subang, and Indramayu Regency. The estimation of rice field area based on MODIS EVI result were under estimate compare to the rice field area based on landuse map from government data (BPS), but the errors only 7,38% for rice field area and 10,36% for rice production. The 250m by 250m image resolution also able to described rice phenology and its rotating growing season over the research area. This resolution also prove that MODIS EVI able to identify rice field and age more detailed compared by previous research using NOAA imagery which has 1km by 1km spatial resolution. Based on the temporal analysis, the rotation of growing season was started from the southern part of research area and moving towards north. The rotation of growing season show difference from east to west because of the research area has different irrigation river system which gave nearly the same schedule. Indramayu Regency has an early 16-48 days early planting of rice compared to Karawang and Subang Regency. The production estimation of rice was very depends on the variety of rice being planted in the research area. The errors of rice production calculation can be minimized by identifying the areas of each rice varieties.
Copyright © 2012, Bogor Agricultural University Copyright are protected by law,
1. It prohibited to cite all of part of this thesis without referring to and mentioning the sources;
a. Citation only permitted for the sake of education, research, scientific writing, report writing, critical writing or reviewing scientific problem.
b. Citation does not inflict the name and honor of Bogor Agricultural University.
RICE CROP SPATIAL DISTRIBUTION AND
PRODUCTION ESTIMATION USING MODIS EVI
(case study of Karawang, Subang, and Indramayu Regency)
JAROT MULYO SEMEDI
A thesis submitted for the Degree of Master of Science in Information
Technology for Natural Resources Management Study Program
GRADUATE SCHOOL
BOGOR AGRICULTURE UNIVERSITY
BOGOR
Research Title : RICE CROP SPATIAL DISTRIBUTION AND
PRODUCTION ESTIMATION USING MODIS EVI (case
study of Karawang, Subang, and Indramayu Regency)
Name : Jarot Mulyo Semedi
Student ID : G051080111
Study Program : Master of Science in IT for Natural Resource Management
Approved by,
Advisory Board
Signed Signed
Dr. Vincentius P. Siregar, DEA Hartanto Sanjaya, S.Si, M.Sc
Supervisor Co-Supervisor
Endorsed by,
Program Coordinator Dean of The Graduate School
Signed Signed
Dr. Ir. Hartrisari Hardjomidjojo, DEA Dr. Ir. Dahrul Syah, M.Sc.Agr
Date of Examination: Date of Graduation:
ACKNOWLEDGEMENT
Alhamdulillah, thank you to The Almighty Allah SWT for all the blessing for me during my study in MIT and finished my thesis entitled Rice Crop Spatial Distribution and Production Estimation (case study of Karawang, Subang, and Indramayu Regency). This thesis was written as a requirement to complete the master program at Master of Science in Information Technology for Natural Resources Management (MIT), Bogor Agricultural University. I would like to express my gratitude to:
1. Department of Geography, Faculty of Mathematic and Natural Science, University of Indonesia and also Center for Applied Geography Research for giving financial support for my master study,
2. Dr. Vincentius P. Siregar, DEA and Hartanto Sanjaya, S.Si, M.Sc for supervising, giving inputs, and guiding my research. Also thank you for Dr. Ir. Hartrisari Hardjomidjojo, DEA as external examiner for giving inputs and suggestions to improve my thesis report,
3. My deep appreciation for my family for giving support during my master study from the beginning until the end, especially for my beloved wife Sandra Wulandari,
4. MIT Coordinator, lecturers, and all MIT staff for giving knowledge and helps during my study,
5. All MIT Students and alumni, especially for 2008 and 2009 class. Thank you for all your friendships,
6. All parties who cannot be mentioned one by one. Thank you for the support.
I realize that this thesis report is still far from perfection; hence we need all inputs and suggestions to improve it. Hopefully this thesis can be useful especially in the use of remote sensing application for agriculture related to food security.
Bogor, August 2012
CURRICULUM VITAE
Jarot Mulyo Semedi was born in Semarang, Central Java on May 20th, 1981.
He was the fourth child of Soewarno Hadi and Surtinah. He graduate from
Undergraduate Degree in Geography in University of Indonesia in 2005, since
then He was promoted as assistant lecturer at Geography Department, University
of Indonesia with subject majoring Remote Sensing and GIS until present day. In
2007, He joined the Center for Applied Geography Research as Assistant
Researcher and has done some research relating to spatial analysis until present
day. He was granted for financial support to continue master study at Master of
TABLE OF CONTENTS
2.3 Time Series Analysis of Rice Crop ... 8
ii
5 CONCLUSION AND RECOMMENDATION ... 41
5.1 Conclusion ... 41
5.2 Recommendation... 41
REFFERENCE ... 43
iii
LIST OF FIGURES
Figure 2-1. Principles of Vegetation Indices ... 6 Figure 2-2. Rice Phenology ... 9 Figure 2-3. Vegetative and Generative phase of rice based on MODIS EVI ... 10 Figure 2-4. Profile of Vegetative phase based on MODIS EVI (Domiri, 2005) ... 10 Figure 2-5. Profile of Generative phase based on MODIS EVI (Domiri, 2005)... 11 Figure 3-1. Location of the research area (show in blue color)... 16 Figure 3-2. Flowchart of the research ... 19 Figure 4-1. MODIS Scene clipped to research location ... 25 Figure 4-2. Classification divergence statistic ... 26 Figure 4-3. Result from unsupervised classification of 45 class EVI ... 27 Figure 4-4. 19 class of EVI supervised grouping ... 28 Figure 4-5. Rice crop spatial distribution ... 31 Figure 4-6. Time series EVI images planting and harvesting time ... 34 Figure 4-7. Time Series of Rice Age Based on EVI Value ... 35 Figure 4-8. Phenology pattern of rice in 2008-2010 ... 36 Figure 4-9. Irrigation Region of Karawang, Subang, and Indramayu Regency .... 37 Figure 4-10. MODIS EVI Pattern of Group D and Group F... 38 Figure 4-11. MODIS EVI Pattern of Group G, Group H, and Group J ... 38 Figure 4-12. Decreasing rice production ... 39
LIST OF TABLES
Table 3-1. Rice Production in West Java year 2007 (BPS, 2008) ... 15 Table 4-1. Derived groups of EVI grouping based on similarity pattern ... 28 Table 4-2. Multiple linear regressions result ... 29 Table 4-3. Rice field area estimation ... 30 Table 4-4. Crop statistic from BPS ... 32 Table 4-5. Growing Seasons of Rice of MODIS EVI Classes ... 36
LIST OF APPENDIX
1
INTRODUCTION
1.1 Background
Research and studies in food security theme become important nowadays
because of the increasing of population in trough out the world and the lack of
agriculture land to support food as a basic need for the living. The increasing of
population in the world will give effect on the decreasing of agriculture land for
food. Humans tend to convert agriculture and forest land in their neighborhood to
become settlement and did not consider the effect on future generation.
Decreasing GSL results in low yields production because of the short period
between planting and harvest time. On the other hand increasing GSL gives the
opportunity for multiple cropping times. However, this also depends on water
availability (Linderholm, 2006).
Rice in Indonesia is becoming the primary food for the people of Indonesia
since the government announced that the country were able to self-supporting rice
for the people in the 1980’s. Indonesia is one of the rice producer in the world and most of the rice fields is located in Java Island which have the productivity of
60% of nearly 4 x 10⁶ ton of rice (Amien et al., 1996). Rice in Indonesia generally
is harvested twice a year (80-90 growing days) in well irrigated areas and harvested once a year (100-130 growing days) in non-irrigated areas (Indonesian
Agency for Agricultural Research and Development, 2009). The need of sufficient
water to grow makes rice plantation vulnerable to drought and flood (UNCTAD,
2009). In Indonesia rice usually planted in the beginning of rainy season in
October - December then to be harvested in February (Directorate General of
Food Crops, 2009).
The decreasing of agriculture land in Java Island gives contribution to the
decreasing rice production of Indonesia. In 2011 Indonesia were consider as four
biggest rice importers in the world along with Nigeria, Philippines, and Saudi
Arabia. The unpredictable climate can also cause the spreading of pest that could
disturb rice plantation growth. This condition gives the need for government to
2
Along with the advance of remote sensing technology in the world today,
the need to identify, measure and monitor rice crop are becoming urgent related to
food security. Remote sensing technology has a various specification regarding on
spatial resolution and temporal resolution with plenty of sensors that able to scan
earth surface in many ways. Satellite sensor that mostly use for earth surface
detection is optical satellite sensor. Optical satellite remote sensing provides a
viable means to meet the requirement of improved regional-scale detection and
mapping of rice fields. A new generation of advanced optical sensors, including
the Moderate Resolution Imaging Spectroradiometer (MODIS) onboard the Terra
and Aqua satellites, and VEGETATION (VGT) onboard the SPOT-4 satellite,
provide additional shortwave infrared bands that are sensitive to vegetation
moisture and soil water (Xiao et al., 2005).
Temporal analysis becomes an alternative in vegetation detection using
satellite imagery compared to single time analysis that need very high spatial and
spectral resolution to differentiate vegetation species. High frequency of satellite
revisiting time gives new approach in identifying vegetation by its growth
behavior. The frequent satellite temporal imagery or commonly known as hyper
temporal satellite imagery allow us to differentiate vegetation based on its growth
stages or phenology. Changes in plant phenology are considered to be a most
sensitive indicator of plant responses to climate change observable on remotely
sensed images (Linderholm, 2006). Various empirical methods to rapidly process
large amounts of remote sensing data and extract the desired information have
been proposed. Among these, Vegetation Indices (VI) has proved particularly
popular in the monitoring and characterization of plant cover. VI is used to
diagnose and predict crop behavior over time and has been implemented by
Potgieter et al. (2007) and Xiao et al. (2005) by using multi temporal Enhanced
Vegetation Index (EVI) from MODIS imageries to estimate crop areas. The EVI
will take full advantage of MODIS measurement capabilities to correct for various
distortions in the reflected light caused by the particles in the air as well as the
ground cover below the vegetation. The EVI data product also does not become
saturated as easily as the NDVI when viewing rainforests and other areas of the
3
It is becoming evident that studies of the growing season of land vegetation
have become an important scientific issue for research into global climate change
because of its ability to describe vegetation or crops growth behavior. This study
monitors the temporal profiles of MODIS-based vegetation indices of rice crop to
detect the growing season change in Java Island that could be threatened by changing climate.
The use of MODIS satellite imagery in this research tries to enhance the
previous research of Satellite Assessment of Rice in Indonesia (SARI) Project in
1998 which produce rice phenology using National Oceanic and Atmospheric Administration (NOAA) satellite imagery.
1.2 Objectives
The objectives of this research are to obtain the spatial distribution of rice
fields in Karawang, Subang, and Indramayu Regency as national rice barn and to
calculate the estimation of rice production using medium resolution MODIS
2
LITERATURE REVIEW
2.1 Vegetation Indices
Various empirical methods to rapidly process large amounts of remote
sensing data and extract the desired information have been proposed. Among
these, vegetation indices have proved particularly popular in the monitoring and
characterization of plant cover. Such indices capitalize on the strong spectral
reflectance gradient exhibited by live green vegetation around 0.7 µm.
Vegetation indices constitute a simple and convenient approach to extract
useful information from satellite remote sensing data, provided they are designed
to address the needs of specific applications and take advantage of the
characteristics of particular instruments. The Landsat and SPOT systems
participated in crop control and inventories of various kinds. Landsat Thematic
Mapper (TM) 4 band and Multispectral Scanner (MSS) 6 and 7 bands (and SPOT
Band 3) are the most sensitive for detecting IR reflectance from plant cells (modified by water content). TM Band 3 and MSS Band 5 (and SPOT Band 2),
which measure reflectance in the visible red, provide data on the influence of
light-absorbing chlorophyll. Ratio images using these bands help to quantify the
amount of vegetation, as biomass, involved in signature responses. Furthermore,
the measurement scale has the desirable property ranging from -1 to 1 with zero
representing the approximate value of no vegetation; thus negative values
represent non-vegetated surfaces (Oindo and Skidmore, 2002). It should be
mentioned that in this report the vegetation index range are projected in to screen
representation from 0 to 255 using linear stretching method in order to get the
integer value of vegetation index and simpler to be analyzes using remote sensing
software.
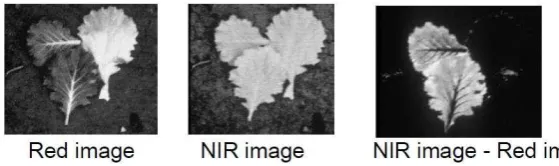
Of the several Vegetation Indexes (VI) developed so far, the most
commonly used is the Normalized Difference Vegetation Index (NDVI), which
indicates chlorophyll activity and is calculated from (Near IR band - Red band)
divided by (Near IR band + Red band). Temporal NDVI profiles in particular are
6
The Enhanced Vegetation Index (EVI) is often employed as an alternative to
NDVI because it is less sensitive to these limitations, but requires information on
reflectance in the blue wavelengths, which is not available on some satellites and
is difficult to extract from broadband radiation measurements. A few remote
sensing studies have explored the combination of blue, red, and near infrared
(NIR) bands for development of improved vegetation indices that are related to
vegetation greenness (Huete et al. 1997 and Gobron et al. 2000). The main
requirement of a vegetation indices is to combine the chlorophyll absorbing red
spectral region with spectral region with the non absorbing, leaf reflectance signal
in the near – infrared (NIR) to provide a consistent and robust m measure of area-averaged canopy photosynthetic capacity.
The enhanced vegetation index (EVI) is an ‘optimized’ vegetation index with improved sensitivity in high biomass regions and an improved vegetation
monitoring characteristic via a decoupling of the canopy background signal and a reduction in atmospheric influences, and it is calculated from (Huete et al., 1997).
EVI = Enhanced vegetation index
G = Gain factor (=2.5)
NIR = Near infrared and ρRed–ρBlue is the red/blue reflectance
C1 C2 = Atmospheric resistance red and blue correction coefficients (1 and 6.0)
7
Based on Xiao (2004), the advanced optical sensor in EVI have additional
spectral bands (e.g. blue and shortwave infrared), making it possible to develop
time series data improved vegetation indices. In this concept, MODIS imagery
was chosen for its particular advantages over Landsat in terms of temporal and
spatial resolution. Landsat TM & MSS have a temporal resolution of 16 days and
a spatial resolution of 30m (for TM) and 80m (for MSS). MODIS has a temporal resolution of acquiring daily imagery in its orbital period.
2.2 MODIS Satellite Data
Moderate Resolution Imaging Spectroradiometer (MODIS) is a remote
sensing sensor onboard EOS Terra and EOS Aqua satellite. Terra's orbit around
the Earth is timed so that it passes from north to south across the equator in the
morning, while Aqua passes south to north over the equator in the afternoon.
Terra MODIS and Aqua MODIS are viewing the entire Earth's surface every 1 to
2 days, acquiring data in 36 spectral bands, or groups of wavelengths. The high
frequency of MODIS sensor viewing earth surface gives the ability for user to
study the dynamic process on the earth surface in medium resolution. The high
frequency of temporal satellite data or commonly known as hyper-temporal
satellite data also able to understand earth system models and to predict global
phenomena that dynamically happens on lands, oceans, and lower atmospheres.
In this study, the daily MODIS data were acquired and calculate the EVI
value for each day. Because of the research location located at the tropical area,
cloud cover becomes a problem in remote sensing especially for daily remote
sensing data like MODIS. By taking the average value of EVI for a certain day
interval, cloud cover can be removed but it reduced the temporal resolution. The
method on how to process MODIS imagery will be discussed more on the next
8
2.3 Time Series Analysis of Rice Crop
Time Series Analysis (TSA) can produce and analysis many input images,
providing both spatial and temporal outputs. Long temporal sequence of regularly
acquired data (Hyper temporal image data), such as EVI time series, have been
used for monitoring anomalies, drought, vegetation phonology, Land cover
characteristics and to estimate crop yields. Crops exhibit distinctive behaviors that
are captured by temporal patterns of EVI which have strong periodic
characteristics in a year, so cropland can be distinguished from other vegetation
types through analysis of their respective phonologies especially those of crops
captured by the EVI-profiles. Detecting and monitoring changes that relate to
ecosystem processes are still not fully quantified or understand (Bates et al.,
2008). It requires among others the integration of spatial and temporal aspects
(Beck et al., 2008) where GIS data with more than 30 years of imagery available,
play a key role as data source of spatial and temporal information (Schmidt and
Skidmore, 2003).
The growing season of rice are divided into eight phases where each phase
have different time span and also depends on crop species. Figure 2-2 shows the
time span of rice growth for early variety and late variety. Before the rice seed
being planted, rice field needed to be flooded. Once the seed planted or at
germination phase, it will take 25-30 days to reach tiller initiation phase and the
rice leaf starting to grow. The leaf color then turning from yellow into green in the
early tillering phase and mid tillering phase. The growth will reach maximum at
the panicle initiation where for early variety rice it will take 55-60 days from
germination phase and for late variety it will take 65-75 days. The next phase is
the flowering phase, where rice plantation started to grow flowers and the leaf
color started to turn into yellow. For the early variety rice, this phase were reach
in 85-100 days after germination phase and for the late variety rice it needs
100-115 days. The last phase is harvesting, where rice is already developed and ready
to be harvested. The early variety rice need 130-145 days after germination phase
9
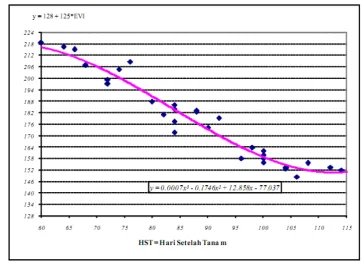
Based on the rice growth phases, the green color that produced by rice leaf
were at the panicle initiation phase. This phase will be detected by the EVI value
as the highest value or in the other word is where the crop has the greenest color.
The EVI value will decrease when the rice plant started to flowering and then harvested.
Figure 2-2. Rice Phenology
In general, the phenological pattern of rice has an almost symmetrical bell
shape. The vegetative growth stage will correlated with the increasing EVI value
until it reaches the maximum value in between 55 – 65 Day After Planting (DAP). It should be understand that the peak of the bell shape pattern is not the phase
where rice are ready to be harvested, but the phonological pattern were based on
EVI value or based on green index of rice. The peak on the phenological pattern
means that the EVI value reaches maximum and the objects shows very green
10
Figure 2-3. Profile of Vegetative and Generative phase of rice based on MODIS EVI (Domiri, 2005) The profile shown in figure 2-3 were divided into two model by Domiri
(2005), the vegetative phase and generative phase.
11
Figure 2-5. Profile of Generative phase based on MODIS EVI (Domiri, 2005)
2.4 Related Research
Research on rice has long carried out by researchers because of its relation
to food security, especially in Indonesia. As one of agricultural country in the
world, most of Indonesian people always consume rice for their main course. The
objective of researches was focusing on estimating rice production to fulfill the
people needs of main food. The use of remote sensing technology is already
common in agriculture research because of its ability to scan the earth surface
remotely. The combination of remote sensing data and temporal analysis becomes
a good combination in predicting the agriculture plantation behavior over time.
High frequency of visiting time of satellite or commonly known by
hyper-temporal satellite data are able to detect earths land cover behavior over time. In
2007, Ramoelo did a research in Portugal that try to map land cover changes by
using hiper-temporal satellite imagery at a country level. The method used can
12
over a period of time. The NDVI derived land cover can be one of the imperative
inputs for species distribution modeling. The research showed that in order to
reduce the problem of co linearity in species distribution predictor variables,
NDVI derived land cover can be used as a proxy for precipitation and digital
elevation model (DEM) derived parameter in Portugal. Finally, NDVI derived
land cover data has good overall accuracy (85%) which it makes suitable for use
as an input for many natural resource applications, such as herpetofauna studies as well as various environmental monitoring and planning applications.
One of the researches that try to predict rice production is Satellite
Assessment of Rice in Indonesia (SARI) Project that was initiated in 1997 by
BPPT and Ministry of Agriculture in Indonesia. The project was trying to develop
a monitoring system of rice in Indonesia using satellite imagery with optical and
SAR sensors. A rice-mapping method using SAR sensor has been established that
is based on the temporal change of the backscatter - the so-called ˝change index˝ - at the field scale. The value of this change index depends on the points during the
growing cycle at which the SAR data are acquired, i.e. whether the change is over
the growing season when the backscatter is increasing, or between harvesting and
the beginning of the next cycle when the backscatter is decreasing. In order to
apply this method, these changes need to be accurately quantified. This is made
difficult because of speckle, a well-known effect in SAR imagery that gives a
noisy aspect to images and introduces errors in the measurements of the
backscatter. A rice-field mapping algorithm has therefore been developed that
enables one to reduce speckle, derive a suitable change index, and finally separate
rice and non rice areas. For the optical sensor, the project uses 1 km by 1 km
NOAA imagery and using its NDVI to detect rice growth at coarse scale because
of the ability of NOAA satellite to scan earth surface twice a day. The temporal NDVI were able to shows rice crop growth stage over time.
In 2005, Domiri from LAPAN also did a research related to rice detection using satellite imagery. Domiri’s research objective is to observe and detect the age of rice using MODIS satellite and produce rice growth equation model that
13
of MODIS satellite imagery gives the advantages of higher spatial resolution
(250-500m) compared to NOAA satellite imagery.
This research tries to enhance the previous research related to rice crop
identification and monitoring. The use of time series MODIS EVI in this research
gives more detailed information in term of spatial resolution and the ability to
describe the rice planting rotation in the research area. Spatial resolution of
MODIS imagery used in this research is 250m by 250m pixel size which is higher
than NOAA spatial resolution of 1km by 1km pixel size and gives the ability for
MODIS imagery to identify land cover better than NOAA imagery. The use of
EVI rather than NDVI in this research also to improve the result in identifying
vegetation because EVI has an improved sensitivity in high biomass regions and
3
METHODOLOGY
3.1 Study Area
The study area of this research is in Karawang, Subang, and Indramayu
Regency, West Java Province, where natural resources are abundant in the
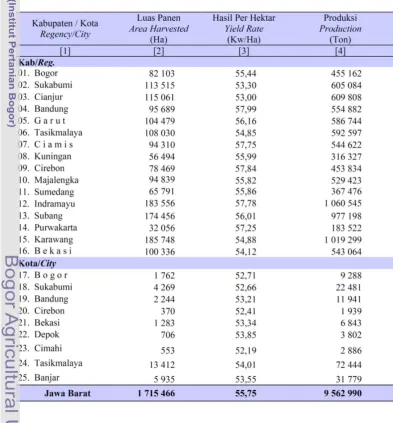
province. West Java in the year 2007 has 374.850 ha of technical irrigation rice
field, while the rice with semi-technical irrigation has 128.465 ha, and area of rice
with non-technical irrigation has 435.913 ha. In 2007, these rice fields produced
9.952.990tons of rice where most of the rice was produced in Karawang, Subang,
and Indramayu Regency where the total rice production for 3 regencies reaches
3.057.042 tons or 30,7% out of West Java total rice production (see table 3-1).
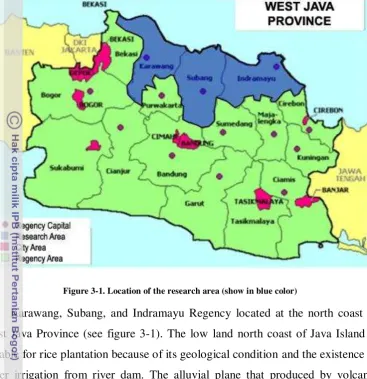
16
Figure 3-1. Location of the research area (show in blue color)
Karawang, Subang, and Indramayu Regency located at the north coast of
West Java Province (see figure 3-1). The low land north coast of Java Island is
suitable for rice plantation because of its geological condition and the existence of
water irrigation from river dam. The alluvial plane that produced by volcanic
mountains that exist in the middle part of Java Island were spread along the
northern and southern coast of the island and creating a low land of fertile land for
agriculture.
The low land of north coast of Java Island not only suitable for agriculture,
but this area also becomes the settlement concentration of Java Island. This
condition will generate problems in land demand for settlements and for agriculture. Because of Karawang, Subang, and Indramayu were already consider
as national rice barn and rice became the primary regional income, the agriculture
land especially rice would not be converted to settlements but because of the
increasing of population in the area, agriculture land cannot be increased in term
17
3.2 Data Source
This research will use TERRA MODIS satellite data. The data satellite will
be collect by daily since January 2008 up to December 2010. The data were
available for free download from Land Processes Distributed Active Archive
Center (LPDAAC) (http://lpdaac.usgs.gov) or from the Warehouse Inventory Search Tool(WIST) (https://wist.echo.nasa.gov).
The spatial resolution of MODIS satellite data used in this research is 250m
by 250m pixel size. This resolution of MODIS data expected to be able to
differentiate rice field and non rice field landcover in Karawang, Subang, and
Indramayu Regency. The 250m by 250m MODIS also suitable to view land cover differentiation within small scale resolution map of the research area.
The image acquisition of MODIS data, image processing and image
analyzing will be conducted in computer laboratory.
3.3 Methodology
3.3.1 Data Collection
As stated in previous point, the research study will use Terra MODIS
satellite imagery data. The acquisition of MODIS data will download with free of
charge from specific website. One requirement to make MODIS data available is
the availability of high speed internet connection to download the data.
All the data are available freely from the Land Processes Distributed Active
Archive Center (LPDAAC) (http://lpdaac.usgs.gov) or from the Warehouse
Inventory Search Tool(WIST) (https://wist.echo.nasa.gov). Because heavy clouds may affect the quality of the images, the 16-day composite surface reflectance
images might have more opportunities to avoid the impact of clouds than the daily
collected ones. The changes within every 16-day can be ignored and the temporal
coverage frequency is fit for the seasonal change detection. Therefore, this study
used the 16-day composite surface reflectance images to overcome the cloud
problem. Each pixel in the 16-day composite images is the best one in quality
within every 16 day on the basis of high observation coverage, low view angle,
(http://modis-18
land.gsfc.nasa.gov/surfrad.htm), so the selected date might be different for
different pixels.
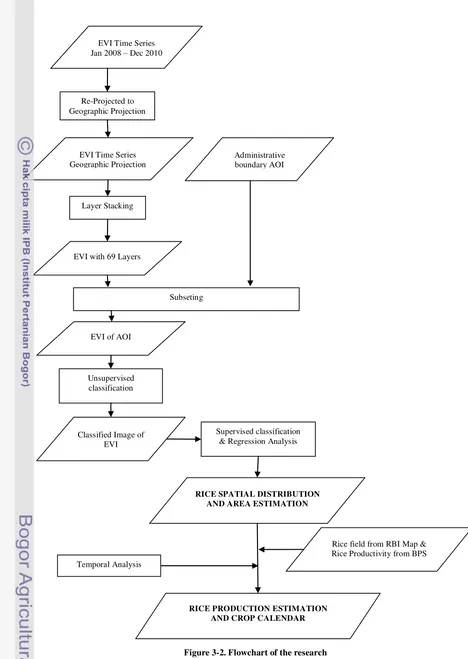
The general of methodology which will be conduct in this research study i.e.
pre-processing or acquisition of MODIS data, image processing and the expected result as show in Figure 3.2.
20
3.3.2 Processing MODIS Data
In order to process MODIS data, there are several remote sensing technique
was applied to get the imagery become useable. Vegetation indices were used to
enhance the features of the objects of interest in the study. As the blue band is
sensitive to atmospheric conditions, it is used to adjust the reflectance in the red
band as a function of the reflectance in EVI.
Cloud covers become a problem where a research using MODIS data
conducted in tropical area like Indonesia. The best way to remove cloud cover and
get a clear image data is to make composite of imagery with different dates for the
same location. In this research, the daily MODIS EVI data were composited for
each 16 days and resulting of 69 EVI image temporal data ranging from January
2008 to December 2010 with interval of 16 days. The next technique to do is to
change the 16-day of EVI MODIS image projection from sinusoidal projection
into geographic projection in order to get the common projection that can be
overlaid with other data, and the results were used to do next process. All of the
69 EVI MODIS satellite data ranging from January 2008 to December 2010 then
were stacked to create an image with 69 bands that will make it able to be
analyzed as multi temporal image of 16 days interval of EVI data. Next of the
process is to subset to 69 bands EVI image with administrative boundary of
Karawang, Subang, and Indramayu Regency and resulting multi temporal EVI
image of research area. Once the image was stacked and subsets in to research
area, then the image need to be classified to identify the land cover of the research
area. In this research the classification process were done in two steps, first is
using unsupervised classification method then continued with supervised classification based on temporal behavior of land cover.
The iterative self-organized unsupervised clustering algorithm (ISODATA)
of the ERDAS imagines software was used to derive spectral classes from 69 EVI
image data layers. The ISODATA procedure is iterative in that it repeatedly
performs an entire classification (outputting a thematic raster layer) and
recalculates statistics. Self-organizing refers to the way in which it locates clusters
with minimum user input. The ISODATA clustering method uses spectral
21
the criteria for each class, and classifies again, so that the spectral distance
patterns in the data gradually emerge (ERDAS, 1997).
It starts from arbitrary cluster means. In each successive clustering, the
means of clusters are shifted. A cluster is a group of pixels (classes) with similar
spectral characteristics. The ISODATA utility repeats the clustering of pixels in
the image, until either a maximum number of set iterations has been performed
(50), or a maximum coverage threshold is reached (set to 1.0). Performing an
unsupervised classification is simpler than a supervised classification, because the
cluster signatures are automatically generated by the ISODATA algorithm. The
user must predetermine the number of iterations and number of resulting clusters
(classes). In this research, separate ISODATA runs were carried out to define 5 to
50 classes with interval of 5.
In each run the desired number of classes is produced by the ISODATA
clustering Algorithm. The divergence statistical measure of distance (ERDAS,
2003) between defined cluster signatures by run was used to compare the various
runs. The best run with a clear distinguished peak in the divergence separability
was selected for further study.
After the ISODATA clustering was performed, the image will have result
on many types of land cover on research location. The result from ISODATA still
gives a coarse classification and still has too many classes; this is why supervised classification still needs to be performed to enhance the result. The supervised
classification was done by identifying phenology similarity between classes.
Classes that have similar phenology pattern then were combined into one group and so on until each of the groups shows different phenology pattern.
3.3.3 Rice Calendar Regionalization
Rice calendar data is used to identify the growing stages of rice in
Karawang, Subang, and Indramayu Regency. The combination between rice
calendar data and Landuse map of West Java Province will provide the
information of rice growing season in each area of west java or in other word we
22
In this research, growing season of rice will be identified by the MODIS
EVI value of rice field that shows the green leaf of rice plantations. Temporal
MODIS EVI data that show the greenest index of rice plantation will give the
picture of rice plantation age over the research area and the multi temporal pattern
of MODIS EVI then were analyzed to see the shifting EVI value in research area
to determine the rice growing season (start and end) in several location of research area.
3.4 Regression Analysis
The multiple linear regression analysis was used to generate the regression
equations. Assuming that variables and crop area statistics were independent of
each other and that crop area is a linear combination of multiple predictors, the
multiple linear regressions of the districts were carried out using the selected
predictors by the stepwise regression.
Multiple linear regressions are used, when y is considered a function of more than one (independent) x variables. Stepwise regression removes and adds variables to the regression model for the purpose of identifying a useful subset of
the predictors.
The main approaches are:
- Forward selection, which involves starting with no variables in the model,
trying out the variables one by one and including them if they are 'statistically significant'.
- Backward elimination, which involves starting with all candidate variables
and testing them one by one for statistical significance, deleting any that
are not significant.
The statistical and spatial data pre-processing, provided a data set in tabular
format of the EVI classes. The classes were as the predictors with the consolidated
crop area statistic as a response variable. The multiple stepwise regression
analysis was used to select variables that were significant distributors of crop area.
The predictors were subjected to a no constant stepwise linear regression in order
23
was carried out iteratively first entering the variable that explains the most
variance in the data, until no more variables could be eliminated. Selected
variables that yielded a negative coefficient value though significant were
eliminated since they seemed to suggest that negative crop area is existent. The
selected variables were then used to run the multiple linear regressions for the
different crop areas. Only significant predictors of crop area were included in the
multiple linear regression models. The results of the multiple linear regressions
4
RESULT AND DISCUSSION
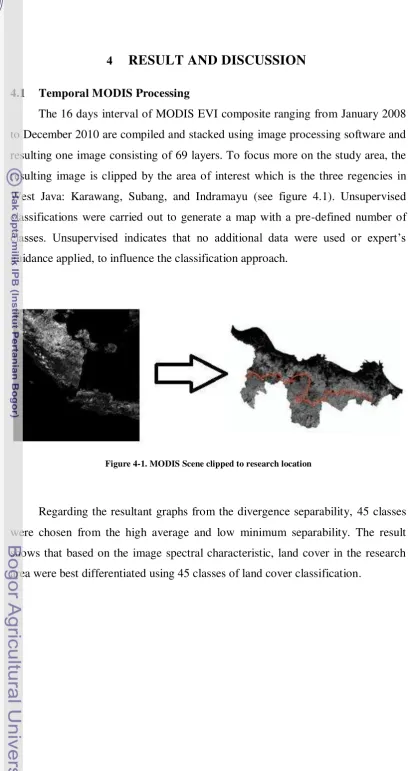
4.1 Temporal MODIS Processing
The 16 days interval of MODIS EVI composite ranging from January 2008
to December 2010 are compiled and stacked using image processing software and
resulting one image consisting of 69 layers. To focus more on the study area, the
resulting image is clipped by the area of interest which is the three regencies in
West Java: Karawang, Subang, and Indramayu (see figure 4.1). Unsupervised
classifications were carried out to generate a map with a pre-defined number of classes. Unsupervised indicates that no additional data were used or expert’s guidance applied, to influence the classification approach.
Figure 4-1. MODIS Scene clipped to research location
Regarding the resultant graphs from the divergence separability, 45 classes
were chosen from the high average and low minimum separability. The result
26
Figure 4-2. Classification divergence statistic
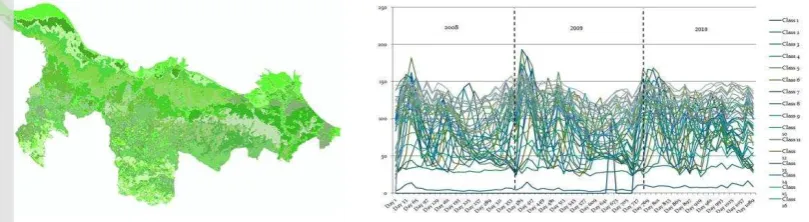
4.2 Data Extraction
45 classes are selected based on the divergence separability which can
explain the patterns of EVI behavior from 2008 to 2010 with the interval of
sixteen days (see figure 4-2). For further analysis, a process of averaging the data
annually is being done, as well as the grouping the classes with similar pattern
(see figure 4-3). The crop statistics of research location were attained in tabular
format which consists of the number of yield in hectare for each one of the
regency. The analogue crop area data reported in hectares was entered into
Microsoft Excel used in the data processing for this study as an agricultural
27
Figure 4-3. Result from unsupervised classification of 45 class EVI
The supervised classification was done by grouping temporal pattern that
have similar behavior of phenology. When the first classification using ISODATA
clustering carried out, the process was based on image spectral characteristic
differentiation. Meanwhile on the second classification process, it was done based
on temporal behavior (phenology) differentiation of the 45 classes in order to get
smaller class. Out of 45 classes, 19 classes were derived from supervised
classification process which able to differentiate land cover based on spectral
characteristic and temporal characteristic.
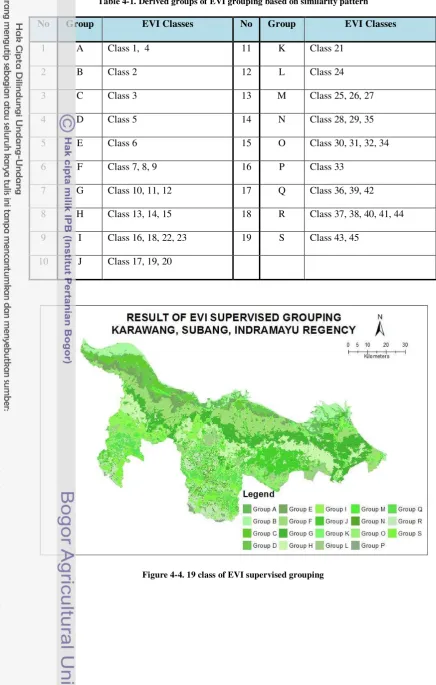
The grouping process of EVI classes needs to be done carefully because
there are vegetations that have similar pattern throughout a year. Not all classes
can be grouped with other, some classes has its own temporal characteristic or
phenology so that cannot be grouped with other and stand alone as one group. The
result from the classification can be seen in Table 4-1 and figure 4-4 which shows
the grouping result of EVI classes and later will be used for identifying rice spatial
28
Table 4-1. Derived groups of EVI grouping based on similarity pattern
No Group EVI Classes No Group EVI Classes
1 A Class 1, 4 11 K Class 21
2 B Class 2 12 L Class 24
3 C Class 3 13 M Class 25, 26, 27
4 D Class 5 14 N Class 28, 29, 35
5 E Class 6 15 O Class 30, 31, 32, 34
6 F Class 7, 8, 9 16 P Class 33
7 G Class 10, 11, 12 17 Q Class 36, 39, 42
8 H Class 13, 14, 15 18 R Class 37, 38, 40, 41, 44
9 I Class 16, 18, 22, 23 19 S Class 43, 45
10 J Class 17, 19, 20
29
4.3 Rice Detection
To identify pixel value that represent rice field, multiple linear regression
was conducted by comparing the number of pixel in each classification with rice
crop area derived from BPS data. Multiple linear regressions on the data based on
19 classes EVI grouping and crop statistic from BPS give result R2 of 0,89 which
described that the result shows good correlation between crop area and EVI Group
D, Group F, Group G, Group H, and Group J (see table 4-2). The 5 out of 19 class
resulted from the regression process then were considered as rice field for next
calculation to estimate the rice production in Karawang, Subang, and Indramayu
Regency.
Regression 5 2.22E+09 4.45E+08 91.65966 7.69E-25
Residual 54 2.62E+08 4850690
Group G 1.034164 0.179695 5.755102 4.2E-07 0.673897 1.394431 0.673897 1.394431
Group D 2.233164 0.334074 6.684648 1.34E-08 1.563387 2.902941 1.563387 2.902941
Group H 1.160912 0.194857 5.95777 1.99E-07 0.770248 1.551576 0.770248 1.551576
Group F 1.013324 0.151267 6.698927 1.27E-08 0.710053 1.316596 0.710053 1.316596
30
Based on the regression result, the spatial distribution and the estimated area
of rice field in the research area can be identified by using formula:
Rice Area (Y) = Area (Group D + Group F + Group G + Group H + Group J)
By summarizing the EVI Group EVI Group D, Group F, Group G, Group
H, and Group J, the estimation of rice field can be measured and compared with
the existing data from BPS for validation (see table 4-3 and figure 4-5). A bias
between estimated area and BPS data can occurred in this process because
MODIS EVI data has the spatial resolution of 250m by 250m pixel size,
meanwhile the real condition of rice field can be smaller or bigger than 250m by
250m.
Total Rice Field Area 284.351,7763
The harvested areas from BPS data then were compared with the area
estimation result from image data. The data from BPS seems to be larger from the
estimation from image data because BPS data measured the harvested area which
means that when the rice plantations were harvested twice a year then the area
also multiplied by two (most of rice variety planted in the research area were
harvested twice a year). To compare the area from BPS data with the result from
image data, the estimation area need to be multiplied by 2 times of harvesting
which gives the result of 568.703,5526 Ha of estimated harvested area. The error
was under estimated compared to BPS data with the difference of 7,38% for rice
31
Figure 4-5. Rice crop spatial distribution
Once the area of rice field estimated based on statistic regression, to
estimate the rice production information on the rice variety that being planted in
the research area are needed. Because most of the rice field in the research area
were own by individual and farmers are allowed to plant any type of rice variety
on their field, this research only use the dominant rice variety that being planted as
the parameter to estimate rice production. The selection of rice variety that being
planted by farmers usually coming from the ability of certain rice variety to have
high productivity and short growing seasons and also stands for certain pest. The
dominant rice variety that being planted in the research area based on information
from Balai Besar Padi – Ministry of Agriculture are Ciherang, IR64, and Cilamaya Munjul. The variety of rice and its productivity become the base in
estimating the rice productivity. The productivity of Ciherang, IR64, and
Cilamaya Munjul are ranging from 5 to 8 tons/Ha. To estimate the total
production of rice in the research area, the total rice field area then multiplied by
32
one year which shown by two bell shape phenology pattern in each EVI groups.
The estimation of rice production can be seen in the calculation below:
Rice Production (Ton) = 284.351,7763 Ha * 6,5 Tons/Ha * 2 time harvesting
= 3.696.573,09 Tons
To validate the rice field area and rice production estimation, the result was
compared to the existing data of rice production of 2008-2010 collected from BPS
(see table 4-4). The statistic data for Karawang Regency was not complete
because there was no data about Karawang Regency in Figures year 2010, so the
comparison was done using 2009 data. Based on the comparison, the estimation
result was under estimate compare to the crop statistic. The error of the estimation
are 10,36% for rice production.
KARAWANG 194,536.00 1,255,118.00 195,670.00 1,362,357.00 NO DATA NO DATA
SUBANG 172,447.00 1,091,612.00 185,209.00 1,128,353.00 174,337.00 959,533.00
INDRAMAYU 190,090.00 1,229,476.75 229,784.00 1,588,866.12 239,698.00 1,557,552.30
TOTAL 557,073.00 3,576,206.75 610,663.00 4,079,576.12 414,035.00 2,517,085.30
The estimation results from the calculation were under estimate for both
area and production of rice. This condition was caused by the resolution of
MODIS imagery that covers 250m by 250m for one pixel. The coarse resolution
of MODIS imagery cannot identify rice field smaller than 250m by 250m area and
causing that some of the rice fields were not detected and gives less result
compared with BPS data. On the other hands, the error value for rice field area
were less than 10% which means that more than 90% pixel were able to identify
rice field. The high error on production estimation which gives value of 10,36%
33
research area. This research only considers three types of rice variety which is
dominant in the research area, meanwhile in the field farmers not only planted Ciherang, Cilamaya Munjul, and IR64 rice variety.
4.4 Rice Planting Rotation
The temporal EVI images show the difference of planting date in research
location. From the EVI temporal pattern, the planting and harvesting date were
rotating starting from the south area towards north of the area (see figure 4-6).
Figure 4-6 shows the EVI value in research area where the white color represent
the panicle initiation phase of rice plantation where rice leaf is at the greenest
color phase. Through the time white color are shifting from south area towards
north area or in other word that the planting rotation were started from the south
and then shifting to the north. In figure 4-7, rice ages in research area were able to
be determined based on EVI value through time. Rice age were identified by
growing phases of rice plantation that consist of pre-flooding phase, germination
phase, tillering phase, panicle initiation phase, flowering phase, and harvesting
phase. The figure also describes the planting rotation of rice through time shifting
from south towards north. The type of rice field in the research location were
dominated by irrigated rice field which causing that the planting and harvesting
date moving towards north through time were the irrigation water started from the
south region.
Each EVI classes then were examined to determine the growing season of
rice for each class as a base for generating a crop calendar. Growing seasons of
rice were varied according MODIS EVI temporal pattern. The variations ranging
from 96-128 days and for each class there is a rotating days of planting pattern
ranging from 16-48 days where the changes are moving backwards according to
34
35
36
Figure 4-8. Phenology pattern of rice in 2008-2010
Table 4-5. Growing Seasons of Rice of MODIS EVI Classes
G
The planting rotation pattern from south to north area is caused by the water
irrigation system that irrigates the rice field in Karawang, Subang, and Indramayu
Regency. The water flow of irrigation systems in the research area were started
from the south of research area where two dams located and become the water
source for irrigation. The research location were irrigated by two river system;
Citarum river system with Jatiluhur Dam that irrigate Karawang, Subang, and
west part of Indramayu Regency, and Cimanuk-Cisanggarug river system with
Jatigede Dam that irrigate most of Indramayu Regency (see figure 4-9). The
37
most important variable in the growing of rice and related to rice crop production.
Most of the rice variety that planted in the northern coast of Java Island is very
dependent to water irrigation. That is why if there is a problem within water
distribution for rice, the production will decrease because of many rice fields cannot be harvested.
Figure 4-9. Irrigation Region of Karawang, Subang, and Indramayu Regency
From the growing season table 4-5 and the spatial distribution of rice field
shows that Indramayu Regency has early planting rotation for each growing
season (showed by Group J). Meanwhile Karawang and Subang Regency started
16-48 days later which is showed by Group H.
Based on the pattern of temporal MODIS EVI images for Group D and
Group F, the growing season of rice shows normal pattern of rice growth since
2008 through 2010. Different pattern showed by Group G, Group H, and group J.
The last three classes shows normal growing pattern in 2008 and 2009, but in 2010 show disturbed pattern with many variation of EVI value through time (see
38
of day 945 until day 1089 or in calendar date starting August 2010 until December
2010.
Figure 4-10. MODIS EVI Pattern of Group D and Group F
Figure 4-11. MODIS EVI Pattern of Group G, Group H, and Group J
39
Figure 4-12. Decreasing rice production -
500,000 1,000,000 1,500,000 2,000,000
KARAWANG SUBANG INDRAMAYU
2008
2009