FORECASTING HIGHLY IRREGULAR DEMANDS
WAN NORIDAYU BINTI WAN MANSOR
B050810028
UNIVERSITI TEKNIKAL MALAYSIA MELAKA
FORECASTING HIGHLY IRREGULAR DEMANDS
This report submitted in accordance with requirement of the Universiti Teknikal
Malaysia Melaka (UTeM) for the Bachelor Degree of Manufacturing Engineering
(Manufacturing Management)
by
WAN NORIDAYU BINTI WAN MANSOR
B050810028
FACULTY OF MANUFACTURING ENGINEERING
UNIVERSITI TEKNIKAL MALAYSIA MELAKA
TAJUK: Forecasting Highly Irregular Demands
SESI PENGAJIAN: 2010/2011 Semester 2
Saya WAN NORIDAYU BINTI WAN MANSOR
mengaku membenarkan Laporan PSM ini disimpan di Perpustakaan Universiti Teknikal Malaysia Melaka (UTeM) dengan syarat-syarat kegunaan seperti berikut:
1. Laporan PSM adalah hak milik Universiti Teknikal Malaysia Melaka dan penulis. 2. Perpustakaan Universiti Teknikal Malaysia Melaka dibenarkan membuat salinan
untuk tujuan pengajian sahaja dengan izin penulis.
3. Perpustakaan dibenarkan membuat salinan laporan PSM ini sebagai bahan pertukaran antara institusi pengajian tinggi.
4. **Sila tandakan (√)
SULIT (Mengandungi maklumat yang berdarjah keselamatan atau kepentingan Malaysia yang termaktub di dalam AKTA RAHSIA RASMI 1972)
TERHAD (Mengandungi maklumat TERHAD yang telah ditentukan oleh organisasi/badan di mana penyelidikan dijalankan) TIDAK TERHAD
Disahkan oleh: ______________________ ________________________
PENYELIA PSM Alamat Tetap:
M7-1-1, JALAN SB4, TMN SERI BAYAN (Tandatangan dan Cop Rasmi) 76100 DURIAN TUNGGAL, MELAKA
Tarikh: _________________________ Tarikh: ___________________
DECLARATION
I hereby, declared this report entitled “Forecasting Highly Irregular Demands” is the results of my own research except as cited in references.
Signature : _________________________
Author’s Name : WAN NORIDAYU BINTI WAN MANSOR
APPROVAL
This report is submitted to the Faculty of Manufacturing Engineering of UTeM as a
partial fulfillment of the requirements for the degree of Bachelor of Manufacturing
Engineering (Manufacturing Management). The member of the supervisory committee
is as follow:
_____________________________
Supervisor
i
ABSTRACT
The author presents the case of an Independent Power Producer (IPP) facing the problem
of managing the inventories of hundreds of different items. A key feature of the problem
is that the demand for the vast majority of items is intermittent. This project address the
problem of forecasting intermittent demand in which most of the time the demand is
zero, however, in some periods the demand is very large. This problem is faced by
almost all companies that store and uses spare parts for their preventive and breakdown
maintenance works. This project intends to investigate the use of Simple Exponential
Smoothing (SES) and Moving Average (MA) as forecasting models that capable of
solving the forecasting problems of intermittent demand. A comparison works among
the two models will be carried out using a real data collected from YTL Power Services
ii
ABSTRAK
Penulis menyediakan kes ‘Independent Power Producer’ (IPP) yang menghadapi
masalah pengurusan persediaan ratusan item yang berbeza. Ciri-ciri utama dari
masalahnya adalah bahawa permintaan untuk sebahagian besar barang adalah
jarang-jarang. Projek ini mengatasi masalah permintaan itu di mana sebahagian besar waktu
permintaan adalah sifar, namun, dalam beberapa tempoh permintaan sangat besar.
Masalah ini dihadapi oleh hampir semua syarikat yang menyimpan dan menggunakan
barang simpanan untuk kerja-kerja penyelenggaraan. Projek ini bertujuan untuk
menyiasat penggunaan ‘Simple Exponential Smoothing’ (SES) dan Moving Average
(MA) sebagai model peramalan yang mampu menyelesaikan masalah peramalan
permintaan itu. Perbandingan di antara kedua-dua model akan dilakukan dengan
menggunakan data yang dikumpulkan dari YTL Power Services Sdn Bhd (YTLPS) di
iii
ACKNOWLEDGEMENT
First of all I would like to thank to Allah for my successful completion in this Final Year
Project II (FYP II) report. The big thanks dedicate to both of my supervisors, Prof.
Madya Dr. Khaled and Mr. Nor Akramin Mohamad for their support, guidance and time
to help and give me the best for my Final Year Project. Unforgotten, thanks to all
personnel from Faculty of Manufacturing Engineering for their attention in preparing
form for this FYP II.
Thanks to YTL Power Service (YTLPS) for their cooperation in data collection
especially to Mr. Nik Sulaimi, the technician for inventory department and Mr.
Kamaruddin, the mechanical engineer. Last but not least, thanks a million to my uncle
iv
1.5 Flow Chart of Research Methodology………...4
1.6 Solution Methodology………6
1.7 Organization of This Report………...…7
2.0 LITERATURE REVIEW………..9
2.1 Background of Forecasting………..10
2.2 Features Common to All Forecasts………...…...12
2.3 Elements of a Good Forecast………12
v
2.5 Forecast Accuracy………18
2.6 Forecasting Methods………19
2.6.1 Qualitative Forecasting Method………..20
2.6.2 Delphi Technique……….20
2.6.3 Scenario Writing………...21
2.6.4 Subjective Approach………21
2.6.5 Quantitative Forecasting Methods………..……….22
2.6.6 Time Series Methods of Forecasting………23
2.6.7 Time Series Forecasting Using Smoothing Methods………...25
2.6.8 Time Series Forecasting Using Trend Projection……….28
2.6.9 Time Series Forecasting Using Trend and Seasonal Components………...29
2.6.10 Causal Method of Forecasting………..30
2.7 Type of Forecast………...32
2.8 Conclusion………33
3.0 RESEARCH METHODOLOGY………..35 3.1 Experimental Design………....36
3.2 Data Collection………37
3.3 Forecasting System Architecture……….37
3.4 Moving Average Forecasting Technique……….38
3.5 Exponential Smoothing Forecasting Technique………..39
3.6 Naïve Forecasting Technique………..41
3.7 Mean Absolute Deviation………41
3.8 Mean Squared Error……….42
3.9 Mean Absolute Percentage Error……….43
vi
4.0 DATA COLLECTION, DATA ANALYSIS AND DISCUSSION………….45
4.1 Details of Spare Parts………...46
4.2 Tables of Data Collection……….46
4.3 Data Analysis………48
4.4 Discussion……….51
4.4.1 Moving Average Results………..51
4.4.2 Simple Exponential Smoothing Results………...54
4.5 Conclusion………58
5.0 CONCLUSION………..60
5.1 Overall Conclusion………...60
5.2 Process Flow of Forecasting……….61
REFERENCES………..63
APPENDICES A Gantt chart for PSM I……….66
B Gantt chart for PSM II………67
C MA Results by Using Variation of n………...68
vii
LIST OF TABLES
2.1 Summary list of journal in forecast 15
4.1 Demand of spare parts per year 47
4.2 Demand of spare parts per 2 years 47
4.3 Summary for data analysis 48
4.4 MA Result for Impeller 51
4.5 MA Result for Oil Filter 52
4.6 MA Result for Gasket 53
4.7 MA Result for Membrane Pack 54
4.8 SES Result for Impeller 55
4.9 SES Result for Oil Filter 56
4.10 SES Result for Gasket 57
4.11 SES Result for Membrane Pack 58
viii
LIST OF FIGURES
1.1 The Flow Chart of Research Methodology 5
1.2 Solution Methodology 6
3.1 The Experimental Design 36
ix
LIST OF ABBREVIATIONS
UTeM - Universiti Teknikal Malaysia Melaka
YTLPS - YTL Power Services
TNB - Tenaga Nasional Berhad
SES - Simple Exponential Smoothing
MA - Moving Average
MAPE - Mean Absolute Percentage Error
MAD - Mean Absolute Deviation
MSE - Mean Squared Error
GDP - Gross Domestic Product
EMA - Exponential Moving Average
FYP I - Final Year Project I
FYP II - Final Year Project II
Αlpha (α) - Smoothing Constant
n - Period
RTPM - Real Time Performance Management
1
CHAPTER 1
INTRODUCTION
Accurate forecasting of demand is important in inventory control (Buffa & Miller, 1979;
Hax & Candea, 1984; Silver, Pyke, & Peterson, 1998), but the intermittent nature of
demand makes forecasting especially difficult for service parts (Swain & Switzer, 1980;
Tavares & Almeida, 1983; Watson, 1987). Similar problems arise when an organization
manufactures slow-moving items and requires sales forecasts for planning purposes.
This chapter is attempts to provide general information relevant to this research.
Specifically, this chapter presents background of study in Section 1.1, Section 1.2
presents the Problem Statement, and Section 1.3 explains the Research Objectives.
Section 1.4 shows the Research Scope, Research Methodology Flow Chart is explained
in Section 1.5 and Section 1.6 showing the Solution Methodology. Addition in Section
2
1.1 Background of Study
Because future demand plays a very important role in production planning and inventory
management, fairly accurate forecasts are needed. The manufacturing sector has been
trying to manage the uncertainty of demand for many years, which has brought about the
development of many forecasting methods and techniques (Makridakis and Wheel right,
1987). Statistical methods, such as exponential smoothing and regression analysis, have
been used by decision makers for several decades in forecasting demand. In addition to
‘uncertainty reduction methods’ like forecasting, ‘uncertainty management methods’
such as adding redundant resources have also been devised to cope with demand
uncertainty in manufacturing planning and control systems (Bartezzaghi et al., 1999).
However, many of these uncertainty reduction or management methods may perform
poorly when demand for an item is lumpy that is, characterized by intervals in which
there is no demand and, for periods with actual demand occurrences, a large variation in
demand levels. Lumpy demand exists in both manufacturing and service environments,
including items such as heavy machinery or spare parts (Willemain et al., 2004). For
instance, lumpy demand has been observed in the automotive industry (Syntetos and
Boylan, 2001, 2005), in durable goods spare parts (Kalchschmidtet al., 2003), in aircraft
maintenance service parts (Ghobbar and Friend, 2003), and in telecommunication
systems, large compressors, and textile machines (Bartezzaghi et al., 1999), among
others.
1.2 Problem Statement
YTLPS is a large power plant that provides electrical power to support Tenaga Nasional
Berhad (TNB) as a supplier for electrical power located in Paka, Terengganu. YTLPS
have a large spare parts inventory stores in which hundreds of thousands of spare parts
3
The problem facing by the spare parts inventory manager is that some of the spare parts
have the characteristics of intermittent (irregular) demand and are very hard to forecast.
There is software used by the manager to record the amount or quantities of spare parts
movements (withdrawal and arrived new spare part). As a result, the manager knows
how much the quantity of spare part available in the store. But, there is no systematic
forecasting system to predict future demand of the spare parts. This leads to problem of
high inventory levels for certain spare parts. Sometimes, there is no spare part available
when mechanical maintenance staff needs it. At the same time, inventory manager have
to order the spare part and it takes time and that causes planning of repair tasks to be
complicated and less efficient. Therefore, a development of an efficient forecasting
system must be adopted by YTLPS.
1.3 Research Objectives
The main objective of this project is to determine the future demand of the spare parts
with intermittent (irregular, slow moving) demands and as a result, the following are the
project objectives.
Specific objectives are:
i) To analyze the demand data collected from YTLPS.
ii) To develop and use Simple Exponential Smoothing (SES) as a forecasting
model to predict future demand for the slow moving items.
iii) To develop and use Moving Average (MA) as a forecasting model to predict
future demand for the slow moving items.
iv) To conduct a comprehensive investigation to compare among the models
4
1.4 Scope of Study
This project only concerned with two forecasting models which are Moving Average
(MA) and Simple Exponential Smoothing (SES). This project is mainly focuses in SES
and MA and not concerned with other quantitative forecasting methods for predicting
items with irregular demand. The actual withdrawal (demand) of spare parts collected by
the author from the inventory department, at YTLPS for the period between 1998 until
2011 will be used to carry out the work described in this project.
1.5 Flow Chart of Research Methodology
Figure 1.1 shows the flow chart of research methodology of this research. Starting with
define problem statement, objectives and scope of study. Then, study the literature
review. Followed by data collection and then develop forecasting models. Testing and
5
Start
Define problem, objectives and scope of study
Literature review
Data collection
Develop forecasting model
Testing the model
Result analysis
Report the finding
End
6
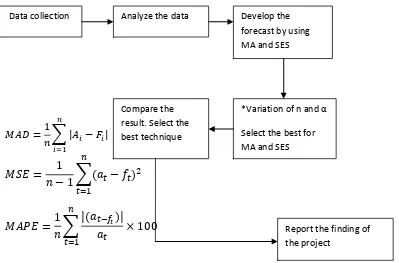
1.6 Solution Methodology
The solution methodology for this research is generally illustrated in Figure 1.2. Once
the data on previous demand is collected, analyze them. Then, develop the forecasting
by using two forecasting methods which are Moving Average (MA) and Simple
Exponential Smoothing (SES). The Mean Absolute Deviation (MAD), Mean Squared
Error (MSE) and/or Mean Absolute Percentage Error (MAPE) are used to determine
forecast accuracy. Many variation of n and α will be use to select the best of those two
forecasting methods. Then, compare the result to select the best technique. Last but not
least, reports the finding of project.
Data collection Develop the
7
1.7 Organization of This Report
This report is organized by 3 chapters as followed:
Chapter 1 explained about the introduction of this research. Also define what is
forecasting and why it is called as irregular demand. This chapter includes background
of study, problem statement, research objectives, and scope of study, research
methodology and solution methodology.
Chapter 2 revises the literature review of this research. The theories related to study
were explained in this chapter. The background of forecast, features common to all
forecasts, elements of a good forecast, steps in the forecasting process and forecasting
accuracy were included. Also contains in this chapter are forecasting methods, error in
forecasting, and choosing a forecasting technique.
Chapter 3 introduces the research methodology which includes the concept of Moving
Average (MA) and Simple Exponential Smoothing (SES). Therefore, the concept of SES
and MA were presented in this chapter. Other theories relates to these two concepts are
explained.
Chapter 4 discusses the data analysis and explains the overall results and findings for
this project. The reason of using certain of period (n) and smoothing constant (α) for
8
Chapter 5 is the conclusion for the overall findings of this project. A framework for
future forecasting system created to help any company that facing problem with large
9
CHAPTER 2
LITERATURE REVIEW
Forecasting is the process of making statements about events whose actual outcomes
(typically) have not yet been observed. A commonplace example might be estimation of
the expected value for some variable of interest at some specified future
date. Prediction is a similar, but more general term. Prediction of future events and
conditions are called forecasts, and the act of making such predictions is called
forecasting (Bowerman, O’ Connell, Forecasting and Time Series an applied approach, 1993).
This chapter introduces the research and forecasting. Start with Section 2.1 by
discussing background of forecast. Then, in Section 2.2, explain the features common to
all forecast. Section 2.3 discusses the elements of a good forecast. Section 2.4 presents
the steps in forecasting process. Section 2.5 presents a vital aspect of forecasting,
forecast accuracy. Forecasting methods were presented in Section 2.6. In Section 2.7, the