Muntohar et al. – Effect of Sand Fraction on the Behavior of Sand-Bentonite Mixtures 53 INTRODUCTION
Expansive soil has been attractive to study since the soil behaviour is unique under partially saturated conditions. Physically, those soils will be very stiff in the dry condition; otherwise they will be very soft in wet condition. So that soil is very susceptible due to the water content. In the field, many factors, directly and indirectly, influence the swelling of the expansive soil such as water content, clay mineral and clay size content, density, and applied load. Thus, further understanding of mechanism controlling swelling of soil mixtures lead to increasing the confidence level before applying such materials in the field. In this context, this article gives an account of experimental investigation of effect of the amount of sand fraction on the swelling characteristics of expansive soils.
The swelling behaviour of expansive soils often causes unfavourable problems, such as differential settlement and ground heaving. But recently, expansive soils are attracting greater attention as design as soil mixtures for various applications such as back-filling, buffer materials for high-level nuclear waste, soils
barrier for landfill liner, and backfilled vertical cut-off walls (Yong et al., 1986; Alawaji, 1999; Daniel & Wu, 1993).
Many attempts have been performed in the past to understand the properties, be it index and geotechnical properties, of the soil mixtures. The soil mixtures commonly are blends of swelling soils with non-swelling soils (Misra et al., 1999; Sivapulaillah et al., 1996; Çokça, 2001). Direct and indirect techniques were adopted in the literature to quantify the swell potential. The indirect methods correlate the swell potential with combinations of consistency limits, clay content, water content, and dry density, whereas, the direct measurement is commonly conducted using the oedometer tests (O'Neill & Poormoayed, 1980). In this paper, soil mixtures were formulated as sand – bentonite mixtures. Swell potential and strength of sand – bentonite mixtures has been also evaluated. The outcomes of this study can be extended to provide insight into the behaviour of soil mixtures in such used as backfill materials or liner materials in waste disposal scheme.
EFFECT OF SAND FRACTION ON THE BEHAVIOUR OF SAND-BENTONITE MIXTURES
Agus Setyo Muntohar 1) and Roslan Hashim 2)
1) Department of Civil Engineering, Universitas Muhammadiyah Yogyakarta, Indonesia e-mail: [email protected]
2)
Department of Civil Engineering, University of Malaya, Malaysia e-mail: [email protected]
ABSTRACT
Understanding characteristics of soil mixtures lead to increasing the confidence level before applying such materials in the field. The outcomes of this study can provide insight into the index properties and swelling – compressibility behaviour of sand – bentonite mixtures, between non-swelling materials and swelling materials. Series of laboratory tests were conducted to evaluated index properties, compaction, strength, and swelling behaviour of the sand – bentonite mixtures. The result of this study indicated that the existence of bentonite in the soil mixtures influence the swelling behaviour, which follows hyperbolic curve model. Amount and size of non swelling fraction reduced the swelling and compressibility of expansive soils.
DESIGN OF THE EXPERIMENT
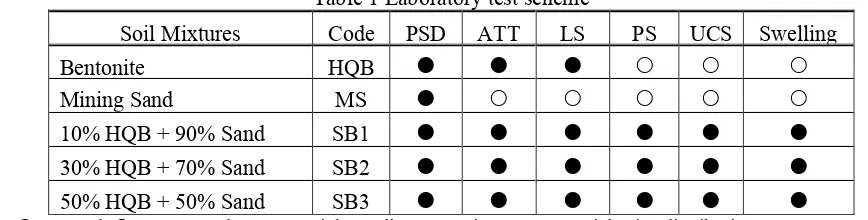
At the first stage of the research, the properties of various soil mixtures are determined. The index properties, compaction, strength, and swelling are measured to give a highlight of degree of swelling of sand – bentonite mixtures. Direct and indirect techniques are adopted in the literature to quantify the swell potential. The indirect methods correlate the swell potential with combinations of consistency limits and clay content, whereas, the direct measurement is conducted using the oedometer tests (O’Neill and Poormoayed, 1980). The design of laboratory test in this study is presented in Table 1.
Soil Used
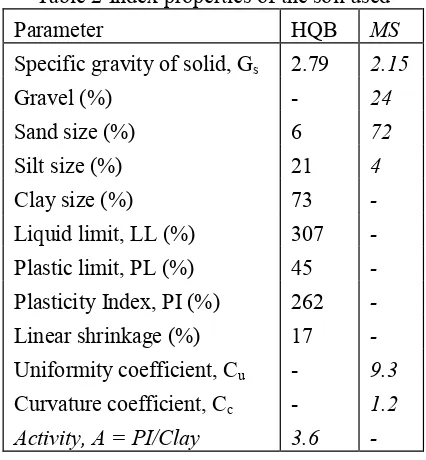
The soils used in this study are commercially bentonite and mining sand. The bentonite was comprised primarily of montmorillonite minerals. The montmorillonite mineral is strongly found in bentonite at basal spacing of 5.75 Å, 17.25 Å, and 19.98 Å as shown in Figure 1. The particle size distributions of the soils are shown in Figure 2, and the basic properties are listed in Table 2. According to British Soil Classification System (BSCS) BS 5930-1999, the bentonite is classified as clay of extremely high plasticity which is symbolized with CE. The sand used was comprised of 36% coarse, 24% medium, and 12% fine size, and then can be classified as well-graded sand (SW).
Laboratory Test Procedures
Series laboratory experiments are designed with various bentonite contents that is 10%, 30% and 50%. Cone penetrometer method was used to determine the liquid limit. Materials were oven
dried and sieved through 425 m. Sedimentation test was used to define colloidal particle less than 63 m while dry sieving was employed to determine particle size retained on the 63 m sieve. The consistency limit test, linear shrinkage, and particle size distribution test was performed according to the standard presented in BS 1377: Part 2 – 1990 (BSI, 1990a). Linear shrinkage of the soil was expressed as percentage of the original length specimen, Lo (in mm), which is obtained from equation (1):
Figure 1 X-Ray diffraction of the bentonite
Figure 2 Grain size distribution of the soil used
Table 1 Laboratory test scheme
Soil Mixtures Code PSD ATT LS PS UCS Swelling
Bentonite HQB
Mining Sand MS
10% HQB + 90% Sand SB1
30% HQB + 70% Sand SB2
50% HQB + 50% Sand SB3
Muntohar et al. – Effect of Sand Fraction on the Behavior of Sand-Bentonite Mixtures 55
1 D 100
o L LS L
(1)
where LD is the length of the oven-dry specimen (in mm).
The compaction test was according to BS 1377: Part 4 – 1990 (BSI, 1990b). Proctor standard compaction was examined for determination of the compaction characteristics of soil mixtures. Water were added to the soil mixtures and compacted until maximum dry density (MDD) has been reached. The optimum moisture content (OMC) was defined at the MDD. Unconfined compressive strength was used to observe the strength. The test was performed according to BS 1377: Part 7 – 1990 (BSI, 1990c). The samples of 50 mm diameter and 100 mm height were compacted at their maximum dry density by static compaction method. The desired amount of soil was placed into cylindrical mould and then compressed on the hydraulic jack. Then, the specimen was extruded and mounted in the compressive machine.
The swelling behaviour was determined according to ASTM D4546-03 (ASTM, 2003). A conventional oedometer apparatus was used for determination of the swelling and compressibility of soil mixtures. Required quantities of soil mixtures, at optimum moisture content, were transferred to consolidation ring of 50 mm internal diameter and 20 mm height. All the soil mixtures were compacted statically to the same maximum dry density that is 1.70±0.05 Mg/m3. The specimen was positioned in the loading frame with a seating load of 3.89 kPa.
The soil samples were then inundated with distilled water and allowed to swell until they reached equilibrium values of swelling. At this point a standard consolidation test is conducted by applying incremental loads starting with 14 kPa and ending with 1600 kPa.
Table 2 Index properties of the soil used
Parameter HQB MS
Specific gravity of solid, Gs 2.79 2.15
Gravel (%) - 24
Sand size (%) 6 72
Silt size (%) 21 4
Clay size (%) 73 -
Liquid limit, LL (%) 307 -
Plastic limit, PL (%) 45 -
Plasticity Index, PI (%) 262 -
Linear shrinkage (%) 17 -
Uniformity coefficient, Cu - 9.3
Curvature coefficient, Cc - 1.2
Activity, A = PI/Clay 3.6 -
RESULTS AND DISCUSSIONS
Particel Size Distribution and Conssitency Limits
The particles size distribution of soil mixtures are presented in Table 3. Soil mixed with bentonite showed various silt and clay content. Figure 1 shows grain size distribution of the soil mixtures. The figure shows that the sand fraction increases with increasing of mining sand content in the soil mixtures. According to the soil fraction presented in Table 2 and 3, theoretically,
Table 3 Soil fraction and Consistency limit of Soil Mixtures
Soil Code
Soil Fraction (%) Consistency Limits (%)
LS (%)
BSCS Symbol*
Sand Silt Clay LL PL PI
SB1 72.2 23.8 4.0 42.9 21.1 21.8 2.4 SMI
(65.7) (5.7) (7.3)
SB2 57.7 20.6 21.7 85.1 27.2 57.9 4.3 CVS
(51.9) (9.1) (21.9)
SB3 42.5 10.5 47.0 138.3 43.2 95.1 8.8 CES
(38.5) (12.5) (36.5)
the soil fraction of sand – bentonite mixtures in Table 3 should be the same or close to percentage of the soil fraction of sand – bentonite mixtures. For the instances, for SB1 soil, the amount of sand fraction from bentonite is 0.1 5%, and sand fraction from mining sand is 0.9 72.2%. Thus, the theoretical amount of sand fraction is summation of sand fraction from bentonite and mining sand that is 65.7%. However, the amount of sand fraction from laboratory test was 72.2% which differs with the theoretical. This discrepancy was attributable to the physicochemical interaction between bentonite and water. The second reason, sedimentation test in particle size distribution test assumed that the shapes of soil particles are spherical according to Stoke's law. In fact, the particles of silt and clay size were not spherical (Fukuda and Suwa, 2001).
In general, consistency limit is dependence on fines fraction content in a soil. Consistency limits or Atterberg limits are useful in geotechnical engineering for identification, description, and classification of soils, and as a basis for preliminary assessment of mechanical properties of soils. Liquid limit and plastic limit are also convenient indicators to know the degree of expansion and strength of soils (Grim, 1968). In general, greater quantity of clay size content in a soil will result in soils exhibiting higher plasticity and the greater potential for shrinkage and swelling.
The potential expansiveness of the sand – bentonite mixtures is shown in Figure 3. The range of soil swelling potential in figure 3 is originally proposed by Van der Merwe (1964). The figure depicts that the degree of expansiveness reduces from very high to low expansiveness with increasing the amount of sand fraction to 90%.
Linear Shrinkage
The tendency for expansive clays to swell and shrink is a major cause of damage to structure infrastructures. Shrinkage caused by loss of moisture content from soils either during initial curing or following later moisture movements, is one of the causes of cracking in common cases. The linear shrinkage of the sand – bentonite mixtures is presented in Table 3.
Figure 3 Potential expansiveness of soil mixtures in this study
The linear shrinkage decreased corresponds to the amount of sand fraction in the soils. This is possibly attributed by the presence of coarser fraction and capability of water absorption. Sridharan and Prakash (2000) introduced that shrinkage of soils is primarily a function of the relative grain size distribution of the soil, irrespective of the principal clay mineral of the soil and that the shrinkage limit does not depend on plasticity characteristics of soil. Furthermore, addition of non-cohesive soil fraction (fine and medium sand) results in lower shrinkage limits. For the systems having the same grain size distribution, the one that has higher shearing resistance at the particle level will shrink lesser.
Compaction Characteristics
Muntohar et al. – Effect of Sand Fraction on the Behavior of Sand-Bentonite Mixtures 57 Figure 4 Proctor standard compaction of the sand –
bentonite mixtures
Swelling and Pressure
Figure 5 illustrates the typical swelling in the form of percentage of swell versus log pressure. The swell is expressed as a percentage of the increase in sample height. The pressure required to revert the specimen to its initial height was determined as the swelling pressure. At least two essential values can be attracted from these results i.e. compressibility and swelling pressure.
Figure 5 Swelling and log pressure relationship
The figure shows that the swell pressure and compressibility increases with decreasing the sand fraction. Mathew and Rao (1997) indicated that by increasing the valence of exchangeable cations in homo-ionized clay, the overall compression in the system reduces and the pre-consolidation pressure (pp) increases. The
equilibrium void ratio at any applied pressure is a direct function of the repulsive forces arising from the interaction of adjacent diffuse double layers and pore fluid. As the valence of exchangeable cations in the clay increases, there is a reduction in the diffuse double –layer thickness and in the magnitude of the repulsive forces. These finally result in a lower equilibrium void ratio at any given pressure until higher pressures are reached. It is evident that there is a correlation between compressibility and swelling pressure as observed by Sridharan and Choudhury (2002).
Swelling behaviour
It has been observed that for all the mixtures, increase in swelling with log time is slow initially, increases steeply, and then reaches an asymptotic value as illustrate in Figure 6a. The time required to reach an asymptotic value varies considerably, depending upon the percentage of clay size fraction. The maximum amount of swelling generally increases with increasing bentonite content. The maximum swelling can be predicted using hyperbolic model (Al-Mukhtar et al, 1999).
The results in Figure 6a depict that considerable differences exist in the nature of time-swell relationship. At high sand fraction content, the rate of swelling is very slow but increases gradually with decrease in the particle size of the non swelling fraction. If the result in Figure 6a is plotted as time-swell relationship as percentage of the maximum swelling, hence, the percent swell at a particular time is calculated as the ratio of amount of swell of the mixture at that time to the total swell and is denoted as a percentage. This is observed that for sand – bentonite mixtures, the rate of swelling is very slow and follow a similar swelling path. The swelling seems to be ceased after 10 days.
Unconfined Compressive Strength
The compressive strength of sand– bentonite mixtures are shown in Figure 7. It appeared that the unconfined compressive strength is likely to decrease non-linearly with increasing the amount of mining sand. This behaviour explained that increasing of sand fraction yield diminishing the cohesiveness of the soil mixtures. As a result, the soil lost its ability to retain the integrity of soil structure. The void in sand – bentonite matrix is possible to be larger with increasing of the sand fraction and resulted in decreasing of compressive strength.
Figure 7 Unconfined compressive strength of sand – bentonite mixtures
CONCLUSIONS
Based on the study undertaken thus far it can be concluded that:
1. A physicochemical interaction t between bentonite and other active soil minerals took place in sand – bentonite mixtures.
2. Consistency limits and linear shrinkage of the soil mixtures decreased as the quantity of the sand fraction increases. Based on the consistency limit, the degree of expansiveness is likely to reduce from very high to low expansiveness with increasing the amount of sand fraction to 90%.
3. The optimum moisture content and maximum dry density of soil mixtures revealed slightly reduces when the sand fraction was reduced.
4. In general, the swelling and swelling pressure decreased corresponds to reducing of sand fraction percentage. The magnitude depends on the consistency of clay fraction. 5. The strength of soil – bentonite mixtures
decreased non-linearly with the amount of sand fraction in sand – bentonite mixtures.
ACKNOWLEDGEMENT
The first author gratefully appreciates to the Department of Civil Engineering, University of Malaya for the invitation as Visiting Researchers in July 2005. This paper is possible to be written owing to intensive discussion with the second author during visit in his laboratory.
REFERENCES
Alawaji, H.A. (1999). “Swell and compressibility characteristics of sand – bentonite mixtures inundated with liquids”, Applied Clay Science, Vol. 15(3-4): 411 – 430.
Al-Mukhtar, M., Touray, J.C., and Bergaya, F. (1999). “Une argile modèle pour l’étude du gonflement des sols argileux: la laponite-Na de synthèse”, Sciences de la terre et des planètes, Vol. 329, pp. 239 – 242.
Muntohar et al. – Effect of Sand Fraction on the Behavior of Sand-Bentonite Mixtures 59 ASTM. (2003). "ASTM D4546 – 03: Standard
Test Methods for One-Dimensional Swell or Settlement Potential of Cohesive Soils”, ASTM International, West Conshohocken, PA.
BSI. (1990a). "BS 1377: part 2 – 1990: Methods of test for soils for civil engineering purposes. Classification tests”, The British Standards Institution, London.
BSI, (1990b). "BS 1377: part 4 – 1990: Methods of test for soils for civil engineering purposes. Compaction-related tests”, The British Standards Institution, London.
BSI, (1990c). "BS 1377: part 7 – 1990, Methods of test for soils for civil engineering purposes. Shear strength tests (total stress)”, The British Standards Institution, London. BSI, (1999). "BS 5930 – 1999: Code of practice
for site investigations”, The British Standards Institution, London.
Chen, F.H. (1983). "Foundation on Expansive Soil", Development in Geotechnical Engineering 12, Elsevier Scientific Publishing Company, New York.
Çokça, E. (2001). “Use of class C fly ashes for the stabilisation of an expansive soil”, Journal of Geotechnical and Geoenvironmental Engineering, ASCE Vol. 127 (7): 568 – 573.
Daniel D.E. and Wu, Y.K. (1993). “Compacted clay liners and covers for arid sites”, Journal of Geotechnical Engineering, Vol. 119 (2): 223 –237.
Fukuda, M., and Suwa, S. (2001). "Dependence of liquid limit on grain size distribution", Proceeding of the 11th International Offshore and Polar Engineering Conference,
Stavanger, Norway, June 17-22, 2001: 442-445.
Grim, R.E. (1968). "Applied Clay Mineralogy", McGraw Hill, New York, ch. 8.
Mathew, P.K., and Rao, S.N. (1997). “Influence of cations on compressibility behviour of a marine clay”, Technical Note, Journal of Geotechnical and Geoenviromental Engineering, Vol. 123(11): 1071–1073. Misra, A., Sivalingan, S. and Sharma, M.C.
(1999). “Properties of known kaolinite – montmorillonite mixtures”, In H.Y. Fang and H.I. Inyang (Eds), Environmental Geotechnology, John Wiley & Sons Inc, New York, pp. 219 – 228.
O’Neill, M. and Poormoayed, N. (1980). “Methodology for Foundation on Expansive Clays”, Journal of Geotechnical Engineering Division, ASCE Vol. 106: 1345-1368. Sivapullaiah, P.V., Sridharan, A., and Stalin,
V.K. (1996). “Swelling behaviour of soil – bentonite mixtures”, Canadian Geotechnical Journal, Vol. 33: 808–814.
Sridharan, A., and Choudhury, D. (2002). “Swelling pressure of sodium montmorillonites”, Géotechnique, Vol. 52(6): 459–462.
Van der Merwe, D.H. (1964). The prediction of heave from the plasticity index and percentage clay fraction of soil, Civil Engineering Society of Africa, Vol. 6(6): 103-107.