Cover
The
Effect of Current Ratio, Activity Ratio, Debt Ratio,
and Inflation on Profitability Ratio in the Real Estate
Company in Indonesia Stock Exchange 2010-2013
BY: SATRIYA CHANDRA HUTAMA
NIM: 111 008 110 000 9
DEPARTMENT OF MANAGEMENT
INTERNATIONAL CLASS PROGRAM
FACULTY OF ECONOMICS AND BUSINESS
SYARIF HIDAYATULLAH STATE ISLAMIC
riculu
CURRICULUM VITAE
Personal Identities
Name : Satriya Chandra Hutama Gender : Male
Place of Birth : Jakarta
Date of Birth : January, 23rd 1992
Address : De Latinos Hacienda Mexicano C 9 No 15, BSD City Phone/Mobile : 085693501581
E-mail Address : [email protected] Formal Education
College : UIN Syarif Hidayatullah Jakarta Senior High School : SMAI Al Azhar BSD
Abstract
The Effect of Current Ratio, Activity Ratio, Debt Ratio, and Inflation on Profitability Ratio in the Real Estate Company in Indonesia Stock Exchange
2010-2013
The purpose of this research is to determine the impact of current ratio, activity ratio, debt ratio, and inflation towards profitability ratio of Real Estate Companies in Indonesia Stock Exchange. The research uses multiple regression approach as a statistical method. Based on the criteria set out in this study to determine the study sample, there were eight samples for the selection of these companies is because the company is engaged in the same industry, all of these companies have go public, as well as data from companies that provide complete data since 2010 until 2013. The last reason of the selection of these companies because these companies have similarities in their assets, thus making the data obtained will be more specific, because we can assume that all companies have the same grade. From the statistical research it was found that current ratio, activity ratio, debt ratio and inflation has a significant effect on the profitability ratio partially and simoultanously on the real estate company in the Indonesian Stock Exchange from 2010 to 2013. For the management of the company as a policy maker, after knowing how big the influence of four variables on the ratio of profit, it is important for them to analyze further on some of these factors deeper. Thus, management can take the appropriate steps to bring the company can develop much better.
Abstrak
Pengaruh Current Ratio, Rasio Aktivitas, Rasio Utang, dan Inflasi pada Profitabilitas Rasio di Real Estat Perusahaan di Bursa Efek Indonesia
2010-2013
Tujuan dari penelitian ini adalah untuk menemukan untuk menentukan dampak dari rasio lancar, rasio aktivitas, rasio utang, dan inflasi terhadap rasio profitabilitas perusahaan Real Estate di Bursa Efek Indonesia. Penelitian ini menggunakan pendekatan regresi berganda sebagai metode statistik. Berdasarkan kriteria yang ditetapkan dalam penelitian ini untuk menentukan sampel penelitian, ada delapan sampel untuk pemilihan perusahaan-perusahaan ini adalah karena perusahaan bergerak dalam industri yang sama, semua perusahaan-perusahaan ini telah go public, serta data dari perusahaan yang menyediakan data lengkap sejak 2010 hingga 2013. Alasan terakhir dari pemilihan perusahaan ini karena perusahaan-perusahaan ini memiliki kesamaan dalam aset mereka, sehingga membuat data yang diperoleh akan lebih spesifik, karena kita dapat mengasumsikan bahwa semua perusahaan memiliki kelas yang sama. Dari penelitian statistik ditemukan bahwa rasio, rasio aktivitas, rasio utang saat ini dan inflasi memiliki dampak yang signifikan pada rasio profitabilitas secara parsial dan simoultanously pada perusahaan real estate di Bursa Efek Indonesia dari tahun 2010 ke 2013. Untuk pengelolaan perusahaan sebagai pembuat kebijakan, setelah mengetahui seberapa besar pengaruh empat variabel pada rasio laba, penting bagi mereka untuk menganalisis lebih lanjut pada beberapa faktor yang lebih dalam. Dengan demikian, manajemen dapat mengambil langkah-langkah yang tepat untuk membawa perusahaan dapat mengembangkan jauh lebih baik.
Foreword
Bismillahirrahmanirrahim
Alhamdulillah, Praise to Allah Almighty who has given his grace so that writer had the opportunity to complete a study entitled "The Effect of Current Ratio, Activity Ratio, Debt Ratio, and Inflation on Profitability Ratio in the Real Estate Company in Indonesia Stock Exchange 2010-2013 ". Thanks also goes to:
1. Dr. Herni Ali HT., SE, MM thesis supervisor who gave a lot of input, advice, and a chance to see the real economic world.
2. Adhitya Ginanjar, SE, MSi as second counselor thesis has provided input, advice, and motivation that much to me so we can resolve this investigation.
3. The secretariat staff of the Faculty of Economics and Business UIN Jakarta who have helped writer in many ways to solve all the requirements of the trial from the beginning to the last.
Table of content
Cover ... i
Certification From Supervisor ... ii
Certification of Comprehensive Exam Sheet ... ii
Certification of Thesis Ex ... Error! Bookmark not defined. Certification of Thesis Exam Shee ... Error! Bookmark not defined. Sheet Statement ... Error! Bookmark not defined. Curriculu ... vi
CHAPTER I INTRODUCTION ... 1
A. BACKGROUND ... 1
B. RESEARCH PROBLEM ... 5
C. PURPOSE AND BENEFITS ... 6
CHAPTER II LITERATURE REVIEW ... 8
B. FINANCIAL RATIOS ... 9
1. Definition of Financial Ratios ... 9
2. Kinds of Financial Ratios ...10
C. ANALYSIS OF FINANCIAL PERFORMANCE ... 11
A. FRAMEWORK ... 25
B. RESEARCH DESIGN ... 25
C. OPERATIONALIZATION OF VARIABLES ... 26
D. TYPES AND SOURCES OF DATA RESEARCH... 28
E. POPULATION AND SAMPLE ... 28
F. DATA COLLECTION METHODS ... 29
G. DATA PROCESSING METHOD ... 30
1. Normality Test ...30
2. Multicollinearity Test ...31
3. Heteroscedastity Test ...31
4. Multiple Linear Regressions ...32
5. Hypothesis Test ...33
CHAPTER IV FINDING AND ANALYSES ... 35
A. GENERAL DESCRIPTION OF RESEARCH OBJECT ... 35
1. Overview of selected companies ...35
2. Overview of business development 8 selected companies ...36
B. ANALYSIS AND DISCUSSION ... 36
1. Descriptive Analysis ...36
2. Data Processing ...42
CHAPTER V ... 51
REFFERENCES ... 54
APPENDIX ... 56
A. Table ... 56
List of Table
1. Table 2.1 Previous Research ... 19
2. Table 3.1 Research Design ... 24
3. Table 3.2 Types and Sources of Data ... 26
4. Table 3.3 List of Companies ... 27
5. Table 3.4 The Interpretation of Coefficient Correlation Value ... 30
6. Table 3.5 Data Processing Method ... 32
7. Table 4.1 Eight (8) Selected Company ... 35
7. Table 4.2 Description Statistics ... 36
8. Table 4.3 Profitability Ratio 2010 – 2013 ... 36
9. Table 4.4 Current Ratio 2010 – 2013 ... 37
10. Table 4.5 Activity Ratio 2010 – 2013... 37
11. Table 4.6 Debt Ratio 2010 – 2013 ... 38
12. Table 4.7 Inflation 2010 – 2013... 38
12. Table 4.8 The Result of Multicolinearity Test ... 41
13 Table 4.9 Autocorrelation ... 43
15. Table 4.16 F – test... 45
List of Figure
CHAPTER I
INTRODUCTION
A. BACKGROUND
Real estate development in Indonesia, especially in Indonesia Stock Exchange very significant indeed. According to data gathered from the Association of Real Estate Indonesia (REI) estimated growth in property business in Indonesia continued to increase, reaching 20-30 percent, much higher than in 2014 which is only increased by 15-20%. One of the factors that influence the high demand from the public is a factor Loan to Value (LTV) related to the amount Down Payment (DP) for first home buyers, second and third. This certainly shows the cycle of the property sector has not yet reached a climax. Seeing the situation, making the property business, especially the real estate business into a very promising business.
The real estate industry is basically not a company that has a product that is sold. However, it is different in Indonesia with a very high level of consumptive public Indonesia own. Ranked the highest growth in property prices, it turns Indonesia ranked first in the world with growth of as much as 27.3%. However, despite showing the highest growth in real estate prices Indonesia declined sharply to 2.5% from the first six months of 2015. Looking at high prices, proved the high interest in the community for real estate in the Greater Jakarta. This is what makes this study interesting to discuss. (Setyo Maharso, 2013)
company's activities related to efforts to get the company's funds at a low cost as well as efforts to use and allocate funds efficiently. (Sutrisno, 2003)
Certainly companies that build real estate must have good financial management, but also a good financial must have a clear source for the financial performance of a company can be measured from various things, one of which is the ratio of profit or profitability ratio. Profitability ratio is a measure to determine how far the effectiveness of management in managing the company. The effectiveness of management includes management of functional activities, such as finance, marketing, human resources, and operations. The purpose of this ratio is to measure the overall effectiveness of management that can be seen from the profits generated. In this study, several factors are thought to affect the profitability ratio is the current ratio, debt ratio, activity ratio, and the inflation. (Sugiyono, 2008)
result in revenue which can be streamed to the assets and make the current debt does not decline, on the other hand, with the addition of assets, can increase the profitability of the company, although in a fairly long period of time. Therefore, it is becoming of interest for authors to analyze the extent to which the current ratio can affect the profitability ratio for real estate companies. (Wasterfield 2010:55)
In addition to the current ratio, other factor that may affect the profitability ratio is the activity ratio. Activity ratio according to Wasterfield, (2010:55) is a ratio to measure how far the effectiveness of the company in managing financial resources and can be measured from the total asset turnover, inventory turnover, and Working Capital Turn Over. The linkage between the current ratio and profitability ratio is where the net sales of the company increased certainly will increase the profitability ratio. However, it can be inversely if the assets of the company exceed net sales. Some real estate company erred in determining the company's assets so as to make the housing being sold into the company's assets. This causes the assets will experience a large increase compared to sales when homes sold is still small, therefore this research will try to analyze the linkages between the activity ratio, profitability ratio.
The final factor that may affect the profitability ratio is inflation. In economics, inflation is a process of rising prices in general and constantly associated with the market mechanism that can be caused by various factors, among others, private consumption increased, excess liquidity in the market which triggers consumption or even speculation, to include also due to the lack of launch distribution of goods. In other words, inflation is also a process of decline in currency values continuously. Inflation according to Pohan, (2008) is the process of an event, not the high-low price levels. That is, the price level is considered high is not necessarily indicating inflation. Inflation is an indicator to see the rate of change, and is considered to occur if the price increase takes place continuously and interplay of influence. Inflation relationships with profitability ratios have relevance because it affects the price of building materials. The raw material base of the building is a very important component for development. Therefore, inflation can affect the profitability of companies in the field of real estate companies.
In this study, the companies that will be examined are Lippo Karawaci, Bakrie Development, Ciputra Development, Sentul City, Bumi Citra Permai, Bekasi Asri Pemula, Alam Sutera Realty, and Agung Podomoro. The reason for the selection of these companies is because the company is engaged in the same, as well as data from the company that supplied complete until 2014. The last reasons of the selection of these companies are companies that are in the same grade, thus making the data obtained will be more specific.
From the description of the background research that has been described above, this research will be carried out to determine the effect of the current ratio, activity ratio and debt ratio to profitability ratio and further research will be followed by the title "The Effect of Current Ratio, Activity Ratio, Debt Ratio, and Inflation on Profitability Ratio in the Real Estate Company in Indonesia Stock
Exchange 2010-2013".
B. RESEARCH PROBLEM
1. Does current ratio have a significant impact on profitability ratio of Real Estate Companies in Indonesia Stock Exchange?
2. Does activity ratio have a significant impact on profitability ratio of Real Estate Companies in Indonesia Stock Exchange?
3. Does debt ratio have a significant impact on profitability ratio of Real Estate Companies in Indonesia Stock Exchange?
5. Do current ratio, activity ratio, debt ratio, and inflation simultaneously has a significant impact on profitability ratio of Real Estate Companies in Indonesia Stock Exchange?
C. PURPOSE AND BENEFITS
The purposes of this analysis are:
1. To determine the impact of current ratio towards profitability ratio if Real Estate Companies in Indonesia Stock Exchange;
2. To determine the impact of activity ratio towards profitability ratio if Real Estate Companies in Indonesia Stock Exchange;
3. To determine the impact of debt ratio towards profitability ratio if Real Estate Companies in Indonesia Stock Exchange;
4. To determine the impact of inflation towards profitability ratio if Real Estate Companies in Indonesia Stock Exchange;
5. To determine the impact of current ratio, activity ratio, debt ratio, and inflation towards profitability ratio if Real Estate Companies in Indonesia Stock Exchange
And the benefits of this analysis are:
1. For General
2. For Researcher
This research is a kind of skill training which is expected to sharpen the scientific thinking pattern by applying theories that have been obtained during study period, also increase the insight, knowing, and experience.
3. For Company
The result of this research can be as consideration in decision making process by management. This research also can make a company do a performance comparison with the competitors so company can improve their performance. 4. For Investor
The information of financial distress prediction helps the investors as a suggestion in investment activity, whether they will continue to invest their capital or to stop or delay their investment. However, the investors do not want to face the losses caused by investing their capital.
5. For Reader
CHAPTER II
LITERATURE REVIEW
A. Financial Management
1. Definition of Financial Management
According to (James C. van Home in Kasmir, 2010: 5), financial Management defined as all the activities that related with receiving, funding, managing the assets by several purposes. This definition shows that financial management is related to how to get the fund for paying its business, how manage the fund so that the goal of company can be reached, and how the company manage the assets effectively and efficient. Financial management also can be defined as an art and science for managing money which contains of process, institution, market, and instrument related to money transfer among individual, business, and government (Brigham in Kasmir, 2010: 22).
2. Financial Management Scope
The scope of financial management is defined into two categories, those are (Kasmir, 2010: 7-8):
a. Financial Service
Financial field relates to design making and product consultation both to individual, business, and government such as: Loan officers, Broker,
and Financial Consultant. b. Managerial Finance
management, credit administration, searching the fund and doing investment.
3. The Function of Financial Manager
According to (Fred in Kasmir, 2010: 16), the functions of financial manager are planning, searching, and using the fund to maximize the value of company, in other words, the activities related with decision of source and fund allocation.
The functions of financial manager are also defined as follows (Pearson, 2011: 9):
a. Making investment decisions (capital budgeting decisions).
b. Making decisions on how to finance these investments (capital structure decisions).
c. Managing funding for the company’s day-to-day operations (working capital management).
B. FINANCIAL RATIOS
1. Definition of Financial Ratios
Financial Ratios are ways of comparing and investigating the relationships between different pieces of financial information. Using ratios eliminates the size problem because the size effectively divides out.
2. Kinds of Financial Ratios
According to (Wasterfield, 2010:55), financial ratios are traditionally grouped into five categories:
a. Liquidity Ratios
Measure the ability of a firm to meet its short term obligations and reflect short term financial strength or solvency.
b. Debt Ratios
Measure how far a company’s assets are paid using its debt. It
means how much debt obligation is held by company compare to its assets. In a big meaning, leverage ratios are used to measure the company’s ability for paying all its obligations both short-term and long-term if the company is liquidated.
c. Activity Ratios
Measure the company’s effectiveness in using its own assets. On
the other word, these ratios are used to measure the level efficiency of company resource utilization. The efficiency, with which assets are used, is reflected in the speed and rapidity with which they are converted into sales.
d. Profitability Ratios
and manages its operations. This thing can be shown by profit which is earned by sales and investment income.
C. ANALYSIS OF FINANCIAL PERFORMANCE
According to Ahmad Rodoni and Herni Ali (2014) is a number of financial ratios derived from the comparison of a financial statement items with more posts that have a significant relationship. Financial ratios are very important in the analysis of the financial condition of a company.
Analysis of this ratio has advantages compared with other analytical techniques. The advantages are as follows: (Ahmad Rodoni and Herni Ali, 2014)
1. Financial ratios are numbers or summary statistics that are easier to read and interpret.
2. It is more simple replacement of the information presented financial statements is very detailed and complicated.
3. Knowing the company's position amid other industries.
4. Very useful for filling material in the decision-making models and predictive models.
5. Standardize the size of the company.
6. It is easier to compare one company with another company or see the development of the company periodically.
7. It is easier to see the trend of the company and make predictions in the future.
1. The decision in choosing the right ratio that can be used for the benefit of the wearer.
2. Limitations owned financial statements also be limitations techniques like this:
a. Material calculation of ratios or financial statements and the ratio of the value of the acquisition is not a market price.
b. The value contained in the financial statements and the ratio of the value of the acquisition is not the market price.
c. Classification in the financial statements may have an impact on the ratio.
d. The method of recording that is reflected in the accounting standards can be applied differently by different companies.
3. If the data is to calculate the ratio is not available, will make it difficult to calculate the risk.
4. It is difficult if the available data are not synchronized.
5. Two companies than could have been engineering and accounting standards used are not the same. Therefore, if the comparison could lead to errors.
Financial ratios are generally classified into four kinds, among others:
1. Liquidity Ratio 2. Activity Ratio 3. Debt Ratio
Ratios are included in each group ratio can be explained as follows:
a) Liquidity Ratio,
This measures the company’s ability to meet short-term obligations at maturity
Current ratio with a profitability ratio + because the current ratio formula itself current assets / current liabilities. Current assets can include cash, inventory, accounts receivable. Current debt = short-term debt to banks and debt that matures in almost a year. The relationship, if the assets, cash and inventory increased, then most likely it happens because the profit increases.
b) Activity Ratio,
This measures the company’s ability to use the available funds,
reflected in the turnover of capital
Activity ratio formula: Net Sales / Average Total Assets. Means if the activity ratio increases, net sales increased. If sales increase, a positive impact to the profitability ratio.
CR = Current assets Current liabilities
c) Debt ratio,
Which measures the company’s ability to pay off debt if one day the
company liquidated? This ratio also shows how much the company paid for by outsiders or creditors.
Debt ratio to profitability ratio + because if a firm's debt increases, it is usually the company that will carry out the debt for the purchase of equipment and assets (debt increases) for later screened for business activities with the hope of increasing the profitability ratio.
d) Profitability Ratio,
This measures the company’s ability to generate profits
Operating profit margin is the ratio between operating profit and sales. Operating profit margin is a ratio that describes what is usually called pure profit earned on every penny of sales made.
Operating profit is called pure (pure) in the sense that the number is exactly what actually obtained from the company's operations by ignoring financial obligations in the form of interest and obligations to the government in the form of tax payments. If the higher operatig profit margin will be better the operations of a company.
DR = Total Debt Total Assets
D. INFLATION
1. Definition of Inflation
The increase in the price of goods can be temporary or ongoing. When the increase lasts for a long time and occurs in almost all goods and services, then this phenomenon is called inflation. So, the price increase on one or two types of goods cannot be categorized as inflation. (Soesastro, 2005:56)
Thus, inflation (inflation) is the increase in the price of goods that are common and persistent. The opposite of inflation is deflation (deflation), a condition in which the price level has decreased continuously.
2. Types of Inflation
Types of inflation can we differentiate based on severity, the cause and origin based on the occurrence. (Prathama, 2008:367)
a. Inflation Based on severity
Low inflation. Inflation is said to be low if the price goes very slowly with a small percentage, which is below 10% a year.
1) Low inflation. Inflation is said to be low if the price goes very slowly with a small percentage, which is below 10% a year.
2) Inflation was. A country is said to experience a moderate inflation, if the percentage rate of inflation of 10% - 30% a year.
3) High inflation. Inflation is said to be high if the rate of inflation ranging from 30% - 100% a year.
people no longer have confidence in money; they prefer to exchange it for a particular item.
b. Under Inflation Causes
Inflation can also be distinguished by its cause, namely: 1) Demand-pull inflation
2) Cost-push inflation c. Originally Inflation Based
Based on the origin of inflation can be divided into the following.
1) Inflation due to the budget deficit. This type of inflation occurs as a result of growth in the money supply exceeds the demand for money. 2) Imported inflation. Imported inflation is inflation that occurred in a
country, for example some goods abroad is a factor of production in a country, price increases, then the price increases result in increased prices of goods in the country
3. Theories of Inflation
a. Kunatitas theory (Irving Fisher)
According to the quantity theory, if the money supply increases, the general price level will also rise. A direct relationship between price and quantity of money as represented by the simple quantity theory of money can be used to explain the inflation situation. (Boediono, 1985:169) b. Theory Keynes
groups who want a bigger share of that could be provided by the community. (Boediono, 1985:172)
c. Theory Structuralisms
This theory gives great attention to the structure of the economy in developing countries. Inflation in developing countries is mainly caused by factors of economic structure. According to this theory, the conditions of the economic structure of developing countries which can lead to inflation are:
1) Acceptance inelasticity Exports
2) Inelasticity offer or Domestic Food Production
4. Inflation Causes
According to Prathama, 2008:365 the cause of inflation in general can be divided into two, namely:
a. Demand-pull inflation
Increasing the demand for goods and services lead to increased demand for production factors. The increasing demand for production factors of production causes the price to rise. Thus, inflation occurs due to the increase in total demand as the economy is concerned in a situation of full employment. Inflation caused by excessive total demand resulting in a change in the price level is known as demand pull inflation.
b. Cost-push inflation
5. Impact of Inflation
Inflation has an impact on individuals as well as for economic activity broadly. The impact can be negative or positive, depending on the severity. (Sukirno, 2000:309)
a. Positive Impact
The positive influence of inflation occurs when the rate of inflation remained at a percentage rate of credit interest applicable. For example, at the time the credit interest rate is 15% per year and inflation rate of 5%. For developed countries, inflation as this would encourage economic activity and development. Why is that? This happens, because the businessmen / entrepreneurs in developed countries can take advantage of the price increase to invest, produce, and sell goods and services.
b. Negative Impact
Inflation is too high no small impact on the economy, particularly the level of prosperity of society. The inflationary impact, among others: 1) Impact of Inflation on Equity Income
2) Impact of Inflation on Output (Production) 3) Encouraging Investment Speculative
4) Interest Rate Rises lead and Investment Will Reduce 5) Uncertainty raises economic situation in the Future 6) The problem raises Balance of Payments
6. Inflation Overcome
a. Monetary Policy
According to the classical monetary theory, inflation occurs because the addition of the money supply. Thus, theoretically relatively easy to cope with inflation, by controlling the money supply itself. Monetary policy is the action taken by Bank Indonesia to reduce or increase the amount of money in circulation. When the money supply too much so that inflation rose sharply, Bank Indonesia will soon implement monetary policies to reduce the circulation of money. b. Fiscal Policy
How can fiscal policy to control inflation? As you know, fiscal policy is a policy relating to government revenue and expenditure. The government's fiscal policy to reduce inflation is to reduce government spending; raising tax rates and holds government loans.
c. Non-Monetary Policy and Fiscal Non-
In addition to monetary policy and fiscal policy, the government policy of non-monetary / non-fiscal with three ways of raising production, stabilize wages (salaries), and security prices, as well as the distribution of goods.
E. PREVIOUS RESEARCH
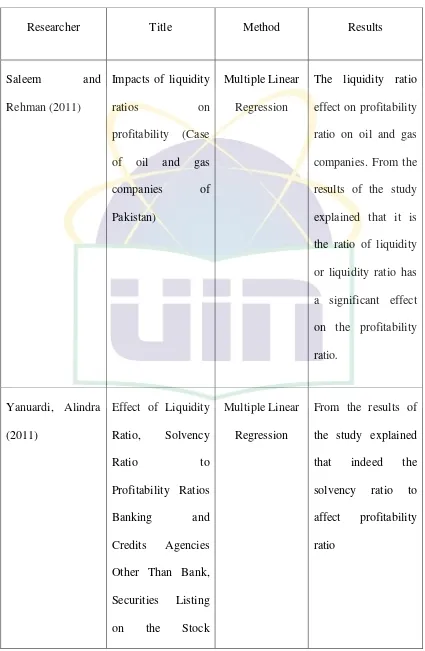
Table 2.1 Previous Research
Researcher Title Method Results
Exchange Before
Fengju et al (2013) The relationship between financial
Heikal et al (2014) Influence Analysis of Return on Assets
Multiple Linear Regression
(ROA), Return on Equity (ROE), Net Profit Margin (NPM), Debt To Equity Ratio (DER), and current ratio (CR), Against Corporate Profit
Growth In
Automotive In Indonesia Stock Exchange
that simultaneously independent
variables Return On Asset, Return On Equity, Net Profit Margin, To Equity Ratio and Current Ratio with F test, effected together to growth income significantly 0.000
F. RESEARCH FRAMEWORK
FIGURES 2.1
RESEARCH FRAMEWORK
Effect of Current Ratio, Activity Ratio, Debt Ratio, and Average Inflation on Profitability Ratio in the Real Estate Company in Indonesia Stock Exchange
2010-2013
Independent Variables 1. Current Ratio 2. Activity Ratio 3. Debt Ratio 4. Inflation
Dependent Variables Profitability Ratio
Classic Assumption Test Normality
Multicollinearity Heterocedasticity Autocorrelation
Multiple Linear Regressions Hypothesis Test Partial Test (t-Test) Simoultan Test (F-test)
Analysis, Interpretation, Limits, and Recommendation
G. HYPOTHESIS
Sugiyono (2008: 96) stated hypothesis is temporary answer to the formulation of research problems, in which the formulation of the problem has been expressed in the form of a question sentence. Said to be temporary because new answers given are based on relevant theory, not based on empirical facts. Furthermore, the hypothesis in this study is:
H1: Current ratio has a significant impact on profitability ratio Real Estate Company in Indonesia Stock Exchange.
H2: activity ratio has a significant impact on profitability ratio Real Estate Company in Indonesia Stock Exchange
H3: debt ratio has a significant impact on profitability ratio Real Estate Company in Indonesia Stock Exchange
H4: inflation has a significant impact on profitability ratio Real Estate Company in Indonesia Stock Exchange
H5: liquidity ratio, solvency ratio, activity ratio, and inflation simultaneously has
CHAPTER III
RESEARCH METHODOLOGY
A. FRAMEWORK
This study will begin from early research on the company property in Indonesia Stock Exchange. The basis of calculation in this study will be used from the literature study that has been engraved in Chapter 2. After getting the data that is needed, then the next will be analyzed the extent of the influence of the current ratio, activity ratio, debt ratio, and inflation to profitability ratio that later can be a conclusion and suggestions for Real Estate Company in Indonesia Stock Exchange.
B. RESEARCH DESIGN
This study used quantitative research methods with associative approach. The research method according Sugiyono (2012: 3) states that the research method is basically a scientific way to get data with the purpose and usefulness. Quantitative research methods according Sugiyono (2012: 13) states that the research method that is based on the philosophy passivism, used to examine the population or a particular sample, data collection using research instruments, quantitative data analysis / statistics, with the aim to test the hypothesis that has been set . Research associative according Sugiyono (2012: 36) is a study that aims to determine the relationship of two or more variables. In this study it will be able to build a theory that can be functioning to explain, predict, and control the symptoms.
The sampling method used in this research is purposive sampling method. Purposive sampling is a method which its sample is chosen based on compatibility between characteristic and sample criteria defined in order to reach representative sample. Those criteria are as follows:
1. Population in this research is all of the property and real estate companies that their financial reports are published by IDX in period 2010-2013.
2. Annual financial reports of those companies are published regularly, have complete financial data, and have components of calculation indicator which are needed in this research.
3. The purposive sampling was used to select the sample. Of the 19 companies listed, only eight (8) companies that meet criteria in four years’ time series. Therefore, a total of 32 annual reports of companies.
C. OPERATIONALIZATION OF VARIABLES
In this study, the variables used are as follows:
1. Independent variables used in this study are:
a) Liquidity ratio
This measures the company’s ability to meet short-term obligations at maturity
b) Activity Ratio,
This measures the company’s ability to use the available funds,
reflected in the turnover of capital
c) Debt ratio,
Which measures the company’s ability to pay off debt if one day the company liquidated. This ratio also shows how much the company paid for by outsiders or creditors.
d) Inflation
Indicators to see the rate of change, and is considered to occur if the price increase takes place continuously and the interplay of influences. The term inflation is also used to mean an increase in money supply which is sometimes seen as the cause of rising prices.
2. Dependent Variables used in this study is the
a) Profitability Ratio
This measures the company’s ability to generate profits AR = Cost of goods sold
Average inventory
DR = Total Debt Total Assets
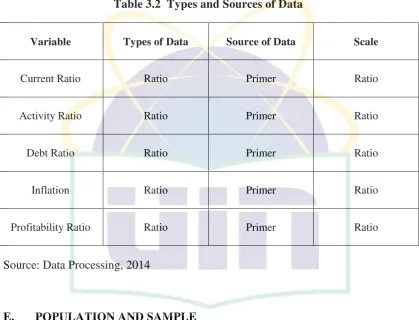
D. TYPES AND SOURCES OF DATA RESEARCH
This study will use a type of ordinal data that is then converted into interval data. To obtain these data, used questionnaire data collection tool. Here decomposition types and sources of data used in this study:
Table 3.2 Types and Sources of Data
Variable Types of Data Source of Data Scale
Current Ratio Ratio Primer Ratio
Activity Ratio Ratio Primer Ratio
Debt Ratio Ratio Primer Ratio
Inflation Ratio Primer Ratio
Profitability Ratio Ratio Primer Ratio
Source: Data Processing, 2014
E. POPULATION AND SAMPLE
Population is a group of object which has characteristic similarity in one or more things and creates main problem in a specific research. Hence, sample is a part of population which its characteristic will be observed and considered as representative of all population (Sugiyono, 2011:39).
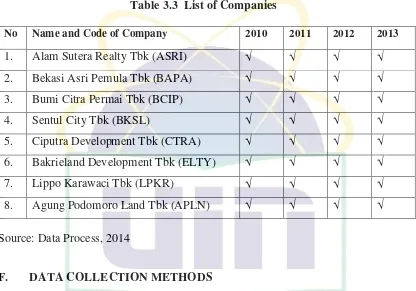
the selection of these companies because these companies have similarities in their assets, thus making the data obtained will be more specific, because we can assume that all companies have the same grade. The population in this study is the financial data’s of Property Company which are:
Table 3.3 List of Companies
No Name and Code of Company 2010 2011 2012 2013
1. Alam Sutera Realty Tbk (ASRI) √ √ √ √
2. Bekasi Asri Pemula Tbk (BAPA) √ √ √ √
3. Bumi Citra Permai Tbk (BCIP) √ √ √ √
4. Sentul City Tbk (BKSL) √ √ √ √
5. Ciputra Development Tbk (CTRA) √ √ √ √
6. Bakrieland Development Tbk (ELTY) √ √ √ √
7. Lippo Karawaci Tbk (LPKR) √ √ √ √
8. Agung Podomoro Land Tbk (APLN) √ √ √ √
Source: Data Process, 2014
F. DATA COLLECTION METHODS
The type of data in this research is quantitative data which is the numbers that have units of count and can be calculated mathematically. The data in this research is gotten by using two kinds of method, those are:
1. Literature method; conducted by doing exploration and literature review. The researcher assesses information through books, journals, literature, and others that related to support this research.
Stock Exchange which is included in Indonesian Capital Market Directory (ICMD) from year 2010 to 2013. Hence, the data of exchange rate, interest rate, and inflation are obtained from Indonesian Financial Statistics issued by Indonesia Bank and issuance of publications such as: Financial Statements of Bank Indonesia, Central Bureau of Statistics, and other sources.
G. DATA PROCESSING METHOD
1. Normality Test
Normality test is performed to determine whether the data are normally distributed population. Normality test for each variable is done by looking at the distribution of data points on the graph QQ plot. Data - Data from a variable can be said to be normal, if the distribution of the data are spread on a straight line plot point.
According Sarjono and Julianita (2011:64) states that the normality test if the researcher has the respondent >50, then Sig. Kolmogorov-Smirnov compared with alpha, whereas if the researcher has the following respondents <50, then Sig. Shapiro-Wilk compared with Alpha to test the normality of the data obtained by the researcher. Because the respondent in this research are more than 50, then Sig. Kolmogorov-Smirnov compared with alpha will be used.
Basis for a decision on the normality test is as follows:
If the numeric significance Kolmogorov-Smirnov Test Sig <0, 05 then the data distribution is not normal.
The value of Sig. or significance can be obtained by calculating a test of normality or plot through SPSS tools with confidence level of 95% or 5% error rate. Also in the figure of Q-Q plot is straight line from left to right. The line was derived from the value of Z. if the data is normal distribution, then the data will be scattered around the line.
2. Multicollinearity Test
Multicolinierity test aims to test whether the regression model found a correlation between the independent variables (independent) (Ghozali, 2006). Results are expected in testing is not the correlation between the independent variables. There are several ways to test whether or not multicoloniarity in the regression model. In this test, the researchers used the analysis of the correlation matrix between the independent variables by looking at the value of Tolerance and Variance Inflation Factor (VIF). If the tolerance value is greater than or equal to 0.10 VIF value of less than 10, it means not occur multicoloniarity in the regression model.
3. Heteroscedastity Test
there is no obvious anyway, as well as the points spread above and below the number 0 on the Y axis, it does not happen heteroscedasticity (homoscedasticity)
4. Multiple Linear Regressions
Based on the opinion Engkos, Kuncoro Ahmad and Riduwan (2007:83) regression is a process of systematically estimate of what is most likely to happen in the future based on past and present information that is held so that mistakes can be minimized.
Multiple regression aims to quantify the effect of two or more independent variables on a dependent variable and the dependent variable predicted by using two or more independent variables. Criteria that must be met for the regression is independent variable and the dependent variable must be interval scale. The general formula of the regression is:
Y = a + b2 x2 + b1x1 +b x3 Decryption:
Y = independent variable (independent variable) X = independent variable (independent variable) a = regression constant.
b = slope of the regression line.
5. Hypothesis Test
a. Test for the Significance of the Partial Multiple Regression Model
(t-test)
This test used to know whether independent variables partially influence toward dependent variable or not, by assuming other independent variables are constant (Engkos and Riduwan 2007).
1) H0: βi = 0
It means the independent variables are not significant explanatory toward dependent variable.
2) Ha: βi≠ 0
It means the independent variables are significant explanatory toward dependent variable.
Testing criteria which is used in this test is by comparing significance value reached by level significance defined that is 0.05. If the significance value < 0.05, thus the independent variables can influence dependent variable significantly. In other words, the hypothesis is accepted.
b. Test for the Significance of the Overall Multiple Regression
Model (F-test)
1) H0: β1= β2= …….= β7 = 0
There is no linear relationship between the dependent variable and the independent variables. It means all independent variables are not significant explanatory toward dependent variable.
2) Ha: At least one β1≠ 0, j = 1,2, ….. , k
There is linear relationship between the dependent variable and at least one of the independent variables. It means all independent variables are
CHAPTER IV
FINDING AND ANALYSES
A. GENERAL DESCRIPTION OF RESEARCH OBJECT
This chapter presents and discusses the findings of the research conducted. This study was a descriptive study on the influence of internal factors such as current ratio, liquidity ratio and debt ratio of the company as well as external factors such as inflation on profit ratio. The financial data of the selected companies compiled from data from the annual reports of listed companies in Indonesia Stock Exchange in 2010-2013. The period 2010-2013 was chosen to meet the requirements of research methods. That hypothesis was tested with multiple regression method. The sample selection criteria chosen by the company which has been described in research methodology in the previous chapter.
1. Overview of selected companies
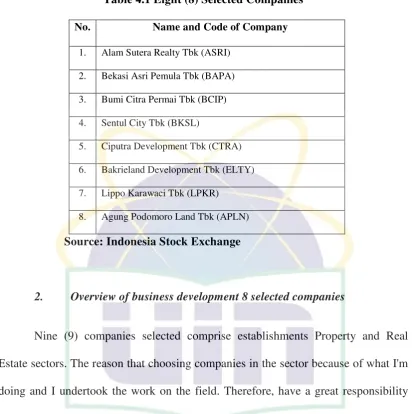
In the 2010-2013, the company is listed on the Indonesia Stock Exchange on subsectors Property & Real Estate are 19 companies. The purposive sampling was used to select the sample. Of the 19 companies listed, only eight (8) companies that meet criteria in four years’ timeseries. Therefore, a total of 32 annual reports of companies.
Table 4.1 Eight (8) Selected Companies
No. Name and Code of Company
1. Alam Sutera Realty Tbk (ASRI)
2. Bekasi Asri Pemula Tbk (BAPA)
3. Bumi Citra Permai Tbk (BCIP)
4. Sentul City Tbk (BKSL)
5. Ciputra Development Tbk (CTRA)
6. Bakrieland Development Tbk (ELTY)
7. Lippo Karawaci Tbk (LPKR)
8. Agung Podomoro Land Tbk (APLN)
Source: Indonesia Stock Exchange
2. Overview of business development 8 selected companies
Nine (9) companies selected comprise establishments Property and Real Estate sectors. The reason that choosing companies in the sector because of what I'm doing and I undertook the work on the field. Therefore, have a great responsibility for the disclosure of sustainability reports.
B. ANALYSIS AND DISCUSSION
1. Descriptive Analysis
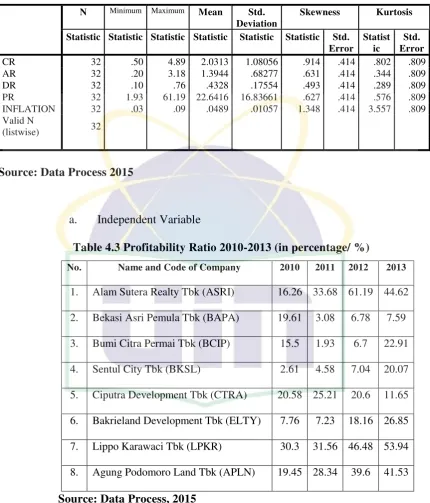
Table 4.2 Descriptive Statistics
Source: Data Process 2015
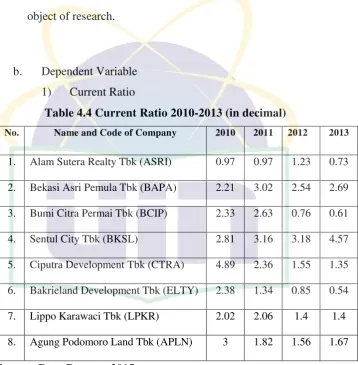
a. Independent Variable
Table 4.3 Profitability Ratio 2010-2013 (in percentage/ %)
No. Name and Code of Company 2010 2011 2012 2013
Based on the statistic calculation which is included in table above, the results can be explained as follows:
For the variable profitability ratio, the value of the average profitability of all companies surveyed is 22.64%. Furthermore, the highest value of the entire period is at the point of 61.18% and the N Minimum Maximum Mean Std.
Deviation
Skewness Kurtosis
lowest value of all periods contained in point 1.93%. Standard deviation indicates the fluctuation of data where the data are fluctuations in the value of 16.83%. With an average value greater than the standard deviation, it indicates that there is no movement of the extreme value of the average profitability ratio in the whole object of research.
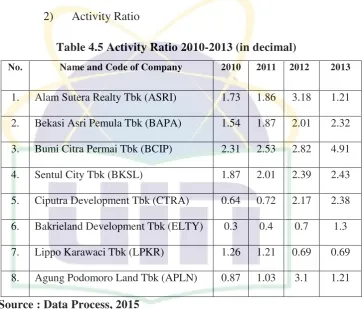
b. Dependent Variable 1) Current Ratio
Table 4.4 Current Ratio 2010-2013 (in decimal)
No. Name and Code of Company 2010 2011 2012 2013
1. Alam Sutera Realty Tbk (ASRI) 0.97 0.97 1.23 0.73
2. Bekasi Asri Pemula Tbk (BAPA) 2.21 3.02 2.54 2.69
3. Bumi Citra Permai Tbk (BCIP) 2.33 2.63 0.76 0.61
4. Sentul City Tbk (BKSL) 2.81 3.16 3.18 4.57
5. Ciputra Development Tbk (CTRA) 4.89 2.36 1.55 1.35
6. Bakrieland Development Tbk (ELTY) 2.38 1.34 0.85 0.54
7. Lippo Karawaci Tbk (LPKR) 2.02 2.06 1.4 1.4
8. Agung Podomoro Land Tbk (APLN) 3 1.82 1.56 1.67
Source: Data Process, 2015
Based on the statistic calculation which is included in table above, the results can be explained as follows:
fluctuation of data where the data are fluctuations in the value of 1.080. With an average value greater than the standard deviation, it indicates that there is no movement of the extreme value of the average current ratio on the whole object of research.
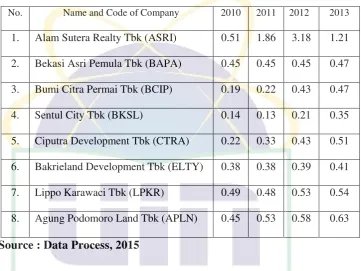
2) Activity Ratio
Table 4.5 Activity Ratio 2010-2013 (in decimal)
No. Name and Code of Company 2010 2011 2012 2013
1. Alam Sutera Realty Tbk (ASRI) 1.73 1.86 3.18 1.21
2. Bekasi Asri Pemula Tbk (BAPA) 1.54 1.87 2.01 2.32
3. Bumi Citra Permai Tbk (BCIP) 2.31 2.53 2.82 4.91
4. Sentul City Tbk (BKSL) 1.87 2.01 2.39 2.43
5. Ciputra Development Tbk (CTRA) 0.64 0.72 2.17 2.38
6. Bakrieland Development Tbk (ELTY) 0.3 0.4 0.7 1.3
7. Lippo Karawaci Tbk (LPKR) 1.26 1.21 0.69 0.69
8. Agung Podomoro Land Tbk (APLN) 0.87 1.03 3.1 1.21
Source : Data Process, 2015
Based on the statistic calculation which is included in table above, the results can be explained as follows:
there is no movement of the extreme value of the average activity ratio in the whole object of research.
3) Debt Ratio
Table 4.6 Debt Ratio 2010-2013 (in decimal)
No. Name and Code of Company 2010 2011 2012 2013
1. Alam Sutera Realty Tbk (ASRI) 0.51 1.86 3.18 1.21
2. Bekasi Asri Pemula Tbk (BAPA) 0.45 0.45 0.45 0.47
3. Bumi Citra Permai Tbk (BCIP) 0.19 0.22 0.43 0.47
4. Sentul City Tbk (BKSL) 0.14 0.13 0.21 0.35
5. Ciputra Development Tbk (CTRA) 0.22 0.33 0.43 0.51
6. Bakrieland Development Tbk (ELTY) 0.38 0.38 0.39 0.41
7. Lippo Karawaci Tbk (LPKR) 0.49 0.48 0.53 0.54
8. Agung Podomoro Land Tbk (APLN) 0.45 0.53 0.58 0.63
Source : Data Process, 2015
Based on the statistic calculation which is included in table above, the results can be explained as follows:
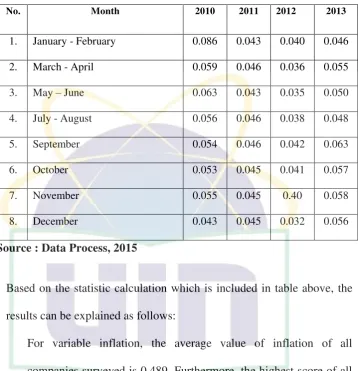
4) Inflation
Table 4.7 Inflation 2010-2013 (in decimal)
No. Month 2010 2011 2012 2013
1. January - February 0.086 0.043 0.040 0.046
2. March - April 0.059 0.046 0.036 0.055
3. May – June 0.063 0.043 0.035 0.050
4. July - August 0.056 0.046 0.038 0.048
5. September 0.054 0.046 0.042 0.063
6. October 0.053 0.045 0.041 0.057
7. November 0.055 0.045 0.40 0.058
8. December 0.043 0.045 0.032 0.056
Source : Data Process, 2015
Based on the statistic calculation which is included in table above, the results can be explained as follows:
2. Data Processing
a. Classic Assumption Test
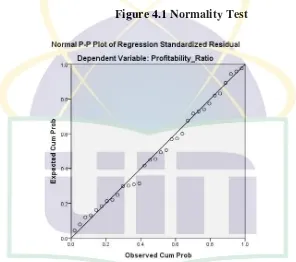
1) Normality
Normality test is used to ensure that all the data is still at the normal level or not there is an extreme value that interfere with research results. Here are the results of the testing of normality
Figure 4.1 Normality Test
To see the normality test, it appears that the whole dots still are at about the linearity means the whole of the data used still meet the assumption of normality.
2) Multicolinearity Test
members of independent variables is equal to zero (0). Multicollinearity can be known from the value of tolerance and
Variance Inflation Factor (VIF). If the tolerance value is greater than 0.1 and VIF values smaller than 10, then the regression is free from multicollinearity. VIF and Tolerance value from independent variables on regression model can be seen in table below:
Table 4.8 The Result of Multicolinearity Test
Coefficientsa
Model Collinearity Statistics Conclusion Tolerance VIF
1
(Constant)
CR ,947 1,056 No Multicollinearity
AR ,702 1,425 No Multicollinearity
DR ,558 1,791 No Multicollinearity
INFLATION ,545 1,835 No Multicollinearity
a. Dependent Variable: PR
The result shows that the VIF values of all independent variables having a value smaller than 10 (> 1.056, 1.425, 1.791 and 1.835), It means that the variables of the study did not show any multicollinearity in the regression model.
3) Heteroscedacticity Test
Aims to test whether in the regression model have the variance inequality from one residual observation to the order. If the variance of residual is fixed, then it is called homoscedasticity and if different called heteroscedasticity.
The method used to detect the presence of absence of
heteroscedasticity is to look at the heteroscedasticity graph between the predicted values of the dependent variable with independent variables. From the scatterplot below show the dots spread as randomly and spread above and below 0 and Y axis, it means that there is no heteroscedasticity on the regression model, so the regression model is proper to use on the test. To be more can be seen on figure 4.11 below:
Figure 4.2 Scatterplot Dependent Variable
4) Autocorrelation
Table 4.9 Autocorrelation
a. Predictors: (Constant), Inflation, Current_Ratio, Activity_Ratio, Debt_Ratio b. Dependent Variable: Profitability_Ratio dU, it does not produce definitive conclusions.
c. Hypothesis Test
1) F-test
F test measures the significance of independent variable (CR, AR, DR, INFLATION) in affecting dependent variables (PR). The output of F test can be show below:
Table 4.11 F-test
b. Predictors: (Constant), INFLATION, CR, AR, DR
Ho: CR, AR, DR, INFLATION does not have a significant effect on PR
Ha: CR, AR, DR, INFLATION has a significant effect on PR Basic Decision
Sig> Alpha, then Ho is accepted Sig <Alpha, then Ha accepted Decision
Sig = 0.000 Alpha = 0.05
Then, the Sig> Alpha, Ho accepted Result
Through testing the significance of the above, it can be concluded that CR, AR, DR, INFLATION has a significant effect on PR
2) t-Test
t Sig. Correlations Collinearity
Statistics
INFLATION 947,176 180,568 ,594 5,24
6 ,000 ,783 ,710 ,439 ,545 1,835
a. Dependent Variable: PR
From the above table, it can be concluded hypothesis testing as follows: a) For the purpose of CR
Basic Decision
Sig> Alpha, then Ho is accepted Sig <Alpha, then Ha accepted Decision
Sig = 0.715 Alpha = 0:05
Then, the Sig> Alpha, Ho accepted Result
Through testing the significance of the above, it can be concluded that the CR does not have a significant effect on PR.
b) For the purpose of AR
Ho: AR does not have a significant effect on PR Ha: AR has a significant effect on PR
Basic Decision
Sig> Alpha, then Ho is accepted Sig <Alpha, then Ha accepted Decision
Sig = 0.256 Alpha = 0:05
Then, the Sig> Alpha, Ho accepted Result
Through testing the significance of the above, it can be concluded that the AR did not have a significant effect on PR.
c) For the purpose of DR
Ha: DR has a significant effect on PR Basic Decision
Sig> Alpha, then Ho is accepted Sig <Alpha, then Ha accepted Decision
Sig = 0.000 Alpha = 0:05
So, Sig <Alpha, Ha accepted Result
Through testing the significance of the above, it can be concluded that the DR has a significant effect on PR.
d) For the purpose of Inflation
Ho: Inflation does not have a significant effect on PR Ha: Inflation has a significant effect on PR
Basic Decision
Sig> Alpha, then Ho is accepted Sig <Alpha, then Ha accepted Decision
Sig = 0.000 Alpha = 0:05
So, Sig <Alpha, Ho accepted Result
d. Regression Equation
Furthermore, based on table 4.26, the SPSS result of coefficient regression formed a multiple linear regression equation as follow
Y=-47.047+0.494CR+2.859AR+42.457DR+947.176INFLATION+e
This means that:
Y value when the variable CR, AR, DR and Inflation = 0 is -47 047 which means that all changes in Y has a high dependence on the value of CR, AR, DR, and Inflation.
If the DR increased by 1 point while CR, AR, and inflation has a fixed point it will affect Y or PR by 42.457%
If the Inflation increased by 1 point while CR, AR, and DR has a fixed point it will affect Y or PR by 947.176%
e. Coefficient of Determination (R Square)
Coefficient determination measures the ability of independent variable (CR, AR, DR, INFLATION) elaborate dependent variables (PR). Coefficient determination value shows how much variation in the data can be explained by the regression model built.
Table 4.13 Coefficient of Determination (R Square) Model Summaryb
Model R R Square Adjusted R
Square
Std. Error of the
Estimate
Durbin-Watson
1 .901a .811 .783 7.84257 1.333
a. Predictors: (Constant), Inflation, Current_Ratio, Activity_Ratio, Debt_Ratio
b. Dependent Variable: Profitability_Ratio
CHAPTER V
CONCLUSSION
A. Conclusion
From the research that has been carried out, it can be concluded some of the following:
1. Current ratio does not have a significant effect on the profitability ratio on the real estate company in the Indonesian Stock Exchange from 2010 to 2013 Activity ratio does not have a significant effect on the profitability ratio on the real estate company in the Indonesian Stock Exchange 2010-2013 where any increase in the value of the variable current ratio, the ratio of the value of profitability will also increase.
2. Debt ratio has a significant effect on the profitability ratio on the real estate company in the Indonesian Stock Exchange 2010-2013 where any increase in the value of the variable debt ratio, the ratio of the value of profitability will also increase.
3. Inflation has a significant effect on the profitability ratio on the real estate company in the Indonesian Stock Exchange 2010-2013 where any increase in the value of the variable inflation; the profitability ratio value will also increase.
B. Implication & Recommendation
Furthermore, from the conclusions are found, then the advice that can be given to the company notice of the data processing is:
1. Judging from the effects produced by the debt ratio to profitability ratio, so if the real estate company on the Indonesian Stock Exchange 2010-2013 wants to improve the profitability ratio, then the company may increase the debt ratio by increasing loans to banks that the loan will be transferred to develop business for the purchase of operational equipment and could ultimately increase revenue and improve profitability.
2. Judging from the effects produced by the inflation of the profitability ratio, so if the real estate company on the Indonesian Stock Exchange 2010 to 2013 wanted to improve the profitability ratio, so companies are advised to continue to monitor the state of the global economy can be contributing factor inflation in Indonesia. Because, while rising inflation means prices will keep rising. In such circumstances, companies can set up home sales profit margin exceeds the percentage increase in inflation and eventually also will boost profits.
Recommendations of this study are:
2. This study is also limited to companies that only use the property and the population of real estate companies with a limited sample of 19 companies can only use traditional 8 companies because of the availability of complete data, and the similarities in their assets. Thus, this study needs to be developed further with the scope of the wider population as all companies listed on the Indonesia Stock Exchange and broader sample.
REFFERENCES
Ahmad Rodoni dan Herni Ali. (2014). Manajemen Keuangan. Jakarta: Mitra Wacana Media.
Bailey,J.E.and S.W.Pearson. (2011). “ Development of a Tool For Measuring and
Analyzing Computer User Satisfaction“. Management Science
Boediono, (1985). Ekonomi Makro. Yogyakarta : BPFE.
David, Fred, R. (2010). Manajemen Strategis. Jakarta: Salemba Empat
Engkos, Kuncoro Ahmad and Riduwan (2008). Cara Menggunakan dan Memaknai Analisis Jalur. Bandung: Alfabeta
Engkos, Kuncoro Ahmad dan Riduwan (2007). Cara Menggunakan dan Memaknai Analisis Jalur. Bandung: Alfabeta
Fengju, Xu., Fard, Rasool Yari., Maher, Leila Ghassab., Akhteghan, Nader. (2013).
The relationship between financial leverage and profitability with an emphasis
on income smoothing in Iran’s capital market. vol.2, No. 3(s), pp. 156-164 Ghozali, Imam. (2006). Aplikasi Analisis Multivariate Dengan Program SPSS.
Semarang: Badan Penerbit Undip
Harahap, Sofyan Syafri. (2004). Akuntansi Aktiva Tetap, Edisi Ketiga. Jakarta: PT. Raja Grafindo
Heikal et al. (2014). Influence Analysis of Return on Assets (ROA), Return on Equity (ROE), Net Profit Margin (NPM), Debt To Equity Ratio (DER), and current ratio (CR), Against Corporate Profit Growth In Automotive In Indonesia Stock
Exchange. ISSN 1450-2275 Issue 63 February, 2014
http://www.rei.or.id/liputan-57-bisnis%20properti%20tumbuh%2030persen.php
Kabajeh, Majed Abdel Majid, Nu’aimat, Said Mukhled Ahmed., Damhash, Firas Naim. (2012). The Relationship between the ROA, ROE and ROI Ratios with Jordanian Insurance Public Companies Market Share Prices. Vol. 2 No. 11; June 2012
Kasmir. 2010. Analisis Laporan Keuangan. Penerbit PT Rajagrafindo Persada, Jakarta.
Maharso, S. (2012, Maret 12). Setyo Maharso: 2013, Pertumbuhan Properti Naik 20%. (A. Erawan, Pewawancara)
Prathama Rahardja dan Manurung, Mandala. (2004), Uang, Perbankan, dan Ekonomi Moneter, Jakarta: Penerbit Fakultas Ekonomi Universitas Indonesia.
Ross, S.A.,Westerfield, R.W., Jaffe, R.W., Jordan, B.D. (2008) Modern Financial Management (8th ed.). New York: McGraw-Hill.
Ross, Stephen A. Westerfieldn, Radolp W., Brandford, Jordan. (2010). Pengantar
Keuangan Perusahaan (Corporate Finance Fundamentals). Jakarta: Salemba
Empat
Saleem and Rehman. (2011). Impacts of liquidity ratios on profitability (Case of oil and gas companies of Pakistan). Vol. 1, Issue. 7, July 2011(pp.95-98)
Sarjono, Haryadi dan Winda Julianita. (2011). SPSS vs LISREL: Sebuah Pengantar, Aplikasi untuk Riset. Jakarta: Salemba Empat
Soesastro, H, dkk. (2005). Pemikiran dan Permasalahan Ekonomi di Indonesia dalam Setengah Abad Terakhir Jilid I (1945-1959). Jakarta: Kanisius
Solihin. (2009). Pengantar Manajemen. Jakarta: Erlangga
Sugiyono. (2008). Metode Penelitian Kuantitatif Kualitatif dan R&D. Bandung: Alfabeta
Sugiyono. (2012). Metode Penelitian Kuantitatif Kualitatif dan R&D. Bandung: Alfabeta.
Sukirno, Sadono. (2000). Pengantar Teori Mikroekonomi. Jakarta: Raja Grafindo Persada.
Sutrisno. (2003). Manajemen Keuangan (Teori, Konsep, dan Aplikasi), Edisi
Pertama, Cetakan Kedua. Yogtakarta: EKONISIA
APPENDIX
Impacts of liquidity ratios on profitability (Case of
Yanuardi, Alindra (2011) Effect of Liquidity Ratio, Solvency Ratio to
Kabajeh et al (2012) The Relationship between the ROA, ROE and ROI between the activity ratios with a profitability ratio; however, it was found that there is no significant effect between the two.
Heikal et al (2014) Influence Analysis of
Approach Analytical Object Time-Horizon
P-1 Quantitative Survey Associative Organization Cross-Sectional
P-2 Quantitative Survey Associative Organization Cross-Sectional
P-3 Quantitative Survey Associative Organization Cross-Sectional
P-4 Quantitative Survey Associative Organization Cross-Sectional
P-5 Quantitative Survey Associative Organization Cross-Sectional
Source: Data Processing, 2014
Table3.2 Types and Sources of Data
Variable Types of Data Source of Data Scale
Current Ratio Ratio Primer Ratio
Activity Ratio Ratio Primer Ratio
Debt Ratio Ratio Primer Ratio
Inflation Ratio Primer Ratio
Profitability Ratio Ratio Primer Ratio
Table 3.3 List of Companies
No Name and Code of Company 2010 2011 2012 2013
1. Alam Sutera Realty Tbk (ASRI) √ √ √ √
2. Bekasi Asri Pemula Tbk (BAPA) √ √ √ √
3. Bumi Citra Permai Tbk (BCIP) √ √ √ √
4. Sentul City Tbk (BKSL) √ √ √ √
5. Ciputra Development Tbk (CTRA) √ √ √ √
6. Bakrieland Development Tbk (ELTY) √ √ √ √
7. Lippo Karawaci Tbk (LPKR) √ √ √ √
8. Agung Podomoro Land Tbk (APLN) √ √ √ √
Source: Data Process, 2014
Table 3.4 The Interpretation of r Coefficient Correlation Value
Coefficient Interval Correlation Level
0,80 – 1,000 Very Strong
0,60 – 0,799 Strong
0,40 – 0,599 Strong Enough
0,20 – 0,399 Weak
0,00 – 0,199 Very Weak
Source: Data Process
Table 4.1 Eight (8) Selected Companies
No. Name and Code of Company
1. Alam Sutera Realty Tbk (ASRI)
2. Bekasi Asri Pemula Tbk (BAPA)
3. Bumi Citra Permai Tbk (BCIP)
4. Sentul City Tbk (BKSL)
5. Ciputra Development Tbk (CTRA)
6. Bakrieland Development Tbk (ELTY)
7. Lippo Karawaci Tbk (LPKR)
8. Agung Podomoro Land Tbk (APLN)
Source: Data Process 2015
N Minimum Maximu
m Mean Deviation Std. Skewness Kurtosis