Effect of Return on Asset, Return on Equity, Debt to Equity Ratio to
Return Stock Company Property and Real Estate In Indonesia Stock
Exchange
Febriyansyah Lukmana Putra1,Siti Nurlaela2, Yuli Chomsatu Samrotun3 Universitas Islam Batik Surakarta, JL. H. Agus Salim No. 10, Surakarta, Indonesia
e-mail: [email protected]
Abstract: This study aimed to determine the effect of Return on Assets, Return on Equity and Debt to Equity Ratio on stock returns Property and Real Estate in the Indonesian Stock Exchange. The sample used in this study as many as 29 companies Property and Real Estate in Indonesia Stock Exchange period 2012 - 2016. The technique of sampling using purposive sampling method. Testing the hypothesis in this study using multiple regression analysis. Results shows simultaneously throughout the study variables affect the stock returns, while partially 1) Return on Assets no effect on stock returns, 2) Return on Equity effect on stock returns, 3) Debt to Equity Ratio has no effect on stock returns.
Keywords: ROA, ROE, DER and stock returns
1. INTRODUCTION
Business property and real estate is projected to improve by the end of 2017. This is because the ASEAN Capital Markets Forum (ACMF) standard launched a Green Bond ASEAN to accelerate their sustainable development in the ASEAN region (Financial Services Authority, 2017). Green bonds are one type of financing the infrastructure and construction sector. ACMF is a group of high-level capital market regulators of ASEAN countries such as Brunei Darussalam, Cambodia, Indonesia, Laos, Malaysia, Myanmar, Philippines, Singapore, Thailand, and Vietnam, to encourage its members active in building the system of financing for sustainable development (Financial Services Authority, 2017 ).
ASEAN Capital Market Forum (ACFM) projected 2020 financing projects environmentally friendly (green financing) increased to 1 trillion dollars (Financial Services Authority, 2017). The prospects of a good response in the
Indonesian capital markets by encouraging issuers engaged in property and real estate sector to actively meet their green program of this bond. The project is expected to stimulate business growth in property and real estate in Indonesia.
Capital market an investment alternative for investors (Marfuah & Nurlaela, 2017), Capital markets bring together owners of the funds with the funds for medium-term investment objectives and long-term (Sari, Subroto, & Nurlaela, 2016), The main motivation of investors to invest is to obtain returns that much. Return the results obtained from investing activities (Listianingrum, Wijayanti, & Nurlaela, 2016), Return can be divided into two, namely, the realization of returns (returns that have already occurred) and the expected return (return is not yet occurred) or the return expected by investors in the future. Changing the return is caused by many factors.
(ROA), Return on Equity (ROE), and Debt to Equity Ratio (DER). ROA and ROE reflects the company's ability to generate profits (Purnamasari, 2015), The higher the ROA and ROE then the ability to generate profit is also high. While the DER is the ratio of debt to capital, the lower the higher DER capital owned by the company (Acheampong, Agalega, and Shibu, 2014),
ROA is the company's ability to generate profits using existing total assets (Rahadia, Nurlaela, & Titisari, 2013), With a high profit, the investors get a high return.
Return on Equity(ROE) is the
company's ability to generate profits based on capital owned net. Companies that have a high ROE tends to be favored by investors, for companies that have a high ROE will generate high profit anyway, so it will be a positive influence on stock returns (Sailendra & Suratno, 2014)
Debt to Equity Ratio (DER) is the ability to meet the company's short- and long-term liabilities. DER provide a guarantee about how much debt the company that secured the company's capital used as sources of business funding. The greater the value of DER indicates capital structure more use of debt relative to equity, so that a high DER reflect the company's risk is relatively high, as a result investors tend to avoid stocks that have a high DER. The higher debt (DER) tends to lower stock returns (Sudarsono, Bambang, & Sudiyatno, 2016),
According to research Listianingrum et al (2016) in the "influence of financial ratios on stock returns on property and real estate companies listed on the stock exchanges of Indonesia". Statistical test results showed Debt to Equity Ratio (DER) has no impact on stock return, this is contrary to research (Arista, 2012) in his research stating that Debt to Equity
Ratio (DER) has a significant effect on stock returns.
According to research Arista (2012) in the "analysis of the factors that affect stock returns in manufacturing companies that went public on the Stock Exchange 2005-2009". Statistical test results showed Return On Asset no significant effect on stock returns. This contrasts with researchSudarsono (2016) stated Return On Asset (ROA) has a positive effect on stock returns.
Differences in results conducted previous research related to the Return on Assets (ROA), Return on Equity (ROE), and Debt To Equity Ratio (DER), have inconsistent results. it makes researchers want to examine more deeply these variables do influence the stock return. Based on this background, the researchers interested in conducting a study entitled Effect of Return on Assets, Return on Equity, Debt To Equity Ratio on stock returns Property and Real Estate in the Indonesian stock exchange 2012-2016 period.
2. METHODOLOGY
This type of research used in this research is quantitative research using the data in the form of figures and statistical analysis (Sugiyono, 2015), The dependent variable in this study is a stock return. The independent variable in this study is ROA, ROE and DER. The population in this study is the property and real estate company listed on the Stock Exchange in 2012-2016. The criteria for sampling in this study are as follows:
a. Property and Real Estate companies that publish financial reports are complete and consecutive years from 2012 to 2016.
c. Property and Real Estate Company did not experience losses during the year of the observation period 2012-2016.
d. Property and Real Estate Company uses as the functional currency rupiah rupiah, to avoid any bias on the exchange rate.
3. DATA ANALYSIS METHOD
3.1 Test Descriptive
Descriptive statistics include the mean, minimum, maximum, and standard deviation which aims to determine the distribution of data in the research samples (Arikunto, 2006).
3.2 Classical Assumption Test
Testing the assumptions of classical regression model is required before testing the hypothesis. This test consists of normality test, multikolonearitas, autocorrelation test, and test heterokedastisitas.
3.3 Regression Analysis
Multiple regression analysis was conducted to test the effect of two or more independent variables to the dependent variable (Ghozali, 2016),
Y = a + b1 X1 X2 + b2 + b3 X3 + e
Description:
Y = return stock
a = constant
b1-3 = Coefficient of regression
X1 = Return On Asset (ROA)
X2 = Return On Equity (ROE)
X3 = Debt to Equity Ratio (DER)
e = Error
3.3.1 Test t
The test is performed to determine the effect of each independent variable or partially ROA, ROE, and DER on stock returns on property and real estate company
listed on the Stock Exchange 2012-2016 period
3.3.2 Test f
Test Goodness of Fit is one form of testing the feasibility of a model that aims to describe the interactions between the variables studied (Ghozali, 2016),
3.3.3 Test Coefficient of Determination
The coefficient of determination used to determine the effect of independent variables on the dependent variable. The coefficient of determination is essentially measuring how far the model's ability to explain variations in the dependent variable.
4. RESULTS AND DISCUSSION
4.1 Descriptive Statistics
Descriptive statistics include the mean, minimum, maximum, and standard deviation which aims to determine the distribution of data in the research samples.
Table 1 Descriptive Statistics Test Results
variable N Mean Min Max Std. dev ROA 136 5.4577
5
0,003 16.870 4.060290
ROE 136 12.102 80
0,003 33 130 8.603144
DER 136 1.4428 5
0.074 23.950 2.206187
Stock returns
valid N (Listwise)
136
136 0.1763
1
-0.875 2,630 0.548832
Source: Data processed, 2017
minimum value and a maximum value of 16.870. While the mean value of 5.45775, a standard deviation value of 4.060290. ROE for the minimum values obtained 0,003 and a maximum value of 33 130. As for the obtained at 12.10280 mean, standard deviation value of 8.603144. DER variables obtained minimum value of 0.074 and a maximum value of 23.950. As for the mean of 1.44285, a standard deviation value of 2.206187. Stock returns obtained minimum value of -0.875 and a maximum value of 2,630. As for the mean obtained at 0.17631, a standard deviation value of 0.548832,
4.2 Classical Assumption Test
4.2.1 Normality Test
Testing for normality in this study can be conducted via the approach charts. After testing the results are as follows:
Normality test :
Normality Test Results Source: Data processed, 2017
Based on the value of normality test results in Figure 4.1 above it can be concluded that the data spread around the diagonal line and follow the direction of the diagonal line, the regression model to meet the assumption of normality. ,
4.2.2 Test Multicolinearity
Multicolinierity test aims to test whether the regression model found a high correlation between independent variables or perfect.
Table 2 Test Results Multicolinearity
Independent variable
tolerance VI F
Information
ROA 0,276 3,623 No
multikolinearitas
ROE 0,282 3.543 No
multikolinearitas
DER .853 1,172 No
multikolinearitas
Source: Data processed, 2017
Tolerance value for 0276 ROA, ROE for 0282, the variable DER of 0853. As for the value of 3,623 VIF ROA, ROE for 3543, the variable DER of 1172. Tolerance value for all variables> 0:10 and VIF all variables <10, it can be concluded that the results of this test indicate the analyzed data satisfy the
assumptions of classical
multikolinearitas.
4.2.3 Test of autocorrelation
Autocorrelation test is intended to determine whether in a multiple linear regression model was no correlation between bullies error in period t with an error in period t-1 (previous).
Table 3 Result Autocorrelation Test
Durbin-Watson dL Du 4-Dl 4-Du Conclusion
2,142 1,690 1,749 2,310 2,251
Non autocorrelati
on
Source: Data processed, 2017
and 2251 (4 - dU), in order not to run into a problem of autocorrelation. The analysis showed DW value for the variable is the stock return has been among 1,749 2,142 (dU) and 2251 (4 - dU), so that we can conclude the regression model is free from problems of autocorrelation and fit for use.
4.3 Regression Analysis
Regression analysis used in this research is multiple linear regression. Multiple regression analysis was conducted to test the effect of two or more independent variables to the dependent variable (Ghozali, 2016),
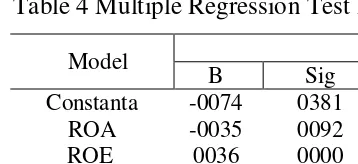
Table 4 Multiple Regression Test Results
Model
B Sig
Constanta -0074 0381
ROA -0035 0092
ROE 0036 0000
DER 0002 0921
Source: Data processed, 2017
a. Constant value of -0074 (negative), meaning that if ROA, ROE, and DER in the model assumed to be equal to 0 or constant, stock returns will be reduced by -0074
b. ROA regression coefficient value of -0035 (negative). This means that every increase of 1 unit of ROA will lower stock returns by -0035.
c. ROE regression coefficient of 0.036 (positive). This means that every increase of 1 unit ROE will increase stock returns for 0036.
d. DER variable regression coefficient of 0.002 (positive). This means that every increase of 1 unit of the DER will increase stock returns for 0002.
4.4 Hypothesis Testing
4.4.1 Test t
The t-test was conducted to measure how far the influence of the independent variables individually in
explaining the dependent variable (Ghozali, 2016)
Table 5 T Test Results
Model t T
Table Sig. Std Conclusion H1 -1.698 1,978 0.09
2 0:05 Rejected H2 3,757 1,978 000
0 0:05 Be accepted H3 0,100 1,978 .921 0:05 Rejected
Source: Data processed, 2017
Based on the above test, can concluded as follows:
a. The value of t <t table (-1698 <1,978) and the significance of> 0.05 (0.092> 0.05), meaning that H0 is rejected while H1 is rejected, so that it can be concluded that the ROA has no effect on stock returns.
b. The value of t count> t table 3,757> 1,978) and the significance of> 0.05 (0.000 <0.05), meaning that H0 rejected while H2 is received, so that it can be concluded that the ROE effect on stock returns.
c. The value of t <t table (0.100 <1,978) and the significance of> 0.05 (0921> 0.05), meaning that H0 is accepted while H3 is rejected, so that it can be concluded that the DER has no effect on stock returns.
4.4.2 Test F
Test Goodness of Fit is one form of testing the feasibility of a model that aims to describe the interactions between the variables studied (Ghozali, 2016).
Table 6 F Test Results
Description Fhit F
Table Sighit Sig. Result test F 76
83 2,67 0,000 0.05
Eligible models
The results show that F count> F table (7683> 2.67) and the significance <0.05 (0.000 <0.05), so it can be concluded that the H0 is rejected, while Ha accepted, meaning ROA, ROE, and DER effect on stock returns.
4.4.3 Coefficient of Determination
The coefficient of determination used to determine the effect of independent variables on the dependent variable. The coefficient of determination is essentially measuring how far the model's ability to explain variations in the dependent variable.
Table 7 Coefficient Determination Test Results
Model R R Square
Adjusted R Square
Conclusion
1 0386 0149 0129 The independent variables can explain the
dependent variable of 12.9%
Source: Data processed, 2017
Adjusted R Square value is 0129, or by 12.9%. This means that 12.9% of the stock returns, can be explained by the independent variables ROA, ROE, and DER The remaining 87.1% (100% - 12.9%) is explained by variables other than the explanatory variables or independent variables outside the model researchers this.
5. DISCUSSION
5.1 Effect of ROA on stock returns
Based on the testing that was done, the results of this study indicate that ROA has no effect on stock returns. It is
seen from the value of t <t table (-1698 <1,978) and a significant value> 0.05 (0.092 <0.05), meaning that H0 is rejected while H1 is rejected. Thus the first hypothesis of this study was rejected. This is because the return on assets is the company's ability to generate net profit of the company through the total assets owned by the company. The management company can not use the total assets owned by the company in generating net income so it will not affect stock returns.
The results are consistent with research conducted by (Purnamasari, 2015) which states that the return on assets (ROA) was not effect on stock returns that are not supported by any empirical evidence. However, contrary to the results of this research study conducted byAnwar (2016) which states that the return on assets (ROA) affects stock returns.
5.2 ROE influence on stock returns
Based on the testing that was done, the results of this study indicate that the ROE effect on stock returns. It is seen from the value t count> t table (3,757> 1,978) and the significant value of <0.05 (0.000 <0.05), meaning that H0 rejected while H2 is accepted. Thus the second hypothesis of this study is accepted.
The results of this study indicate that the high or low return on equity will affect stock returns. This is because the return on equity is a company's ability to generate net profit of the company through capital owned by the company. The management company may use capital effectively in net income that would affect rising stock returns.
The results are consistent with research conducted by (Alkaditiya, 2017) which states that the return on equity (ROE) terhdap affect stock returns
Listianingrum et al (2016) which states that the return on equity (ROE) has no effect on stock returns.
5.3 DER influence on stock returns
Based on the testing that was done, the results of this study indicate that the DER has no effect on return stock, It is seen from the value of t <t table (0,100 <1,978) and a significant value> 0.05 (0931> 0.05), meaning that H0 is accepted while H3 is rejected. Thus the third hypothesis of this study was rejected.
The results of this study indicate that the higher as well as lower debt to equity ratio will not affect stock returns. This is because the debt to equity ratio is a company's ability to meet all of its obligations with equity held by the company. Companies tend to use debt to finance all the activities of the company so that the profits to be generated decreases, it is this which will affect the company's declining stock returns and make investors unwilling to invest their shares.
The results are consistent with research conducted by (Verawaty, Jaya, & Mandala, 2015)And Listianingrum et al (2016) which states that the debt to equity ratio (DER) has no effect on stock returns. However, this result is contrary to the research conducted Sudarsono et al (2016) which states that the debt to equity ratio (DER) terhdap affect stock returns,
6. CONCLUSIONS AND RECOMMENDATIONS
This study aims to determine the effect of influences Return on Assets, Return on Equity, Debt to Equity Ratio on stock returns. This study uses independent variables ROA, ROE, and DER. While the dependent variable is the stock return .. The analytical tool used to
test the effect of independent variables on the dependent variable is a multiple regression analysis. This study population using property and real estate company listed on the Indonesia Stock Exchange (BEI) in the period 2012-2016. Sampling was taken with purposive sampling method as many as 20 property and real estate company listed on the Indonesia Stock Exchange (BEI) in the period 2012-2016.
The test results simultaneously with the F test can be concluded that the ROA, ROE, and DER together influential and significant impact on stock returns,
Based on the analysis and discussion can be concluded that the ROA and ROE have a significant effect on stock returns. while the DER has no effect on stock returns.
Suggestions for perfection further research as follows: 1) For researchers who want to do further research should use a sample of companies that are larger than this study, such as the use of company property and real estate and corporate non-property and real estate listed on the Stock Exchange in order to be in generalize. 2) For researchers with topics similar to reviewing further by including other independent variables, such as inflation, interest rate, exchange rate and external factors and can be analyzed by fundamental factors other coming from the internal environment in addition to ROA , ROE and DER, such as current ratio, TATO and PBV.
7. REFERENCES
Alkaditiya, NR (2017). influence ratioProfitability, Activity Ratio, Market Ratio, Firm Size and BI Rate Of Return (A Case Study of Cigarette Industry Listed On BEI Period 2011-2015). EXECUTIVE Journal, Volume 14, No.1.
Arikunto, S. (2006). Procedure Research: APractice Approach (VI). Jakarta: PT. Asdi Mahasatya.
Arista, D. (2012). Analysis of FactorsReturn Affect Stocks (Case In Manufacturing Companies Go Public In The BEI Period 2005-2009). Journal of Applied Management Sciences and Accounting, Vol 3, No 1.
Ghozali, I. (2016). application AnalysisMultivariate with IBM SPSS 23. Program Semarang: Diponegoro University.
Finance, OJ (2017, November 8). Regulator Capital Markets Launches Green Bond ASEAN Standards for Sustainable Investment Runway. Taken back from the Financial Services Authority.
Listianingrum, Wijayanti, A., & Nurlaela, S. (2016). Effect of Financial Ratios Against Retrun Shares Property and Real Estate Company Listed in Indonesia Stock Exchange. Journal of the Faculty of Economics UNIBA Surakarta.
Marfuah, SA, & Nurlaela, S. (2017). InfluenceCompany Size, Asset Growth, Profitability and Sales Growth Of Capital Structure And Cosmetics Company Household in Indonesian Stock Exchange.
Purnamasari, D. (2015). The Effect of Changes in Return on Assets, Return on Equity, and Economic Value Added to the Stock Price Changes and Its Impact on Earnings Per
Share. Research Journal of Finance and Accounting, 6 (6), 80-90.
Rahadia, MA, Nurlaela, S., & Titisari, KH (2013). Effect of Liquidity, Profitability, Solvency and Company
Size Share Price on
PerusahaanManufaktur Listed in Indonesia Stock Exchange. Paradigm Journal, Volume 11.
Sailendra, and Suratno. (2014). Fundamental Factors, Conditions
Macroeconomic and Stock
ReturnMining companies in
Indonesia Stock Exchange. Journal of Research in Accounting and Taxation, Vol.1, No.1.
Sari, Subroto, & Nurlaela, S. (2016).
Effect of Good Corporate
Governance on Corporate Financial Performance Real Estate & Property. National Seminar, 323-332.
Sudarsono, Bambang, & Sudiyatno, B. (2016). FactorsReturn Affect Shares Property and Real Estate Companies Listed In Indonesia Stock Exchange in 2009 s / d 2014 Journal of Business and Economics, Vol.23, No.1.
Sugiyono. (2015). MethodQuantitative Research, Qualitative and R & D (22 ed). Bandung: Alfabeta.