THE EFFECT OF ASSEMBLY
DESIGN PARAMETERS ON
ASSEMBLY TIME
ARTICLE · JULY 2015
DOWNLOADS
5
VIEWS
2
5 AUTHORS, INCLUDING:
Effendi Mohamad
Technical University of Malaysi… 56PUBLICATIONS 32CITATIONS
SEE PROFILE
THE EFFECT OF ASSEMBLY DESIGN PARAMETERS ON ASSEMBLY TIME
A. Saptari1, P. S. Sabuk2, I. Halim3,
E. Mohamad4 and M.R. Salleh5
1,2,3,4,5Faculty of Manufacturing Engineering,
Universiti Teknikal Malaysia Melaka, Hang Tuah Jaya, 76100 Durian Tunggal, Melaka, Malaysia.
Email: *1[email protected]; 2precilla.edu.my; 4[email protected]; 3[email protected]; 5[email protected]
ABSTRACT
:
Reducing cycle time has an impact in many aspects such as productivity and capacity of industry. This study investigate the effect of assembly design parameters such as workstation design, working posture: standing and sitting and jig design on plug assembly time. The parameters or factors involved were three jig designs; number of holders, working postures: standing and sitting to assembly time and gender. An experiment with a full factorial design with four factors of 2 and 3 levels was applied. Ten participants consisting of five males and fives females were asked to assemble the plugs. The study concluded that all main factors, and some interaction factors significantly contributed to assembly time. The lowest assembly time per plug for assembly setting was sitting posture by male operators , using rectangular jig with 3 holders per jig. Meanwhile the highest assembly time per plug was performed by the female operator using horizontal jig with 5 plugs holder per jig. The study also generates the regression model that describes the relationship of all factors involved. Validation of the model also was performed by taking some runs of experiments. The average deviation of actual data and predicted is less than five per cent.KEYWORDS:Cycle time, working posture, gender, design of jig, number of
holders.
1.0 INTRODUCTION
Workstation design in this study refers to design of work place that can improve the fits between human and machine environment that may increase productivity, safety, and reduce human error. A study by Saptari et al. [1] on assembly design showed that jig provides significant contribution to assembly time. The jig developed in the research has four numbers of holders with horizontal shape. Furthermore, a study has improved the design of assembly by studying the effect of number of workers, different design of jigs and different position of working to assembly time or cycle time. It concluded that these factors had an effect on assembly time [2].
The working posture i.e. standing or sitting can influence the operator work’s performance. Prolonged standing leads to muscular fatigue in lower extremities, such as lower back, posterior leg and anterior leg due to static contraction [3]. In the long run, these discomforts and muscular fatigue can lead occupational disorders and adversely impact the workers’ health and efficiency at work. A seated workplace should be used for long duration tasks whenever it is possible, as it is easier to maintain a seated posture and the strain imposed on the body is much less compared to standing posture.
This research focus on the investigation on how assembly design variables such as: workstation design, working posture, jig design and gender effect on assembly time.
2.0 METHODOLOGY
2.1 Design of Assembly
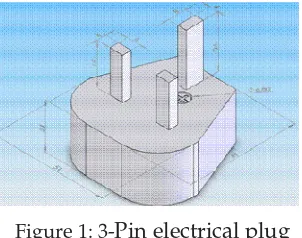
The product used in this research is BS1363 3-pin electrical plug. Figure 1 shows a typical 3-pin electric plug.
Figure 1: 3-Pin electrical plug
to comprehend assembly processes of product.
Based on the product design and components, the assembly processes sequences were determined. The sequence is as follows: put plug base cover on the jig, insert the child components (neutral pin, earth pin, live pin, fuse holder and fuse) into the base cover. Then, assemble the top and base cover together by using screw. To tighten, the jig is flipped and tightened with the screw driver powered by air pressure.
2.2 Design of Workstation
Workstation design of an assembly line may contribute to performance of workers when operator performed his/her job on position either standing or sitting.
The assembly of plugs is considered as a light works. According to Grandjean [4] work surface height for standing position, the light work required a height of 90 cm [4]. For the sitting posture, the chair was adjusted according to the table height which is 90 cm. The height of chair is dependent upon workers height, the tasks they perform, and the equipment and tools use. The elbow height for sitting was the same height as table so as the worker can lean their elbow on the table.
Worker should able to maintain a forearm to upper arm angle in between 70 degree to 135 degree. The chair is design with a footrest. Therefore, the workers can rest their foot comfortably during the prolonged period of assembly activity and also can avoid fatigue.
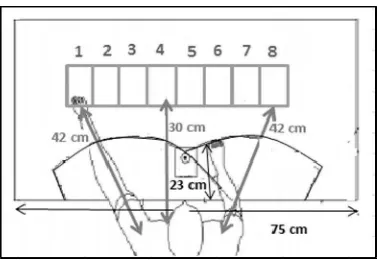
The working area of operator follows normal and maximum working area as suggested by Sanders et al. [5]. For this experiment, normal working area is around 23 cm. The maximum reach for the operator in this experiment was 42 cm, whereas the length of working area is around 75 cm. Furthermore area of visual is using visual comfort zone and reach envelope that is around 53.3 cm in radius.
The bins were laid out based on work sequences where the first part on the left side. Figure 2 shows the picture and the schematic layout of the actual reach area in assembly workstation during plug assembly. Number one to eight represent the bin of plug components. The reachable movement for right and left hand is 42cm from body to the respective bin. Whereas the middle bin from body is 30cm.
2.3 Design of Jig
The purpose of a jig was to hold the plug’s pin and cover in the proper position. Total of jig designed for this research is 9 jigs. The purpose to have 9 different of jig is to select the best jig design for plug assembly process. The jig is supported by rubber cube at each bottom corner, so that it is more stable during plug assembly process.
The shape of the jig used in this experiment is rectangular, horizontal and vertical jigs. This is considering the different location and orientation of the plug holders. Rectangular shape enables the plugs holder to be located centred in one area so the radius of the plugs holder will be equal. While for horizontal and vertical jigs, the orientation for the plug assembly is differed horizontally and vertically. The longest length of the jig design is 34.4 cm is still under the maximum of normal working area. Figure 3 shows an example of rectangular jig with 4 holders.
Figure 3: Example of Rectangular Jig with 4 holders
2.4 Operators
Additional three participants were hired to validated the regression model. So in total there were 13 participants.
2.5 Design of Experiment (DOE)
The dependent variable in this case was Assembly Time. This assembly time was expected to be a function of several independent variables i.e. working posture, Jig design: Shape of jig and Quantity holder, and Gender.
The experiment designed to use a full factorial design that consists of 4 numbers of factors. Each factor has certain level. Gender has two level; Male and Female, Working posture has two: Standing and Sitting; Shape has three level; Rectangular, Vertical and Horizontal and Quantity Holder has three: #-holder, 4 holder and 5-holder.
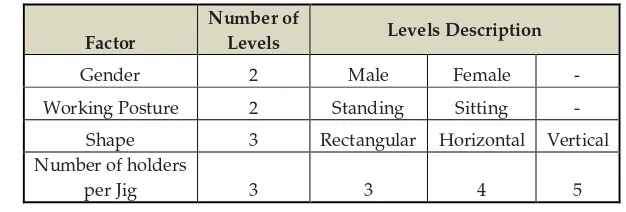
With this arrangement a full factorial design would need 2x2x3x3 or equivalent to 36 combination of different set of experiments. See below Table 1 shows the factors and levels of experiment design. There were total eighteen (18) different setting of assembly design for each gender of experiment and thirty six (36) different setting for both male and female. Therefore in order to balance the quantity of each design setting, 10 replications were set. Thus, there were 180 of observations per operator or 3600 observations in total.
Table 1: Factors and level of Design Experiment
Factor
Number of
Levels Levels Description
Gender 2 Male Female -
Working Posture 2 Standing Sitting -
Shape 3 Rectangular Horizontal Vertical
Number of holders
per Jig 3 3 4 5
3.0 RESULTS
3.1 Parameters Screening
working posture and gender and all interactions among the factors. All the P value for the main factors is 0, which is less than 0.05 of confident level. This shows that all factors significantly contributed to assembly time. However, some interactions among the variables were insignificant as it shown by the P value larger than 0.05. These include such as interaction between Gender and Working Posture, Gender and Shape and some other three factors interaction are insignificant.
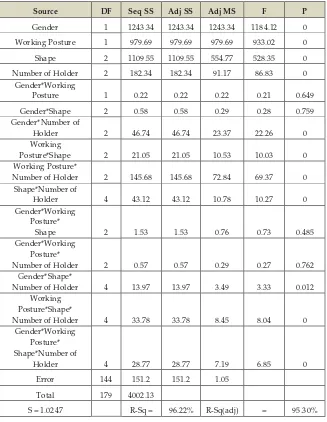
Table 2: Analysis of Variance for Mean Assembly Time
Source DF Seq SS Adj SS Adj MS F P
insignificant factors. The results after the screening are seen in Table 3.
Table 3:Analysis of Variance for Mean Assembly Time using Adjusted SS for Test
Source DF Seq SS Adj SS Adj MS F P
Gender 1 1243.34 1243.34 1243.34 1113.46 0
Shape 2 1109.55 1109.55 554.77 496.82 0
Number of Holder 2 319.62 319.62 159.81 143.12 0
Working Posture 1 979.69 979.69 979.69 877.35 0
Gender* Number of
Holder 2 66.04 66.04 33.02 29.57 0
shape* Number of
Holder 4 18.36 18.36 4.59 4.11 0.003
Shape* Working
Posture 2 21.05 21.05 10.53 9.43 0
Number of Holder *
Working Posture 2 25.99 25.99 13 11.64 0
Shape*Number of Holder
* Working Posture 4 40.93 40.93 10.23 9.16 0
Error 159 177.55 177.55 1.12
Total 179 4002.13
S = 1.05671 R-Sq = 95.56% R-Sq(adj) = 95.01%
The four most significant factor are gender with the highest F test value which is 1113.46 obtained. Followed by Working posture (877.35), Shape (496.82), and lastly Number of holder (143.12). This mean the greatest contribution to the difference in reading assembly time per plug is Gender difference of operator. Next is Working posture, position of worker standing and sitting contribute to the second highest influence in producing assembly time reading, then is Shape of jig either Rectangle, Horizontal or Vertical. Number of holder of plug per jig is the smallest effect to the assembly time.
3.2 Main Effects Plot for Assembly Time
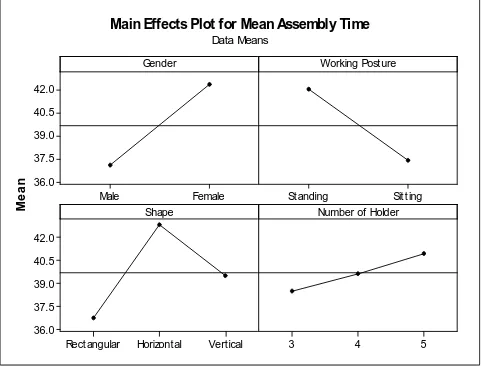
The purpose of main effects plot for assembly time is to map the independent variables at different level. The graphs in Figure 4 shows the individual effect for the assembly time.
The assembly time for working posture decreased from standing to sitting. Sitting provides lowest mean assembly time with 37.37 seconds compared to standing with 42.03 seconds.
The shape of the jigs is decrease from horizontal to vertical and lastly rectangular. Horizontal jig carried out the longest assembly time with mean 42.82 seconds per plug compared to vertical and rectangular with mean 39.53 seconds and 36.75 seconds respectively.
Female
Main Effects Plot for Mean Assembly Time Data Means
Figure 4 : Main Effect Plots for plugs assembly time
The number of plug holders from the main effect plot graph shows that the slope decrease from 5 numbers of holders to 4 numbers of holders and lastly the 3 numbers of holders. The 3 number of plugs holders per jigs shows the lowest assembly times 37.97 seconds per plug, followed by 4 numbers of plugs 39.91 seconds and lastly the 5 numbers of plugs 41.22 seconds.
According to Pheasant [6], the limit of the workspace envelope for a standing operator can be seen as the space in which an object can be reached and gripped comfortably, when operator are standing up straight. Therefore, arms and hands are most powerful when the elbows are close to user sides and bent at right angles or more, that is, extended slightly.
Meanwhile, standing for a prolonged period imposes excessive load on the body and cause accumulation of body fluid in the legs, which subsequently lead to discomforts [7]. This will impact to the worker’s healthy, and also affect the worker’s productivity.
Sitting position is usually preferred over standing position in light assembly with repetitive movement, and fine manipulation and precision tasks [8]. This is because sitting position can help to relieve local body fatigue due to repetitive movements. In addition, Helander [8] observed that sitting position allows does not only an individual to have better focus and attention compared to standing position, it also provides support on the underarms. Hence, task precision is usually better in sitting position compared to standing position as one has better stability in sitting position than standing position; standing position may cause adverse effects on one’s performance in precision tasks due to instability.
Additionally, sitting is also more stable and less energy-consuming posture than standing, but it restricts the working space, particularly of the feet, more than standing [9]. However, sitting is much easier to operate foot controls when sitting, as compared to standing, because little body weight is transferred by the feet to the ground.
3.3 Interaction Plot for Assembly Time
An interaction plot in between two factors is shown in Figure 4. The low level value in the graph is referring to the straight line and high level value the dotted line (refer graph legends).
interaction occurred between the variables. This is also confirmed by the Anova Mean as shown in Table 2 indicated by the p value larger than 5%.
I nteraction Plot for Mean Assembly Time
Data Means
Figure 5 : Interaction Plot for Assembly Time
Figure 4 shows gender and number of holder (on the top right), working posture and number of holder (middle right) and shape and number of holder (bottom) are not parallel. These mean the variables interacts and contribute to the variance of the assembly time.
3.4 Regression Model
The regression model was developed. The model represent the predicted mean assembly time:
39.6997 -2.628 X1 – 2.951X3 + 3.123 X4 – 1.726 X6 + 0.209 X7 + 2.333 X9 -0.826 X3 X6 +0.208 X3 X7 +0.538 X4 X6 -0.553 X4 X7) +0.4027 X3 X9 +0.0307 X4X9 -0.5193 X6 X9 +0.3796 X7 X9 -0.5588 X3 X6 X9 + 0.2731X3 X7 X9 -0.0901 X4 X6 X9 +0.5314 X4 X7 X9.
Note: X1,Male; X2, Female; X3, Rectangle, X4 Horizontal, X5, Vertical; X6, 3-holder, X7, 4-holder, X8, 5-holder; X9, Sitting, X10, Standing.
3.5 Validation of Regression Model
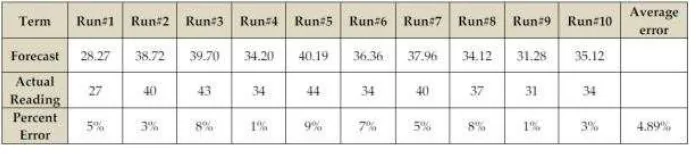
To validate the model, 3 participants were asked to runs on the experiment setting in radom order. The operators consist of 2 males and 1 female operator. Table 4. shows ten run of experiments with different parameter setting. There were 6 data from males and 4 data’s from females to be used for validation.. These runs of experiments will be compared with the results of Regression Model and the percentage different with the actual data is estimated.
Table 4 shows the forecast value of assembly time of ten runs and also the actual data based on the experiments. The bottom of the table showed the percentage error i.e. different from forecast and actual data also the average of error in ten runs. The average error is around 4.89% which is below than 5%. This is comparable with Table 3 where the Rsq (adj), value of R square adjusted is 95%, which means the model can explain any variations of the data to 95%. Based on this result the Regression model can be claimed as representing the sample population of 18 different setting of plug assembly design.
Table 4: Validation of Model
3.6. Mean Assembly Time
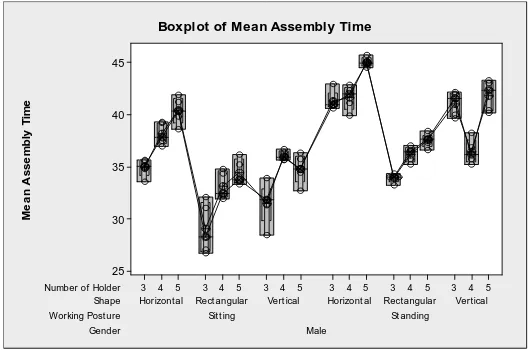
Figure 6 shows a Box plot for mean assembly time of 3-pin plug with factors: Gender: male operator, shape of plug, number of holder, and working posture.
It shows that for male operator reached the lowest mean
26.70 seconds
Figure 6: Box Plot of Mean Assembly time
4.0 CONCLUSIONS
All the single factors, gender, working posture, shape and number of holder have significant contribution to assembly time with significance level less than 0.05. The most significant factors that contribute to assembly time are gender followed by Working posture, Shape and lastly Number of holder.
Working in sitting position is much faster than standing, this is due to sitting can absorb the vibration generated during the assembly activities.
The results show that some interactions significantly effect assembly time. Two factors interaction and some three factors interaction have significant identified contribute to the assembly time.
Among the setting of assembly line design, the most productive assembly design is the rectangular with 3 holders per jig, with sitting working posture by male operator. The lowest mean time for the plug assembly was 26.70 seconds per plug. While the highest mean assembly time was 50.20 seconds for horizontal jig, 5 holders per jig, standing posture by female operator.
The study has also generate the regression model to explain the relationship of all main factors. The model generated has also been validated by another 3 participants of experiments.
ACKNOWLEDGMENTS
The authors extend our sincere thanks to the Universiti Teknikal Malaysia Melaka for continuous support of this research.
REFERENCES
[1] A. Saptari, H. Isa, S. R. Kamat, and H. Wan, “Assessment of Workstation Design for Safe Working Posture at Plug Assembly Line”, in Proc. Int Conf. Engineering and ICT, Melaka, Malaysia, 2007, pp. 183 – 190.
[2] A. Saptari, W. S. Lai and M. R. Salleh, “Jig design, assembly line design and work station design and their effect to productivity”, Jordan J. Mech. Ind. Eng., pp. 9-16, 2011.
[3] I. Halim, A. R. Omar, A. M. Saman, and I. Othman, “Assessment of muscle fatigue associated with prolonged standing in the workplace”, Saf. Health Work, pp. 31–42, 2012.
[4] Grandjean, E., 1988. Fitting the task to the man: An ergonomic approach, Taylor and Francis, London.
[5] Sanders, M.S., and McCormick, E.J., 1993. Human Factors in Engineering and Design, 6th edition, McGraw Hill, New York.
[6] Pheasant, S., 1998. Bodyspace: Anthropometry, Ergonomics and the Design of Work. Second Edition., Taylor and Francis, London.
[7] K. A. Latorella and P. V. Prabhu, “A review of human error in aviation maintenance and inspection”, Int. J. Ind. Ergonom., vol. 26 (2), pp. 133-161, 2000.
[8] Helander, M., 2006. A guide to human factors and ergonomics. Taylor and Francis.
[9] O. Kroemer, J. Piater, S. Jodogne, R. Detry, D. Kraft, N. Krüger, and J. Peters, “Learning visual representations for perception-action systems”, Int. J. Robotics Research, 30(3), pp. 294-307, 2011.
[10] Sawaqed, N. M. and Shikdar, A. A., 2003. Worker productivity and occupational health and safety issues in selected industries. Computers &