419
PAPER ID
–
J.10
MULTICRITERIA ANALYSIS AND REMOTE SENSING FOR FLOOD HAZARD DELINEATION
IN PADDY FIELD LAND UTILIZATION
(A CASE STUDY OF LOWER CITARUM WATERSHED, WEST JAVA)
Widiatmaka
1, Wiwin Ambarwulan
2, Paulus B.K. Santosa
3,4, Chandrasa E. Sjamsudin
3 1Dept. of Soil Science and Land Resource, Bogor Agricultural University, Indonesia
2
Geospatial Information Agency, Indonesia
3
Study Program of Environmental Management, Bogor Agricultural University, Indonesia
4
Ministry of Agriculture, Indonesia
Abstract
Indonesia is among one of the highest rank country where natural disasters very frequently occur. Such natural calamities may be in the form of geological- as well as hydro meteorological disasters. Flood is one of the most recurrent hydro meteorological disasters induced by wet tropical climate and other factors of natural resources. The island of Java is currently still the pillar for national food sovereignty. Flood disasters that inundate paddy fields are often the cause of crop failures. This research was conducted at the lower watershed of Citarum, West Java. The research areas covered 3 (three) administrative regions, namely Karawang- (its western part), Purwakarta- (the northern part) and Bekasi regency (at the eastern and northern parts of the regency). These regions are among the numerous food production centres in Java, boasting a fairly wide area of paddy fields. The research objective is to delineate flood hazard in lower Citarum watershed, West Java, Indonesia. The methodology used is a combination of multi-criteria analysis and remote sensing. Parameters that influence flood hazard were weighed using analytical hierarchy process, these include rainfall, elevation, slope, soil type, substrate, landform and land cover. Delineation of the area according to the different levels of flood hazard was done through weighed spatial overlay in the geographic i for atio s ste ’s odels. The e isti g la d utilizatio for padd field was obtai ed fro a IKONOS i ager interpretation in 2012. Spatial overlay was done on paddy fields exposed to different levels of flood hazard. The result of the analysis showed that there is a region with different levels of flood hazard, which can be spatially delineated. Validation was performed using archival chronology of flood events. This research is important within the context of maintaining national food sovereignty. National food supply is still dependent on paddy production centres in Java, however failure to harvest the rice paddies often occur. The recommendations of this study based on the results are to include the use of flood-resistant paddy seed varieties as well as other management required in high flood-hazard areas.
Key words: disaster mitigation; food sovereignty; IKONOS imagery; multi-criteria land evaluation; spatial overlay
INTRODUCTION
Indonesia is among one of the highest rank country where natural disasters very frequently occur. Natural disasters can be broadly classified into geological disasters such as earthquakes, volcanic eruptions and tsunamis; and hydro-meteorological disasters such as floods, droughts and landslides. In terms of geological disasters, the nature of the country as a meeting place of three tectonic plates, the Eurasian, Indo-Australian and the Pacific plates, has caused considerably frequent disaster incidences. The meeting point of these 3 plates creates a volcanic arc that stretches from Sumatra to Papua, which is characterized by a volcanic mountain range that is distributed along the plate meeting zone (Katili, 1974; Verstappen, 2010).
The climate in Indonesia is wet tropical climate with high rainfall since Indonesian archipelago is located between the Asian and Australian continents. This makes the country vulnerable to hydro meteorological disasters. Based on the data from the National Disaster Management Agency (BNPB), there were 6,528 natural disasters, in which 250,000 people were killed, within the period 1915-2010 (BNPB, 2015). Hydro meteorological disasters are dominant in the country, with 80% of occurrences.
420
destructive use of natural resources, offsetting the balance of natural equilibrium. According to (Barredo, 2009; Ghizoni et al., 2010)
One way to delineate the flood hazard in an area is using the multi-criteria analysis (MCA). MCA has been widely used in natural resource study, one of the reasons is because most of the data resources are associated with each other geographically (Malczewski, 1999; Yahaya, 2008). With spatial geo-referenced data, the analysis of geographic information systems can contribute to decision making through an overlay process method has been widely used in determining the use of resources, for example to model habitat suitability (Store & Kangas, 2001; Widiatmaka et al., 2015), determine waste disposal site (Effat and Hegazy, 2012), delineate agricultural land suitability (Bandyopadhyay, 2009; Mendas & Delali, 2012; Akinci et al., 2013), determine suitability area for industry (Rikalovic et al., 2014) and urban aquaculture development (Hossain et al., 2009) and many other cases involving the need of decision-making. In case of natural disasters, several studies use this method, either to delineate flood hazard (Brivio et al., 2002; Rohde et al., 2006; Kourgialas & Karatzas, 2011; Abdalla et al., 2014), or determine the area susceptible to land slide (Rawat & Joshi, 2012) and earthquake (Parvaiz et al., 2012).
The objective of this study are: (i) determining the weight of the parameters influencing flood hazard, (ii) delineating the area at different levels of flood hazards, (iii) setting the existing extent of paddy field, and (iv) demarcating paddy fields that are exposed to flood hazards in lower Citarum watershed, West Java, Indonesia. The Citarum watershed is one of the watershed on the island of Java, which is
listed as a priority watersheds because of its high vital land utilization for human being as well as its high vulnerability. Paddy fields can be found in abundance in this watershed environment, making the region one of the food production centres in Java.
METHODOLOGY
Research Area
The research was conducted at the lower Citarum sub-watershed, West Java Province, Indonesia (Figure 1). This sub-watershed is part of Citarum watershed which is one of most important watershed in West Java Province. Geographically, the research area lies between 106o5 '5 ”E-107o27'23"E and 5o 54'34"-6o33'52"S. This sub-watershed is part of 3 (three) administrative regencies, namely Karawang (the western part), Purwakarta (the northern part) and Bekasi (eastern and northern parts).
Figure 1. Research Area of Lower Citarum Watershed
421 close to the state capital, Jakarta, so that changes
in land use, e.g. from agricultural land to non-agricultural use, are quite dynamic. This region has a wet tropical climate, with an annual rainfall that vary from 1,000 to 3,400 mm.year-1.
Multicriteria Analysis for Flood Hazard
Delineation
Basically, there are four (4) main steps to produce flood hazard maps using the multi criteria analysis technique. These steps were conducted in this study: (1) defining the parameters that determine flood hazard and preparation of data sets of parameters (2) determining the weight of these parameters, (3) delineating and mapping of flood hazard, and (3) determining the level of flood hazard in various land utilization, with an emphasize on paddy field land use.
Parameters Determining Flood Hazard and Data Sets
Determinant parameters used for the analysis of flood hazard are identified at the early step through interviews with experts. A total of five experts were interviewed about flooding and its causes. Interview results are summarized in was obtained from the Meteorology, Climatology and Geophysics Agency (BMKG, 2014). The rainfall data was obtained in spatial form, which resulted based on treated data from 42 points of BMKG station in Lower Citarum sub-watershed.
Elevation. There is a higher possibility of flooding at low-elevation areas compared to areas located at high elevation. Nonetheless, the area located at a higher elevation still may experience flooding, for example those that have flat slopes. The elevation parameter for this study was obtained from the elevation maps, created using contour data of the Topographic Map scale at 1:25,000 from Geospatial Information Agency,
Indonesia. Elevation map-creation was done by the module of 3-D Analyst in ArcGIS 10.2.
Slope. Water tends to accumulate in flat areas. Water will automatically flow down on areas with slopes; the possibility of any flooding is therefore smaller. Similar to the elevation parameter, slope parameters were created using contour data from topographic maps of the Geospatial Information Agency, Indonesia, through the use of Spatial Analyst module on ArcGIS 10.2.
Soil Type. Different types of soil have different rates of infiltration and water holding capacities. When the infiltration capacity has exceeded, overland flow results (Parawingira, 2008). Soil with rough texture has a higher infiltration capacity than the fine textured soils. Similarly, a good soil structure will further facilitate water absorption so that there will be a smaller possibility of flooding. Various soil names are generally characterized by different infiltration characteristics. The soil data was obtained from the Soil Map of 1:50,000 and 1:100,000 scale, which was a result of a soil mapping activity conducted jointly by the Research Centre for Soil and Agro-climate, Bogor, and Faculty of
Agriculture, Bogor Agricultural University (Faperta IPB, 1993; PPT, 1982; Puslitanak, 1993; Puslitanak, 1995). In this study however, the soil classification used was only at the Order category (PPT, 1983).
422 TM-8 imagery of 2013. Image analysis was done
using a supervised classification of ERDAS imagine software. The land cover classification used the standard classification of SNI (SNI, 2010). Specifically for paddy field, the spatial data used is paddy field spatial data measured by the Ministry of Agriculture in 2012 using IKONOS imagery. The land use and land cover data in this research were used in the preparation of creating a flood parameter map as a first step, and then in the second step they were used to calculate different land use and land cover affected by flood hazard.
Landform. Some landforms are associated with flood events. Alluvial landforms will be more associated with the incidence of flooding compared to the hilly or mountainous landforms. In this research, landform was obtained from the Land System Map from Soil Research Institute, scale 1:250,000.
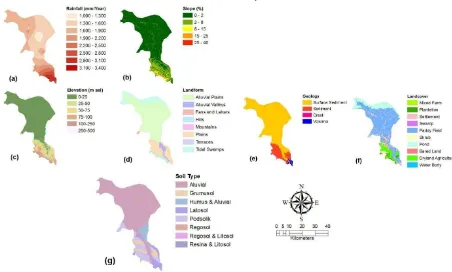
All data parameters obtained are drawn and presented on the digital base map of the Indonesian Topographic Map scale at 1:25,000 produced by Geospatial Information Agency, Indonesia. The research area was covered by 19 sheets, which were sheets No. 1209243, 1209244, 1209444, 1209512, 1209514, 1209521, 1209522, 1209523, 1209532, 1209533, 1209534, 1209541, 1209542, 1209543, 1209544, 1210122, 1210211, 1210212 and 1210221. All spatial data was geo-referenced and then drawn on the base map. According to Law No. 4/2011 on Geospatial Information, all spatial analysis conducted should be based on a single reference that refers to this base map. In the next process, all data is converted into a vector format to be treated using Geographic Information System. The distribution of each parameters as well as its area coverage are given in Figure 2 and Table 1. In this table, as according to the description in this paragraph, the results are presented in column 1, 3, 4 and 5.
Figure 2. Distribution of the main and sub-criteria in the study area of Lower Citarum Watershed
Table 1. Distributions of the main and sub-criteria parameters in the study area (column 1, 3, 4 and 5), weight and score (column 2 and 6)
Main Criteria Weight Sub-Criteria Area Score
Ha %
1 2 3 4 5 6
Rainfall 0.362 1,000 - 1,300 mm/year 6,218.3 4.4 1
1,300 - 1,600 mm/year 55,584.0 38.9 1 1,600 - 1,900 mm/year 56,908.6 39.8 3
1,900 - 2,200 mm/year 9,248.7 6.5 8
423 Main Criteria Weight Sub-Criteria Area Score
Ha %
1 2 3 4 5 6
2,500 - 2,800 mm/year 4,468.0 3.1 10
2,800 - 3,100 mm/year 4,819.3 3.4 10
3,100 - 3,400 mm/year 109.0 0.1 10
Slope 0.238 0 - 3 % 113,966.4 79.7 10
3 - 8 % 23,675.0 16.6 6
8 - 15 % 3,653.1 2.6 1
15 - 25 % 1,372.3 1.0 0
25 - 40 % 252.4 0.2 0
Elevation 0.156 0 - 25 m 113,722.1 79.6 10
25 - 50 m 10,176.5 7.1 8
50 - 75 m 8,594.4 6.0 4
75 - 100 m 6,083.0 4.3 3
100 - 250 m 4,220.0 3.0 2
250 - 500 m 123.2 0.1 1
Geology 0.103 Surface Sediment 122,546.7 85.8 6
Sediment 18,268.5 12.8 4
Crest 70.8 0.1 1
Volcano 2,033.1 1.4 0
Landform 0.068 Alluvial Plains 92,171.3 64.5 6
Alluvial Valleys 4,715.7 3.3 8
Fans and Lahars 770.9 0.5 2
Hills 3,423.8 2.4 0
Mountains 22,808.7 16.0 0
Plains 300.7 0.2 4
Terraces 18,676.4 13.1 1
Tidal Swamps 51.7 0.0 10
Landcover 0.044 Mixed Farm 127.4 0.1 4
Plantation 3,097.5 2.2 6
Settlement 15,562.8 10.9 1
Swamp 215.3 0.2 2
Rice Field 86,022.3 60.2 1
Shrub 2,604.3 1.8 1
Pond 22,690.8 15.9 1
Bared Land 785.7 0.6 0
Dryland agriculture 10,947.3 7.7 0
Water Body 865.9 0.6 0
Soil Type Aluvial 103,428.1 72.4 6
Grumusol 6,658.9 4.7 4
Humus & Aluvial 6,269.5 4.4 6
Latosol 8,083.1 5.7 1
Podsolik 16,587.0 11.6 2
Regosol 1,523.2 1.1 1
Resina & Litosol 369.4 0.3 1
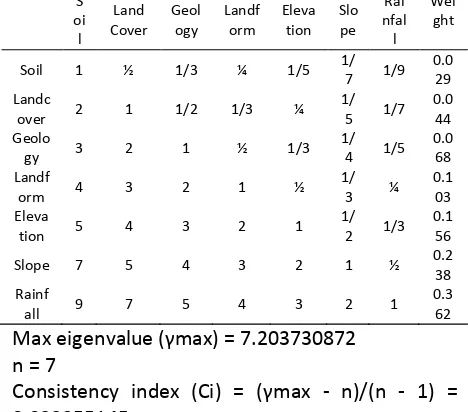
Determining Weights of Criteria using AHP Approach
In the main procedure used, flood determinants consist of main criteria, which are further divided into sub-criteria. The weights used in this study is the weight of the main criteria, while score was given to the sub-criteria. Both the weight of the main criteria as well as scores of sub-criteria were classified according to their contribution to flood as reviewed by the experts.
Scoring was based on literature review and
autho ’s judg e t, e.g. heav ai fall that auses
flooding was given a higher score than low
rainfall. Similarly, flood-prone landforms are given higher score than less-prone ones. This approach was used for all main-criteria: rainfall, soil, geology, land use and land cover, and landform. The scores for all sub-criteria are presented in Table 1, column 6.
424 Widiatmaka et al., 2014). The ratings consist of 9
interests scale, from 9 to 1/9. If the rating shows 9, it would indicate that the line has a relatively more important than the column. If the value is a ninth, this shows that the line is significantly less important than the column. If two variables are equally important, they are given a value of 1. In estimating the weights, a group of experts were asked to compare the matrix in pairs. In practical, the AHP analysis was performed using the software of Expert-Choice.
Delineating and Mapping Flood Hazard
The main-criteria weights and sub-criteria scores were appointed to the related layers in the ArcGIS 10.2 environment. Raster maps of 7 main criteria were overlaid using the weighted sum overlay analysis for generating map of flood hazard. The weight of the main criteria were multiplied with the score of the sub-criteria. This multiplication was performed in raster format on the map. The result was then reclassified using equal distances as four classes of suitability: highly suitable (S1), moderately suitable (S2), marginally suitable (S3) and not suitable (N) (Widiatmaka et al., 2014; 2015).
Determining flood hazard level at various
land utilizations with an emphasize on
paddy field
Land utilization used is land use and land cover resulted from Landsat satellite image interpretation as well as Ikonos imagery. Flood hazard mapping results as presented before,
were overlaid in GIS environment. The
calculation of flood hazard area is performed through tabulation. The discussion on paddy field would be prioritized, in accordance with the main theme of this paper.
RESULT AND DISCUSSION
Weighed Result. The results of pairwise comparison were given in Table 2 and was summarized in Table 1 (column 2). In the table, the results have a consistency ratio (CR) of 0.037. As recommended by Saaty (1988), a CR equal to or less than 0,10 was acceptable, and signifies a small probability that the weights were coincidentally developed (Widiatmaka et al., 2014; 2015).
The overall results showed that the most weighed criteria is rainfall. This result is highly
related to the fact that flooding is caused by precipitation. The next weights were respectively slope, elevation and landform, followed by
Table 2. The weight of each parameter forming flood
S
Consistency ratio (Cr) = Ci/Ri = 0.037727939
Flood Hazard Distribution. The results of flood hazard analysis are presented in Figure 3a and
425
(a) (b)
Figure 3. Flood Hazard in Karawang Regency: (a) Flood Hazard Classification; (b) Flood Hazard
Classification with Paddy Field Land cover
Tabel 3. Hazard in Lower Citarum
Nr Hazard Classification Value Area
Ha %
1 No Hazard 2.376 - 3.709 563.9 0.4 2 Low Hazard 3.709 - 5.042 11,361.2 8.0 3 Medium Hazard 5.042 - 6.374 103,034.9 72.1 4 High Hazard 6.374 - 7.707 24,161.4 16.9 5 Very High Hazard 7.707 - 9.040 3,797.8 2.7
Total 142,919.1 100.0
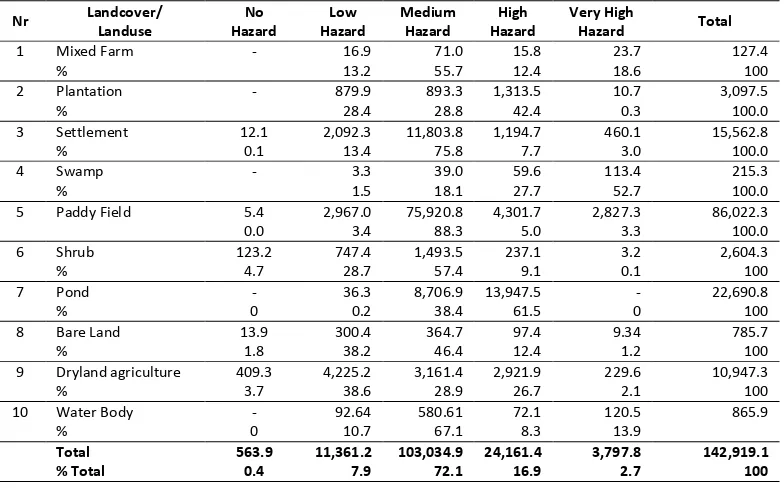
Flood Hazard in Variety of Land Use and Land Cover. The results of flood hazard maps which are overlaid with maps of land use and land cover are presented in Table 4. This table is a translation of the entire flood hazard as presented in the previous table (Table 3), where 89% of the area have medium- to high level hazard for flood. Table 4 shows that land use and land cover which have a lower than average level of flood hazard is broad enough. They are mixed farm, plantation, settlement, shrub, bare land, and dry land agriculture. They are land use for dry land. Several other land use and land cover are relatively prone to flooding. Land use and land cover with heavier than the average level of flood hazard are swamps, paddy fields and ponds. They are the wetlands land utilization, and lie with flat region.
Table 4. Flood Hazard in variety land uses of Karawang Regency
Nr Landcover/ Landuse
No Hazard
Low Hazard
Medium Hazard
High Hazard
Very High
Hazard Total
1 Mixed Farm - 16.9 71.0 15.8 23.7 127.4
% 13.2 55.7 12.4 18.6 100
2 Plantation - 879.9 893.3 1,313.5 10.7 3,097.5
% 28.4 28.8 42.4 0.3 100.0
3 Settlement 12.1 2,092.3 11,803.8 1,194.7 460.1 15,562.8
% 0.1 13.4 75.8 7.7 3.0 100.0
4 Swamp - 3.3 39.0 59.6 113.4 215.3
% 1.5 18.1 27.7 52.7 100.0
5 Paddy Field 5.4 2,967.0 75,920.8 4,301.7 2,827.3 86,022.3
0.0 3.4 88.3 5.0 3.3 100.0
6 Shrub 123.2 747.4 1,493.5 237.1 3.2 2,604.3
% 4.7 28.7 57.4 9.1 0.1 100
7 Pond - 36.3 8,706.9 13,947.5 - 22,690.8
% 0 0.2 38.4 61.5 0 100
8 Bare Land 13.9 300.4 364.7 97.4 9.34 785.7
% 1.8 38.2 46.4 12.4 1.2 100
9 Dryland agriculture 409.3 4,225.2 3,161.4 2,921.9 229.6 10,947.3
% 3.7 38.6 28.9 26.7 2.1 100
10 Water Body - 92.64 580.61 72.1 120.5 865.9
% 0 10.7 67.1 8.3 13.9
Total 563.9 11,361.2 103,034.9 24,161.4 3,797.8 142,919.1
426 Comparison of model result with flood
occurrence. A comparison was done between flood hazards that resulted from the model with actual flood events. The actual flood events used is the data of flood event recordings (Figure 4
and Table 5). The flood actual data include 28 points, in which most data derived from the internet and BNPB (2015). It should be noted that the original data present only the name of the village, while in this paper, we put each point spatially at the centre of the village. Such a comparison is therefore somewhat of an
approach. From those 28 points, 1 point occurs in the area of very high hazard, 1 point in high hazard while the 26 point were located in medium-level hazard area. The high number of points in the medium-level hazard area was caused by the large area it occupies, covering 72.1% of the study area. It also shows that even in the medium-level hazard areas, flood events occur a lot. There were no points found in the no hazard area.
Table 5. Existing flood occurrence
Village Sub-District Flood Level Occurrence Source
Baturaden Batujaya Medium Hazard February 2008 http://berita.i-y-i.com
Rengasdengklok Utara Rengasdengklok Medium Hazard February 2008 http://berita.i-y-i.com
Tegallega Ciampel Very High Hazard 18 - 21 March 2010 http://papuapost.wordpress.com Tanjungpura Karawang Barat Medium Hazard 18 - 21 March 2010 http://regional.kompas.com Tanjungmekar Karawang Barat Medium Hazard 18 - 21 March 2010 http://regional.kompas.com Karawangkulon Karawang Barat Medium Hazard 18 - 21 March 2010 http://regional.kompas.com Adiarsa Barat Karawang Barat Medium Hazard 18 - 21 March 2010 http://regional.kompas.com Nagasari Karawang Barat Medium Hazard 18 - 21 March 2010 http://regional.kompas.com Adiarsa Timur Karawang Timur Medium Hazard 18 - 21 March 2010 http://regional.kompas.com Parungsari Telukjambe Barat Medium Hazard 18 - 21 March 2010 http://papuapost.wordpress.com Telukjambe Telukjambe Timur Medium Hazard 18 - 21 March 2010 http://papuapost.wordpress.com Sukaharja Telukjambe Timur High Hazard 18 - 21 March 2010 http://papuapost.wordpress.com Puseurjaya Telukjambe Timur Medium Hazard 18 - 21 March 2010 http://papuapost.wordpress.com Sukaluyu Telukjambe Timur Medium Hazard 18 - 21 March 2010 http://papuapost.wordpress.com Sirnabaya Telukjambe Timur Medium Hazard 18 - 21 March 2010 http://papuapost.wordpress.com Teluk Buyung Pakisjaya Medium Hazard 16-17 January 2013 http://papuapost.wordpress.com Karangligar Telukjambe Barat Medium Hazard 16-17 January 2013 http://papuapost.wordpress.com Mekarmulya Telukjambe Barat Medium Hazard 16-17 January 2013 http://papuapost.wordpress.com Mulyajaya Telukjambe Barat Medium Hazard 16-17 January 2013 http://papuapost.wordpress.com Wadas Telukjambe Timur Medium Hazard 16-17 January 2013 http://papuapost.wordpress.com Purwadana Telukjambe Timur Medium Hazard 16-17 January 2013 http://papuapost.wordpress.com Segaran Batujaya Medium Hazard 18 January 2013 http://www.karawanginfo.com Kertajaya Jayakerta Medium Hazard 18 January 2013 http://www.karawanginfo.com Klari Klari Medium Hazard 18 January 2013 http://www.karawanginfo.com Jatimulya Pedes Medium Hazard 18 January 2013 http://www.karawanginfo.com Karyamakmur Batujaya Medium Hazard 19 January 2013 http://m.inilah.com
Karyabakti Batujaya Medium Hazard 19 January 2013 http://m.inilah.com
427
Measure necessary for paddy field land utilization. The analysis of this study shows that there are regions which are vulnerable to natural disasters that however are crucial for the provision of food. As stated in the introduction, Indonesia is a country with a high incidence of natural disasters. During meteorological disasters, this is reinforced by an increasingly diverse catastrophic events due to climate change. In the dry season in 2015, for example, many plants fail to be harvested or their plantings were delayed due to lack of water. An analysis stated that the negative effects of drought in 2015 is the disruption of approximately 111,000 hectares of agricultural land, of which crop failures came to about 8,900 ha
(http://agroindonesia.co.id/). Conversely, in the rainy season, flooding often come causing huge losses
(Kompas, 2013). For this reason, actions are required. It is suggested to use flood-resistant rice varieties in rice cultivation. Some flood-resistant rice varieties have been discovered. Japanese researchers have found SNORKEL 1 and 2 (Fukai & Cooper, 1995). In Indonesia, the Agricultural Research Agency, Ministry of Agriculture, has released a number of high-yielding varieties of flood-resistant rice, among others Tapus. Tapus is developed on swamp land with a pool depth of up to 150 cm. Banyuasin, Batang, Dendang, Indragiri, and Punggur are also rice varieties which are suitable to be developed on potential wetlands, peat and acid sulphate. The varieties of Martapura and Margasari are well adapted to grow on tidal land. From 2008 to 2012, seven flood-resistant paddy varieties were released namely Inpara 1 to Inpara 7 (http://www.litbang.pertanian.go.id/). In addition, some other measures should also be taken, such as the preparation of farmer human resources in anticipation of flooding. In this context, such a study that provides direction on locations with different levels of flood hazard would be very important.
CONCLUSION
The research for delineating flood hazard was conducted at the lower Citarum sub-watershed areas, which covered 3 (three) administrative regions, namely Karawang- (its western part), Purwakarta- (the northern part) and Bekasi regency (at the eastern and northern parts of the regency). Delineating flood hazard was performed using multicriteria analysis and remote sensing. The parameters used were rainfall, elevation, slope, land use and land cover, landform, soil class and geology. An Analytical Hierarchy Process was conducted to obtain the weight of parameter in the genesis of flood hazard. The result of the research indicates that there is a region with different levels of flood hazard, which can be spatially delineated. From a total area of 142,919 ha encompassing the Lower Citarum Sub-watershed, 0.4% of the area is classified as a hazardless flood area, 8.0% defined as slightly flood hazard area, 72.1% considered as medium flood hazard area, 16.9% high flood hazard and finally, 2.7% of the area is of very high hazard level. The map that resulted from this study has also been compared with the field data. This research is important within the context of maintaining national food sovereignty. In fact, national food supply is still dependent on paddy production centers in Java. Unfortunately failure to harvest rice paddies often occur. The recommendations of this study based on the results are to include the use of flood-resistant paddy seed varieties as well as other management policies required in high flood-prone level areas.
ACKNOWLEDGEMENT
This research was financed by the Directorate General of Higher Education, Ministry of National Education of the Republic of Indonesia, through Operational Support for State Universities (Bantuan Operasional Perguruan Tinggi Negeri - BOPTN), Bogor Agricultural University, Indonesia.
REFERENCES
Abdalla, R., Y. Elawad, Z. Chen, S. Han, R. Xia. 2014. A GIS-supported fuzzy-set approach for flood risk assessment. Canadian Water Resources Journal. 39:1, 3-14.
Agroindonesia, 2015. Mewaspadai dampak El nino.
http://agroindonesia.co.id/index.php/2015/08/05/mewaspadai-dampak-el-nino
Akı ı, H., A.Y. Ozalp, B. Tu gut. . Ag i ultu al la d use suita ilit a al sis usi g GIS a d AHP te h i ue. Computers and Electronics in Agriculture, 97: 71-82.
428
Badan Nasional Penanggulangan Bencana (BNPB). 2015. Data dan Informasi Bencana Indonesia. Dibi.bnpb.go.id
Badan Pusat Statistik (BPS). 2014. Jawa Barat dalam Angka 2013. Badan Pusat Statistik Provinsi Jawa Barat. Bandyopadhyay, S., R.K. Jaiswal, V.S. Hegde, V. Jayaraman. 2009. Assessment of land suitability potentials
for agriculture using a remote sensing and GIS based approach. International Journal of Remote Sensing, 30(4): 879-895.
Barredo, J.I. 2009. Normalised flood losses in Europe: 1970–2006. Nat. Hazards Earth Syst. Sci. 9:97-104. Brivio, P.A., R. Colombo, M. Maggi, R. Tomasoni. 2002. Integration of remote sensing data and GIS for
accurate mapping of flooded areas. International Journal of Remote Sensing, 23 (3): 429-441. Ceballos-Silva, A., J. Lopez-Blanco. 2003. Delineation of suitable areas for crops using a multi criteria
evaluation approach and land use/cover mapping: a case study in Central Mexico. Agricultural Systems, 77: 117-136.
Djadja, S.N.R., G.M. Sudradjat. 1990. Peta Geologi Teknik Skala 1:100,000 Lembar Karawang, Jawa Barat. Direktorat Geologi. Bandung.
Effat, H.A., M.N. Hegazy. 2012. Mapping potential landfill sites for North Sinai cities using spatial multi criteria evaluation. The Egyptian Journal of Remote Sensing and Space Sciences. 15, 125-133
Fukai, S., M. Cooper. 1995, Development of drought-resistant cultivars using physiomorphological traits in rice. Field Crops Research. 40 (2), 67-86.
Ghizzoni, T., G. Roth, R. Rudari. 2010. Multivariate skew-t approach to the design of accumulation risk scenarios for the flooding hazard. Advances in Water Resources. 33, 1243-1255
Hossain, M.S., S.R. Chowdhury, N.G. Das, S.M. Sharifuzzaman, A. Sultana. 2009. Integration of GIS and multicriteria decision analysis for urban aquaculture development in Bangladesh. Landscape and Urban Planning, 90: 119-133.
Katili, J.A. 1975. Volcanism and plate tectonics in the Indonesian island arcs. Tectonophysics. Vol. 26, Issues 3–4, April 1975, Pages 165–188.
Kompas. 2013. Antisipasi Gagal Panen akibat Banjir.
http://bisniskeuangan.kompas.com/read/2013/01/19/17302589/antisipasi.gagal.panen.akibat.banjir .
Kourgialas, N.N., G.P. Karatzas. 2011. Flood management and a GIS modelling method to assess flood-hazard areas - a case study. Hydrological Science Journal 56(2): 212-225.
Litbang Pertanian. 2015. Varietas Unggul untuk Lahan Rawa.
http://www.litbang.pertanian.go.id/artikel/one/339/pdf/Varietas%20Unggul%20untuk%20Lahan% 20Rawa.pdf
Malczewski, J. 1999. GIS and Multiple-criteria Decision Analysis. New York: John Wiley & Sons.
Mendas, A., A. Delali. 2012. Integration of multi criteria decision analysis in GIS to develop land suitability for agriculture: Application to durum wheat cultivation in the region of Mleta in Algeria. Computers and Electronics in Agriculture, 83: 117-126.
Parawingira, R., A. Muwira, E Kaseke. 2008. Flood hazard modelling in Tsholotsho district, Zimbabwe. 12th Waternet/WARFSA/GWP-SA Symposium. 26-28 Oct 2011. Maputo, Mozambique
Parvaiz, I., P.K. Champatiray, F.A. Bhat, V.K. Dadhwal. 2012. Earthquake induced landslide dam in the Kashmir Himalayas. International Journal of Remote Sensing, 33(2): 655-660.
Pusat Penelitian Tanah (PPT). 1982. Penelitian Tanah Daerah Jabotabek IV Wilayah Bekasi Bagian Utara. Puslitan, Badan Litbang Departemen Pertanian.
Pusat Penelitian Tanah (PPT). 1983. Jenis dan Macam Tanah di Indonesia untuk Keperluan Survai dan Pemetaan Tanah Daerah Transmigrasi. Pusat Penelitian Tanah. Bogor.
Pusat Penelitian Tanah dan Agroklimat (Puslitanak). 1993. Survai dan Pemetaan Tanah Semi Detil Skala 1:100,000 DAS Citarum Bagian Hulu, Kabupaten Bandung dan Sumedang Propinsi Jawa Barat. Puslitan, Badan Litbang Departemen Pertanian.
429
Rawat, J.S., R.C. Joshi. 2012. Remote-sensing and GIS-based landslide-susceptibility zonation using the landslide index method in Igo River Basin, Eastern Himalaya, India. International Journal of Remote Sensing, 33 (12): 3751-3767.
Rikalovic, A., I. Cosic, D. Lazarevic. 2014. GIS based multi criteria analysis for industrial site selection. Procedia Engineering, 69: 1054-1063.
Rohde, S., M. Hostmann, A. Peter, K.C. Ewald. 2006. Room for rivers: An integrative search strategy for floodplain restoration. Landscape and Urban Planning 78: 50-70.
Saaty, T.L. 1988. The Analytic Hierarchy Process. Typesetters Ltd., Becceles, Suffolk.
Standard National Indonesia (SNI), 2010. Land Cover Classification, SNI No. 7645: 2010. Indonesian National Standardization Agency.
Store, R., J. Kangas. 2001. Integrating spatial multi-criteria evaluation and expert knowledge for GIS-based habitat suitability modelling. Landscape and urban planning. 55: 79-93.
Sudjatmiko. 1972. Peta Geologi Skala 1 : 100.000 Lembar : Cianjur, Jawa Barat. Direktorat Geologi. Bandung Tim Survai Fak. Pertanian, IPB (Faperta IPB). 1993. Survai dan Pemetaan Tanah Semi Detil DAS Citarum Bawah, Kabupaten Karawang, Purwakarta dan Bekasi, Propinsi Jawa Barat. Proyek Penelitian dan Pengembangan Sumberdaya Lahan dan Agroklimat, LREP II, Skala 1 : 50.000.
Utomo, W.Y., Widiatmaka. 2014. Analisis Potensi Kerawanan Bencana Longsor, Keterkaitan Perubahan Tutupan Lahan dan Kesesuaian Pola Ruang dalam RTRW Propinsi Jawa Barat (Studi Kasus Das Citarum). Prosiding Seminar Nasional Pengarus Utamaan Lingkungan dalam Pengelolaan Sumberdaya Alam. Bogor, 6 November 2014.
Verstappen, H.TH. 2010. Indonesian Landforms and Plate Tectonics. Jurnal Geologi Indonesia, 5 (3): 197-207
Widiatmaka, W. Ambarwulan, B. Riadi, I. Nahib, S. Budhiman, A. Halim. 2014. Spatial Multi Criteria Land Evaluation and Remote Sensing for Area Delineation of Shrimp Pond Culture Revitalization in Mahakam Delta, Indonesia. 12th Biennial Conference of Pan Ocean Remote Sensing Conference (PORSEC 2014). 04 – 07 November 2014, Bali-Indonesia
Widiatmaka, W. Ambarwulan, C.E. Sjamsudin, L. Syaufina. 2015. Geographic Information System and Analytical Hierarchy Process for Land Use Planning of Beekeeping in Forest Margin of Bogor Regency, Indonesia. Proceeding of the 1st International Seminar on Tropical Silviculture, 21 August 2015, Bogor, Indonesia.