MAPPING DEFORMATION BY PHOTONIC GUIDED-PATH
TOMOGRAPHY
Nurgiyatna1, Krikor B. Ozanyan2
1Jurusan Teknik Elektro FT UMS, [email protected] 2The University of Manchester
ABSTRACT
Deformation measurement systems are very important in the field of health monitoring of structures in a range of engineering industries including the aerospace, civil, automotive, and marine sector. Recently, the trend is toward applying distributed sensing system that are capable to perform deformation mapping of the surface of interest. Some such systems have been demonstrated, mostly using X-rays. However, they are relatively expensive and complicated.This paper reports on the design and implementation of a Guided Path Tomography (GPT) deformation sensor based on plastic optical fiber (POF), which is simple and inexpensive, and is capable of imaging deformation on non-planar surfaces. Inexpensive intensity-based POF strain sensor is manufactured by a simple method, i.e. making 75 grooves of 0.1mm depth, 1cm apart along the central section of 3m long POFs. A full set of 32 POF strain sensor channels was configured as a sensor mat for GPT imaging of deformation.It is shown that using this sensor the images of deformation that is represented by the curved surface of the sensor mat with a variety of loads can be reconstructed using the ART algorithm
Key words: Deformation – Tomography – POF sensor – ART algorithm
BACKGROUND
The use of fiber Bragg grating (FBG) sensors for strain and bending measurements has been attracting significant attention in recent years and these sensors have been shown to offer excellent potential for structural health monitoring in a range of structures. However, the cost of implementing an FBG sensing system frequently limits its widespread use to only well funded and specialized projects. In FBG-based optical systems, signal recovery requires complicated demodulation techniques, frequently involving costly specialist hardware such as optical spectrum
analyzers. In contrast, inexpensive intensity-based plastic optical fiber systems for performing strain and bending measurements have been demonstrated and shown to be a viable option in the development of reliable and cost-effective sensing systems.
a significant development in the in situ characterization of strain fields around cracks in bulk engineering samples. However, it is not simple dealing with X-rays and systems are usually expensive and unsuitable for industrial environments.
The concept of GPT has introduced and illustrated theoretically and experimentally in the case of temperature imaging on a curved surface. It was stated that similar GPT systems can be implemented for imaging of process parameters other than temperature. Therefore, it is a challenging work to functionality. Computer Tomography is based on straight propagating electromagnetic radiation (“hard field”). Guided-Path Tomography is based on guided propagation of the electromagnetic field, which may not be along straight lines.
Since in this project the guided field is light in the optical fibers, the spatial distribution of light attenuation F(x,y,z) on the surface is imaged by taking light intensity measurement at the periphery of the sensor and solving the inverse problem in 2D. Generally, the GPT sensor is a particular configuration of individual continuous or discrete transducer elements. POF sensors are basically continuous. However, the POF sensors can be also regarded as discrete sensors by making a number of grooves along the POF.
RADON TRANSFORM variables—that is,the variables s, , x, and y have a finite number of possiblevalues, since computers can only deal with a finite number of elementsin the detector and in the field of view. In this presentation, the elements of the slice are the pixels, and each point of measurement on the detector,
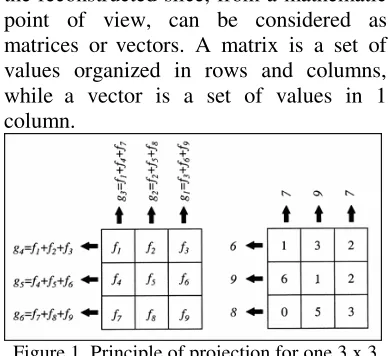
for each projection angle, is called a bin. Thus the number of binsequals the number of points of measurement multiplied by the number of angles. An example of a discreteprojection for a 3 x 3 image at 2 angles is presented in figure 1.The result is a sinogramwith 2 rows corresponding to 2 projection angles, and 3 columns corresponding to 3 points of measurements on the detector,so there are 6 bins.Value in each bin is sum of values of pixels that project onto that bin.
The sets of values in the sinogramand the reconstructed slice, from a mathematic point of view, can be considered as matrices or vectors. A matrix is a set of values organized in rows and columns, while a vector is a set of values in 1 column.
Figure 1. Principle of projection for one 3 x 3 slice at angle = 0 and = 90°
SYSTEM DESIGN
In general the designed system consists of three main components: optical source unit, grooved plastic optical fiber sensor mat, and optical receiver unit. The optical source unit is an array of 32 LEDs with a LEDs-toPOFs adaptor performing one-to-one connection between the LEDs and POFs. The POF sensor is manufactured by a simple method, i.e. making 75 grooves of 0.1mm depth, 1cm apart along the central section of 3m long POFs. The sensing principle relies on the intrinsic modulation of the light intensity. The sensor mat consists of 32 POF sensors. All of the POF sensors are then coupled to a photodetector using a POFs-to-detector adaptor in front of the optical receiver unit. Figure 2 shows the complete sensor system.
The principal operation of the system is by sequentially activating 32 LEDs array. To perform this operation, 4x8 DIP switches are used in the optical source circuit. Once a LED has activated, output from photodetector has to be recorded. The operation is repeated for all of the other
LEDs. If the system is firmly embedded on a physical surface experiencing a stress, the recorded data can be used to reconstruct the strain image of the surface. STRAIN IMAGING EXPERIMENT
In this experiment, the curvature of surface of the sensor mat would be imaged by measuring attenuation of optical power output of the POF sensors when the sensor mat was loaded with an object. Firstly, the optical power output of each POF sensors was measured without load on the sensor mat, performed by sequentially activating the LEDs using DIP switches on the optical source unit and the optical power output displayed by the optical meter was recorded individually as ‘Po’ giving 32 values of ‘Po’, i.e. 8 values for each four sensors directions. The object then was put on the surface of interest of the sensor mat and the optical power output of individual sensor was measured and noted as ‘Px’ providing 32 values of ‘Px’ for all of the sensors directions. The attenuation of the optical power output of individual sensors
Figure 2. The complete sensor system
vertical, left-to-right diagonal, and right-to-left diagonal direction respectively.
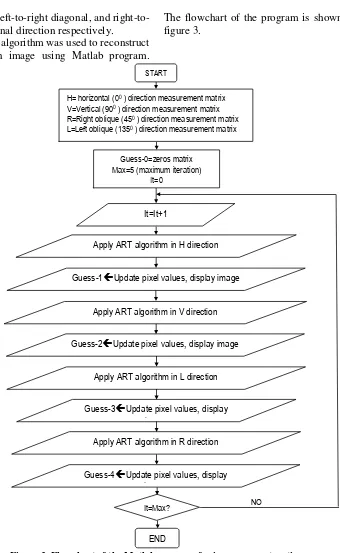
ART algorithm was used to reconstruct the strain image using Matlab program.
The flowchart of the program is shown in figure 3.
! ! " #$
% & '
(
( ( )#
% &# *+ + , - + .
/++ . / 0
% &1 *+ + , - + .
/++ . / 0
% &$ *+ + , - + .
/++ . / 0 !
% & *+ + , - + .
/++ . / 0
( ' 2
3 4
50/ 0
IMAGE RECONSTRUCTION FROM THE SENSOR MAT
The image reconstruction is based on the data of optical power attenuation. Using the reconstructed sensitivity matrix, the pixel image of the sensor mat surface is displayed. The pixel image is presented by imaging on a reconstruction grid
determined by the spatial sampling (8 x 8 pixels).
EXPERIMENT RESULTS
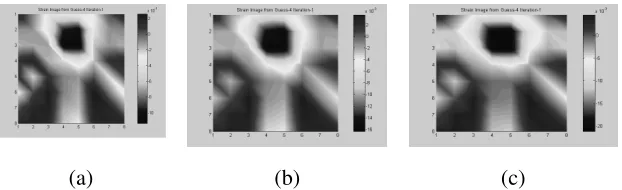
The surface images with smoothing for the circular foot print object on the center position of the sensor mat with variation weight of 3260gr, 4180gr, and 6260gr are presented in figure 4 (a), (b), and (c), respectively.
(a) (b) (c)
Figure 4. Reconstructed surface image of acircular foot print object, center position (a) Load a.1: 3260gr (b) Load a.2: 4180gr (c) Load a.3: 6260
(a) (b) (c)
Figure 5. Reconstructed surface image of acircular foot print object, side position (a) Load a.1: 3260gr (b) Load a.2: 4180gr (c) Load a.3: 6260
It can be seen from the figures that the deformation of the surface can be reconstructed for the circular foot print object of variation in the weight even though the deformation is not totally a circular shape. Although the three reconstructions appear to be identical, the varying depth of the surface can be detected by looking at the colormap in the right side of the surface image. The figures show that the different weight of object deform the surface to a different depth, the heavier the weight the deeper the
deformation. Therefore, it can be verified that the sensor mat is sensitive to variation of the foam deformation, proportional to the weight of the test objects.
center position is deeper then the side position for all of weight.
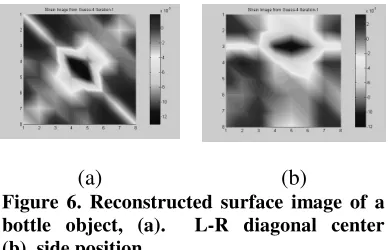
Figure 6 presents reconstructed surface images of guess-4 for a bottle object in position-1 and position-2 respectively.
(a) (b)
Figure 6. Reconstructed surface image of a bottle object, (a). L-R diagonal center (b). side position
The surface images show that the bottle shape can be reconstructed. It can also be seen by comparing the depths of the deformations that the center position is more sensitive.
CONCLUSIONS
The concept of GPT has been implemented in the case of mapping deformation on a curved surface. A GPT
sensor mat was constructed by arranging 32 plastic optical fiber strain sensors on the surface of a foam substrate. The sensors were manufactured by grooving the POFs with 75 grooves, 1cm apart of 0.1mm depth along the central of 3m long POFs.
Using the reconstructed sensitivity matrix, the pixel image of the sensor mat surface is displayed. The pixel image is presented by imaging on a reconstruction grid determined by the spatial sampling (8 x 8 pixels). Images of the surface curvature of the sensor mat under the weight of several objects, position and shape have been reconstructed by using the ART algorithm.
It is shown that the different weight of object deform the surface to a different depth, the heavier the weight the deeper the deformation. Therefore, it can be verified that the sensor mat is sensitive to variation of the foam deformation, proportional to the weight of the test objects. The sensor mat is also sensitive to variation of weights, position and shape.
REFERENCES
A. M. Korsunsky, K. E. Wells, and P. J. Withers, “Mapping two-dimensional state of strain using synchrotron X-ray diffraction,” Scripta Materialia, vol. 39, No. 12, pp. 1705–1712, 1998
A. Steuwer, J.R. Santisteban, M. Turski, P.J. Withers, T. Buslaps, “High-resolution strain mapping in bulk samples using full-profile analysis of energy dispersive synchrotron X-ray diffraction data,” Elsevier Nuclear Instruments and Methods in Physics Research B 238., pp. 200–204, 2005
G. F. Fernando, “Fibre optic sensor systems for monitoring composite structures” Elsevier Reinforced Plastic, pp. 41-49, 2005
H. Ling, K. Lau, L. Cheng, W. Jin, “Viability of using an embedded FBG sensor in a composite structure for dynamic strain measurement,” Elsevier Measurement 39,
J. Paul, B.K.A. Ngoi, L.P. Zhaob, “Enhanced wavelength tuning of laterally loaded FBG strain sensors through optimization of the pressure transmitting system,” Sensors and Actuators A 120, pp. 416–423, 2005
K. B. Ozanyan, S. G. Castillo, and F. J. P. Ortiz, “Guided-Path Tomography Sensors for Nonplanar Mapping,” IEEE Sensors Journal.,vol. 5, No. 2, pp. 167-174, 2005
K. S. C. Kuang and W. J. Cantwell, “The use of plastic optical fibres and shape memory alloys for damage assessment and damping control in composite materials,” Meas. Sci. Technol. 14, pp. 1305–1313, 2003
K. S. C. Kuang, Akmaluddin, W. J. Cantwell1 and C. Thomas, “Crack detection and vertical deflection monitoring in concrete beams using plastic optical fibre sensors,”
Meas. Sci. Technol. 14, pp. 205–216, 2003
K. S. C. Kuang, S. T. Quek and M. Maalej, “Assessment of an extrinsic polymer-based optical fibre sensor for structural health monitoring,” Meas. Sci. Technol. 15, pp. 2133–2141, 2004
K. S. C. Kuang, W. J. Cantwell1 and P. J. Scully, “An evaluation of a novel plastic optical fibre sensor for axial strain and bend measurements,” Meas. Sci. Technol. 13, pp. 1523–1534, 2002
K. S. C. Kuang1 and W. J. Cantwell, “The use of plastic optical fibre sensors for monitoring the dynamic response of fibre composite beams,” Meas. Sci. Technol. 14, pp. 736–745, 2003
K. Tian, Y. Liu, Q. Wang, “Temperature-independent fiber Bragg grating strain sensor using bimetal cantilever,” Elsevier Optical Fiber Technology 11, pp. 370–377, 2005 P. Moyoa, J.M.W. Brownjohnb, R. Sureshc, S.C. Tjinc, “Development of fiber Bragg
grating sensors for monitoring civil infrastructure,” Elsevier Engineering Structures 27, pp.1828–1834, 2005
R. J. Bartlett, R. P. Chandy, P. Eldridge, D. F. Merchant, R. Morgan and P. J. Scully, “Plastic optical fibre sensors and devices,” Transactions of the Institute of Measurement and Control 22, pp. 431–457, 2000
R. Sinclair, M. Preuss, and P. J. Withers, “Imaging and strain mapping fibre by fibre in the vicinity of a fatigue crack in a Ti/SiC fibre composite,” Materials Science and Technology, vol. 21, No. 1, pp. 27-34, 2005
Y. Fan, M. Kahrizi, “Characterization of a FBG strain gage array embedded in composite structure,” Sensors and Actuators A 121, pp. 297–305, 2005