The Contribution of Agriculture in a Local Greenhouse Gas Turnover
Arief Sabdo Yuwono
Dept. of Civil and Environmental Engineering, Bogor Agricultural University (IPB) PO Box 220 Bogor, Indonesia. Tel.: +62 251 8627 225
arief_sabdo_yuwono@yahoo.co.id
Abstract
The general objective of this study is to analyze the contribution of agricultural sector in a local scale greenhouse gas turnover. It includes identification and quantification of the entire agricultural activities regarded as greenhouse gas sources as well as those concerned as greenhouse gas sink. The study was carried out in 2010 and based on a series of five years data compiled from a municipality in West Java Province as a case. The greenhouse gas sources were categorized into four sectors covering energy sector, solid waste, agricultural and animal husbandry sectors whereas the greenhouse gas sink was identified merely in agricultural sector. The amount of a single greenhouse gas emission was calculated by multiplication between a source unit and its corresponding emission factor. The total quantity of greenhouse gas emission generated by the municipality was summation of the whole sources from the entire sectors. The amount of the whole greenhouse gas sink was summation of the total sequestered carbon. The study result based on five years compiled data indicated that the average municipality greenhouse emission was in the order of 14.0 MT CO2-e per year whereas the net sink was approximately 0.05 MT CO2-e per year. The contribution of agricultural sector was merely 0.08 % of the total municipality greenhouse gas sources while its contribution on the greenhouse gas sequestration (as sink) was 2.39% of the emitted greenhouse gases. It can be concluded that based on the quantitative analysis, the local agricultural sector is a manner to sequester atmospheric carbon.
Keywords: agricultural sector, greenhouse gas, source, sink, turnover.
Introduction
Materials and Methods
The study was carried out in 2010 and based on a series of five (5) years data compiled from a municipality in West Java Province, called City of X, as a case. The greenhouse gas sources were categorized into four sectors covering energy sector, solid waste, agriculture and animal husbandry sector whereas the greenhouse gas sink was identified merely in agricultural sector. The amount of a single greenhouse gas emission was calculated by multiplication between a source unit and its corresponding emission factor as indicated in Box 1. The total quantity of greenhouse gas emission generated by the municipality was summation of the whole sources from the entire sectors. The amount of the whole greenhouse gas sink was summation of the total sequestered carbon.
Box 1. General equation and the related emission factor for agricultural sector data source CO2, CH4 and N2O emission from wetland or dryland paddy field:
• Data sourceμ Centre Agency for Statistics, City of X, 2005-2009
• Emission factor: IPCC Guidelines for National Greenhouse Gas Inventories, 1996
• GHG mass = wetland area x plantation day x emission factor
Carbon sequestration by city re-greening program and estate crops plantation: • Data sourceμ Centre Agency for Statistics, City of X, 2005-2009 and BPLH, City of X, 2009
• Emission factorμ IPCC Guidelines for ζational GHG Inventories, 1λλ6 • Carbon sequestration = area x emission factor
Greenhouse Gas Source and Sink in Agricultural Sector
Agricultural activities regarded as greenhouse gas sources and sink in The City of X covers wetland paddy cultivation, dryland paddy cultivation, estate crops, and city re-greening program. The amount of the absorbed carbon was estimated simply from the area of the paddy cultivation. The similar case occurs in the estate crops as well. Therefore, the total amount of the absorbed carbon by those plant species was calculated directly based on the area of the cultivation.
Contribution of Agricultural Sector in the Local Greenhouse Gas Turnover
uses. In 2009 even, the total area of the wetland paddy field was less than a half of the total area in 2005 meaning that the amount of the emitted greenhouse gas becomes less than a half as well.
(a) (b)
Figure 1. CO2 emission from wetland (a) and dryland (b) paddy field.
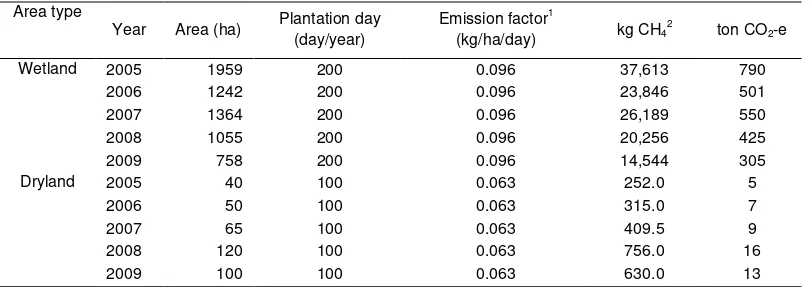
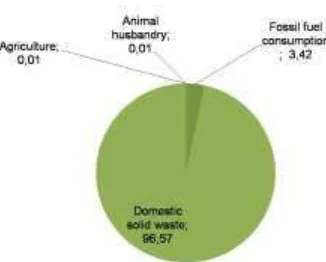
The amount of the sequestered GHG from dryland paddy field however, was not decreasing in the period of 2005-2009. It showed that the CO2 sequestration from dryland paddy field in 2009 was almost threefold of that in 2005. This was simply due to the growing area of dryland paddy field in the City of X. The amount of methane emission from the wetland and dryland paddy field is presented in Table 1. It revealed that according to the paddy field area, the quantity of the emitted methane varies directly with the total paddy area. The more paddy field area, the higher amount of the methane emission, and vice versa. The generation of the methane in the wetland paddy area is initiated by anaerobic condition of the inundated paddy field as it was commonly practiced in conventional paddy cultivation system in Indonesia. As a result, methanogenic bacteria become more active to generate methane in such kind condition. The relative contribution of agricultural sector on total methane emission of The City X is presented in Figure 2. Agriculture contributes merely 0.01 % of the total methane emission where the largest portion was contributed by domestic solid waste due to the characteristic of the City X as an urban area. Another main issue of an urban area is the scarcity of agricultural land. Therefore, total methane emission generated by agricultural land is consequently relatively small.
Table 1. CH4 emission from wetland paddy field
Area type
Data source: Centre Agency of Statistics, City of X (2005-2009) 1
IPCC Guidelines for National Greenhouse Gas Inventories, 1996 2
kgCH4 = area x plantation day x emission factor
down organic matter in the waste under anaerobic conditions to produce methane (Anonymous, 2002). The landfilling of municipal solid waste is a significant source of atmospheric methane (CH4), contributing to10–20% of anthropogenic methane emissions (IPCC, 2001 in Einola et al., 2008). This is in line with the findings of Papageorgiou et al. (2009) stated that disposal of waste in landfills generates methane that has high global warming potential.
The third concerned parameter of GHG in agricultural sector is nitrous oxide (N2O) where its theoretical emission quantity was determined by areas of the wetland and dryland paddy field that were multiplied by their corresponding emission factors. Relative contribution of agriculture sector on total nitrous oxide emission was very small, i.e. merely 0.1 percent. Agricultural sector was not an important source of GHG from the viewpoint of the generated nitrous oxide (N2O).
Table 2. CH4 emission per sector expressed in ton CO2 equivalent (CO2-e)
Sector Average (ton CO2-e)
Fossil fuel consumption 2,9E+05
Domestic solid waste 8,2E+06
Agriculture 5,2E+02
Animal husbandry 6,6E+02
CH4 Total emission 8,4E+06
Figure 2. Relative contribution of agricultural sector on total methane (CH4) emission.
Cumulative and yearly rate of carbon sequestration by means of city re-greening program is presented in Figure 3. The lowest part of the graph occurred in 2008 as a consequence of the re-greening program that achieved 10.0 hectares merely whereas the average area of the re-re-greening program normally was 23.8 hectares per year. In contrast however, the best success of the city re-greening program was reached in the last year (2009) where The City of X showed their commitment to reduce the greenhouse gas emission as re-greening area covered 41.2 hectares in a year.
(a) (b) Figure 3. Carbon sequestration by city re-greening program (a) and estate crop (b).
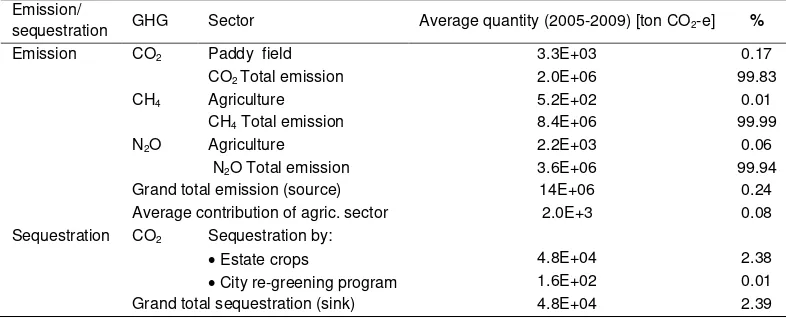
An important illustration of the emission profile of The City of X is an outline of the GHG emission and the related carbon sequestration quantity. Analysis on the compiled data revealed that agricultural sector plays a minor role in emitting greenhouse gas (GHG) as indicated in Table 3. Percentage of the CO2 emission from agricultural sector was merely 0.17% whereas its contribution on CH4 and N2O emission were only 0.01% and 0.06%, respectively. On the other side, however, agriculture contributes about 2.39% (Table 3) sequestration process of the emitted carbon dioxide back to the earth through photosynthesis process. It indicated that agriculture plays a significant role in the greenhouse gas turnover in the local scale.
The quantity of the emitted methane (CH4) and nitrous oxide (N2O) were significantly higher than the amount of emitted carbon dioxide (CO2). Such condition should be noticed carefully since the warming effect of CH4 and N2O are much stronger than CO2. According to Jones (1992), although increasing atmospheric CO2 is often assumed to be the major contributor to warming, the combined effect of a number of trace gases, principally methane, nitrous oxide and chlorofluorocarbons (CFCs), though present at concentrations that are two to six orders of magnitude lower than CO2, can rival the effect of CO2 because, per molecule they absorb infrared radiation much more strongly.
Table 3. Outline of the GHG emission of The City of X and the carbon sequestration
Emission/
sequestration GHG Sector Average quantity (2005-2009) [ton CO2-e] %
Emission CO2 Paddy field 3.3E+03 0.17
CO2 Total emission 2.0E+06 99.83
CH4 Agriculture 5.2E+02 0.01
CH4 Total emission 8.4E+06 99.99
N2O Agriculture 2.2E+03 0.06
N2O Total emission 3.6E+06 99.94
Grand total emission (source) 14E+06 0.24
Average contribution of agric. sector 2.0E+3 0.08
Sequestration CO2 Sequestration by:
Estate crops 4.8E+04 2.38
City re-greening program 1.6E+02 0.01
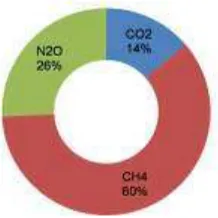
Figure 4. Relative emission of The City of X based on GHG component (2005-2009).
More severe condition occurred in The City of X where GHG parameters of CH4 and N2O were absolutely much higher than CO2 (Figure 4). As a consequence, the warming effect on the atmosphere would be much higher too. The main potential reason for such condition was that the people of The City of X generated solid wastes higher than the other Indonesian urban population.
References
Anonymous, 2002. Assessment of Greenhouse Gas Emissions from Solid Waste Disposal as a Result of the Proposed New Zealand Waste Strategy. Ministry for the Environment. Reference Number 19518. New Zealand.
de Nevers, N. 1995. Air Pollution Control Engineering. McGraw-Hill, Co. New York. Pp 506.
Einola, J.-KM., Sormunen, KM., Rintala, JA. 2008. Methane oxidation in a boreal climate in an experimental landfill cover composed from mechanically–biologically treated waste. Sci.of the Total Environ. 407:67-83.
Jones, HG. 1992. Plants and Microclimate. A Quantitative Approach to Environmental Plant Physiology. 2nd ed. Cambridge University Press, Cambridge, UK. Pp 428.
Mackie, KR and Cooper, CD. 2009. Landfill gas emission prediction using Voronoi diagrams and importance sampling. Environ. Modeling and Software 24: 1223-1232.
Manahan, SE. 2000. Environmental Chemistry 7th ed. Lewis Publishers, Boca Raton, USA. Pp 898.
Papageorgiou, A., Barton, JR., and Karagiannidis, A. 2009. Assessment of the greenhouse effect impact of technologies used for energy recovery from municipal waste: A case for England. J. of Environ. Management 90: 2999-3012.


