THE EFFECTS OF HIGH ENERGY MILLING ON
THE PERFORMANCE OF SILICATE ROCK FERTILIZERS
Joko Priyono
Ir (B.Sc-Hon) in Soil Science
Bogor Agriculture University (IPB), Indonesia 1982 M.Sc. in Soil Science
Auburn University, Alabama, USA 1991
This thesis is presented for the degree of
Doctor of Philosophy
of
The University of Western Australia
School of Earth and Geographical Sciences
Faculty of Natural and Agricultural Sciences
ABSTRACT
Many researchers have proposed the use of silicate rock fertilizers (SRFs) as
alternatives to chemical fertilizers. However, the application of SRFs in modern
agricultural practices is limited due mainly to the slow release of plant-nutrient
elements from SRFs and consequently many tonnes/ha of SRFs may need to be
applied. Simple and inexpensive methods of modifying the physicochemical
properties of SRFs are needed to improve the agronomic effectiveness of SRFs. This
thesis is focused on the evaluation of high-energy milling to produce superfine
particles to improve the effectiveness of mafic (basalt and dolerite) and felsic (gneiss
and K-feldspar) rocks for use as fertilizers. The ground mafic rocks are for use as Ca
and Mg fertilizers and the ground felsic rocks as K fertilizers.
Laboratory and glasshouse experiments were conducted with several
potential SRFs. In laboratory experiments, initially milled rocks (Ø < 250 µm for basalt, dolerite, and gneiss; Ø < 150 µm for K-feldspar) were further milled with a
ball mill (Spex-8000) for 10, 30, 60, 90, and 120 min under dry and wet (rock/water
ratio = 1/3) conditions. To investigate possible reaction between constituents, other
subsamples of initially milled basalt, dolerite, and gneiss were added to reagent
grade NaCl or KCl (4.5 g rock + 0.5 g NaCl or KCl) and milled for 120 min under
dry and wet conditions. Basalt and dolerite were also mixed with K-feldspar at a
ratio of 1 : 1 and milled for 120 min under dry and wet conditions. For use in the
glasshouse experiment, the initially milled rocks were further milled with a vertical
stirred ball mill for 1 h in a dry condition. The elemental and mineralogical
compositions of the SRFs were determined using XRF and XRD. Effects of milling
on major physicochemical properties of milled rocks were determined, including
particle size (Malvern Mastersizer), surface area (BET-N2), quantities of amorphous
constituents (XRD, oxalic acid-oxalate extraction, TEM), extractable cations (1M
CH3COONH4 pH 7), pHH2O, and electric conductivity. Dissolution kinetics in 0.01M
acetic-citric acids (for 56 days) and soil (for 10 months) were determined. Based on
the results of these laboratory experiments, a glasshouse experiment was carried out
for 12 months to evaluate the effects of SRF application on growth and nutrient
Milling reduced particle size, enhanced amorphism, and increased the release
of structural cations from the rocks, with the effects due to dry milling being greater
than for wet milling. The optimum milling times which produced maximum
amounts of exchangeable cations (Na, K, Ca, and Mg) were 30 - 90 min, depending
on rock type. The use of NaCl and KCl as milling additives did not enhance the
properties of the SRF.
These effects of milling on properties of SRF enhanced the extent of
dissolution of SRFs in 0.01M acetic-citric acid and in the soil. More amorphous
and/or structurally disordered materials than crystalline materials were dissolved in
both dissolution media. The proportion of rapidly dissolved elements, which may be
considered to be plant-available, was increased by milling, i.e., from about 2 % (for
initially milled rocks) to 70 % (for 120 min dry-milled rocks) of total content, with
this proportion for monovalent cations (Na and K) mostly being 2 – 3 fold higher
than for divalent cations (Ca and Mg). Incubation of SRFs in soils provided a
significant liming effect with a minor salinity effect. The extent of dissolution of
SRF in the soil could be accurately predicted by the SRF dissolved in acetic-citric
acid in 1 h. Neither SRF nor soil properties were highly predictive of dissolution of
basic cations from SRFs in soils, although equations including % sand, % clay, and
exchange acidity of the soils are quite predictive of dissolution.
The application of Ca in basalt and dolerite SRFs at the rates of 333 – 1332
mg of total Ca/kg soil (≈ 4 – 16 t SRF/ha) greatly increased plant yield and Ca uptake of ryegrass grown on highly acidic and/or Ca deficient soils, but did not do
so for plants grown on less acidic and/or relatively Ca-rich soils. The large effects on
plants were due mainly to the increase in soil pH rather than Ca supply from the
SRFs. Thus application of these SRFs at much lower rates (≈ 0.2 – 1 t SRF/ha) as Mg fertilizers had only minor effects on pH and consequently on plant growth and
nutrient uptake. The applications of milled gneiss at rates of 225 – 1332 mg of total
K/kg soil (≈ 25 – 100 t SRF/ha) and K-feldspar (5 – 20 t/ha) greatly increased plant growth and K uptake on soils deficient in K. Milled gneiss was nearly as effective as
K2SO4 for use as a K fertilizer based on total content of K in dry tops of plants, but
K-feldspar was not effective. However, much of the K2SO4 had been consumed by
plants and also these high application rates of K-SRF caused a large confounding
producing increased yield. It is apparent that milling greatly improves the
effectiveness of silicate rocks for use as fertilizers, thus high-energy milling may be
used for manufacturing effective SRF.
Results of this research were mostly consistent with pioneering findings by
other researchers which found that SRFs may be effective soil ameliorants. SRFs are
multinutrient fertilizers (including Si) and SRFs are effective liming materials. The
multiple beneficial effects of SRFs were greatly improved by high intensity milling
of the SRFs. However, further research is needed to identify optimum and
inexpensive milling methods for use at an industrial scale. The effectiveness of
milled-silicate rocks as multinutrient fertilizers under field conditions for various
AKNOWLEDGEMENTS
I would like to express my deepest appreciation to my supervisor Prof. Bob
Gilkes for his continuous encouragements, innovative criticism and ideas, and
attention throughout the course of my work. I have learned many things from him as
a supervisor, researcher, teacher, and friend.
Special thank to Prof. Paul McCormick for his help and permission to use
research facilities in Department of Mechanical and Materials Engineering, The
University of Western Australia. Also, I would like to thank to Mrs. Kellie Pathick
for her assistance in operating milling equipment.
Australian Government (AusAID) is gratefully acknowledged for providing
financial support for my postgraduate research. Special thanks to Mr. Keith
Chambers and Mrs. Rhonda Haskell (AusAID Liaison Officers) for being friendly
and so helpful in many things.
I would like to express my gratitude to my father and mother for their
endless encouragements and prayers from distance, my deepest appreciation to my
lovely wife and sons for their patience and prayers.
Dr. Martin Saunders and Steve Parry, I appreciate your assistance in
operating the TEM instrument and interpreting the results of TEM analysis. Bunches
of thanks to Michael Smirk for his assistance in solving analytical problems, Barbara
Millar, Susie Cass, Janet King, and Vicky Wallis for being friendly and helpful.
Special thanks to Kuswardiyanto in Bunbury for his help during soil sampling.
Finally, thanks to all mineralogy group members for your friendship in
sharing knowledge, experiences, thoughts, and laboratory equipment.
CONTENTS
ABSTRACT i
AKNOWLEDGEMENTS iv
CONTENTS v
LIST OF FIGURES vii
LIST OF TABLES ix
LIST OF APPENDICES xv
Chapter 1. INTRODUCTION 1.1. General Introduction 1
1.2. The Objectives of Research 3
1.3. Organization of the Thesis 4 Chapter 2. EFFECTS OF MILLING TIME, CONDITIONS, AND REACTIVE ADDITIVES ON THE CHARACTERISTICS OF SILICATE ROCKS 2.1. Introduction 5
2.2. Materials and Methods 6
2.2.1 Samples of Silicate Rocks 6 2.2.2 Milling Procedures 7
2.2.3 Analytical Methods 6
2.3. Results and Discussion 9
2.3.1 General Characteristics of Silicate Rocks 9 2.3.2 Effects of Milling Time and Condition 10
2.3.2.1 Physical and Mineralogical Properties 10
2.3.2.2 Chemical Properties 18
2.3.3 Effects of Reactive Additives 26
2.4. Conclusions 30
Chapter 3. DISSOLUTION OF MILLED-SILICATE ROCKS IN ORGANIC ACID 3.1. Introduction 32
3.2. Materials and Methods 34
3.3. Results and Discussion 35
3.3.1 Dissolution Kinetics of Silicate Rocks 35
3.3.2 Effects of Milling on Dissolution Kinetics 41
3.3.3 Elemental Dissolution of Silicate Rocks 42
3.3.4 Dissolution Congruency 44
3.3.5 Characteristics of Residual Rocks after Partial Dissolution 47 3.4. Conclusions 58
Chapter 4. DISSOLUTION OF MILLED-SILICATE ROCKS IN THE SOIL 4.1. Introduction 60
4.2. Materials and Methods 60
4.2.1. Silicate Rocks and Soil Samples 60
4.2.2. Analytical Methods 61
4.2.3. Incubation Experiment 63
4.3. Results and Discussion 64
4.3.2. Effects of Milling Time 65
4.3.2.1. Dissolution of Major Plant Nutrient Elements 65
4.3.2.2. Soil pH and EC 69
4.3.3. Dissolution in Dilute Acetic-Citric Acid versus Dissolution in the Soil 71
4.3.4. Dissolution of Silicate Rocks versus Soil Properties 73
4.3.5. Percentage Dissolution versus Rocks Properties 76
4.4. Conclusions 76
Chapter 5. A GLASSHOUSE EXPERIMENT 5.1. Introduction 79
5.2. Materials and Methods 79
5.2.1. Fertilizers 79
5.2.2. Experimental Design 80
5.2.3. Analysis of Data 83
5.3. Results and Discussion 84
5.3.1. Plant Growth and Nutrient Uptake 84
5.3.2. Concentration of Plant Nutrients in Dry Tops 90
5.3.3. Relative Agronomic Effectiveness (RAE) of SRFs 94
5.3.4. Internal Efficiency (IE) of Nutrient Elements 95
5.3.5. Extractable Nutrients, pH, and EC of Residual Soils 100
5.3.6. Quantity of Nutrients Dissolved from SRF in the Soil 104
5.4. Conclusions 106
Chapter 6. SUMMARY, LIMITATIONS, AND RECOMMENDATIONS 6.1. Summary of Findings 109
6.2. Limitations and Recommendation for Future Researches 111
6.3. Promoting the Use of SRF for Appropriate Agricultural systems 112 REFFERENCES 114
Publication derived from this thesis: 120
LIST OF TABLES
Total elemental and mineral compositions of the silicate rocks at their initial condition (T0).
The values of Eo, a, n, and R2 for Eq. (3.1) for dissolution of rocks
estimated from the total mole charge of major elements (Na, K, Ca, Mg, Fe, Al, and Si) dissolved for basalt, dolerite, and gneiss, (Na, K, Al, and Si) dissolved for K-feldspar relative to the total of these elements in rock (Appendix A1).
The quantities of rapidly dissolved major plant nutrient elements1 (Eo)
for basalt, dolerite, gneiss, and K-feldspar SRFs, calculated using Eq. (3.1.) for individual elements. The values of Eo are also presented as %
of total in rock (e.g., percentage cmolcan element dissolved over total
cmolc the element in the milled rock).
Major properties of soil samples used in this experiment.
Distribution of the values of coefficient correlation (r) for the linear relationship between dissolution of basic cations from the SRFs in
0.01M acetic-citric acid for 1 hour, 1 day, and 56 days (E1H, E1D, and
E56D) versus the average dissolution that occurred in 23 soils for 2 months (E2M).
Soil properties with significant-linear bivariate relationships (p < 0.05) with dissolution of basic cations from the SRFs in 10 soils for each milling time. Dissolution is presented as % of (Ca + Mg) and (K + Na) dissolved in 10 soils relative to total content of these cations in SRF.
Multivariate equations relating dissolution of basic cations from SRFs
to soil properties with the determination coefficient (R2) > 0.50 for
those relationships.
Distribution of values of correlation coefficient (r) for bivariate relationships between median particle size (D50), effective surface area (SA) and amorphous constituents (AC) of milled rocks with dissolution
(E2M and ∆E0-2M) of alkali elements (i.e., Ca + Mg for basalt and
dolerite SRFs, K + Na for gneiss and K-feldspar SRFs) in each of 23 soils incubated for 2 months.
Several properties of soils used for glasshouse experiment.
5.3.
5.4.
5.5.
5.6.
Amounts of nutrient supplied by SRF based upon acid dissolution data and considered to be equivalent to a luxury nutrient supply.
The amounts of SRF added to 1 kg of soil to supply the amounts of nutrients listed in Table 5.3.
The best fit equations describing relationships between cumulative uptake of K (Y, mg/kg) and application rate of K fertilizers (X, mg K/kg) and RAE values. The RAE value is defined as ratio of slope of
the equation for SRF relative to that for K2SO4 at the application rate
(X) of 90 mg K/kg.
Internal efficiency (IE) and relative internal efficiency (RIE) for application of K fertilizers calculated based on initial slope of response curves in Figures 5.8 and 5.9.
82
82
95
LIST OF FIGURES
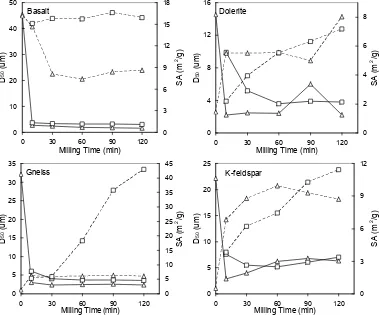
Median particle size (D50, full lines) and specific surface area (SA,
broken lines) for dry- (∆) and wet- (□) milled rocks as a function of
milling time.
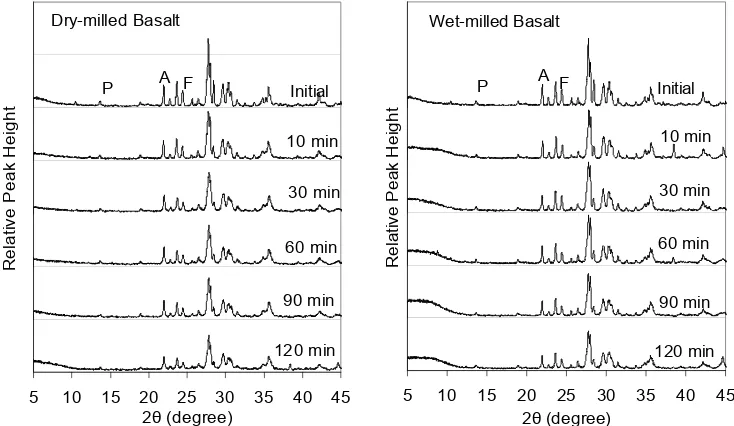
XRD patterns of basalt milled for several milling times under dry and
wet conditions. P = pyroxene 110 (d = 6.45 Ǻ), A = amphibole 131 (d
= 3.89 Ǻ), and F = feldspar 114 (d = 3.47 Ǻ).
XRD patterns of dolerite milled for several milling times under dry
and wet conditions. M = mica 002 (d = 10.06 Ǻ), A = amphibole 110
(d = 8.4 Ǻ), and F = feldspar 113 (d = 2.83 Ǻ).
XRD patterns of gneiss milled for several milling times under dry and
wet conditions. C = chlorite 004 (d = 7.0 Ǻ), Q = quartz 101 (d = 3.43
Ǻ), and F = feldspar (albite) 220 (d = 3.17 Ǻ).
XRD patterns of K-feldspar milled for several milling times under dry
and wet conditions. M1 = microcline 112 (d = 3.49 Ǻ) and M2=
microcline 131 (d = 3.03 Ǻ).
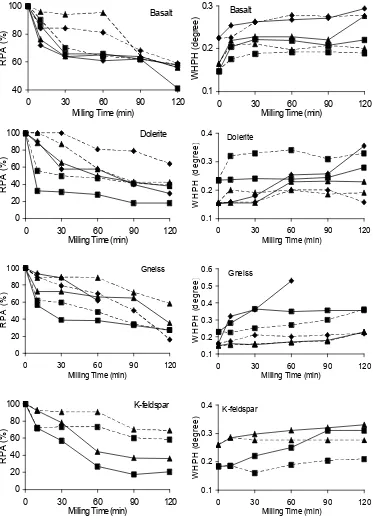
Relative peak area (RPA) and width at half peak height (WHPH) versus milling time for several diagnostic reflections (hkl) of several minerals in basalt, dolerite, gneiss, and K-feldspar dusts. Full and broken lines are respectively for dry- and wet-milled rocks. The analysed peaks are referred to in the XRD patterns presented in Figures 2.2 – 2.5.
The relationships between percentages of exchangeable basic cations and oxalate-extractable (Fe + Al + Si) versus the percentage of amorphous materials (calculated as averaged [100% - RPA] for
several XRD peaks of several minerals) for dry- (□ full lines) and
wet-(■broken lines) milled rocks.
Concentration of iron (expressed as % Fe2O3) versus milling time of
basalt (▲), dolerite (∆), gneiss (■) and K-feldspar (□) milled under dry
(full lines) and wet (broken lines) conditions.
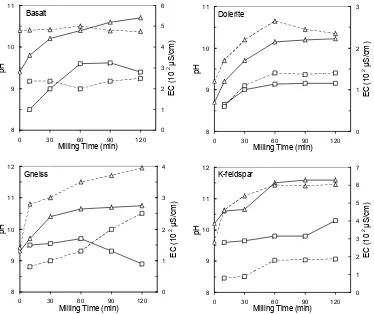
The pHH2O 1 : 5 (full lines) and EC 1 : 5 (broken lines) of suspensions
2.10.
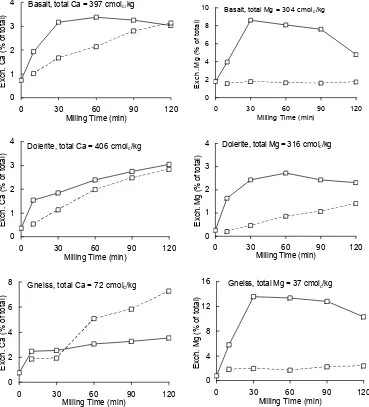
The percentages of CH3COONH4-exchangeable Ca and Mg for basalt, dolerite, and gneiss milled under dry (full lines) and wet (broken lines) conditions as a function of milling time. The % exchangeable cation is calculated relative to total of this cation in rock dust for each milling time and condition (Appendix A1). Total element presented in each graph is for initially milled rock (T0).
The percentages of CH3COONH4-exchangeable K and Na for basalt, dolerite, and gneiss, and K-feldspar milled under dry (full lines) and wet (broken lines) conditions as a function of milling time. The % exchangeable cation is calculated relative to total of this cation in rock dust for each milling time and condition (Appendix A1). Total element presented in each graph is for initially milled rock (T0).
The percentage of Mg and K (for basalt, dolerite, and gneiss dusts), K
and Na (for K-feldspar dust) extracted in 0.2M ammonium
oxalate-oxalic acid (□) and 1M CH3COONH4 pH 7 (∆) (i.e., exchangeable
cations) as a function of milling time. Full and broken lines are respectively for dry and wet-milled rocks. The % extractable element (y axes) is calculated relative to total of this element in rock dust for each milling time and condition (Appendix A1).
The percentage of extractable (Fe + Al + Si) in 0.2M ammonium
oxalate-oxalic acid for basalt (◊), dolerite (□), gneiss (∆), and
K-feldspar (○) milled under dry (full lines) and wet (broken lines)
condition as a function of milling time. The values for y axes was not corrected with Fe contaminant from steel vial and ball mill, thus the y values may be slightly overestimate, especially for milled gneiss, if most of the metallic Fe contaminants are extractable in this extractant.
XRD patterns of silicate rocks milled for 120 min with and without additives. The XRD patterns of initially milled rocks are presented for comparison.
Median particle size (D50) and surface area of basalt, dolerite, and gneiss milled with additives (NaCl, KCl, or K-feldspar) for 120 min under dry (DM) and wet (WM) conditions. The values for initial and no additive (T120) rocks are presented for comparison. KF(m) and KF(cal) respectively are measured and the calculated values for mixed silicates (i.e., the average values for basalt or dolerite and K-feldspar milled separately for 120 min as presented in Figure 2.1 and are
combined on a pro rota basis).
Percentages exchangeable (Ca + Mg) and oxalate-extractable (Fe + Al + Si) of basalt, dolerite, and gneiss milled with additives (NaCl, KCl, or K-feldspar) for 120 min under dry (DM) and wet (WM) conditions. The values for initial and no additive (T120) rocks are presented for comparison. KF(m) are measured values of basalt + K-feldspar powder and dolerite + K-feldspar powder. KF(cal) is average values
3.1.
for basalt or dolerite and K-feldspar milled separately for 120 min and
are combined on a pro rota. KF(cal) of exchangeable (Ca + Mg)
values are calculated as half of exchangeable (Ca + Mg) for basalt or dolerite (see Figure 2.10), because the quantity of exchangeable (Ca + Mg) for K-feldspar are under detection limit. KF(cal) of oxalate-extractable (Fe + Al + Si) are calculated from the values presented in Figure 2.13, i.e., average of those for basalt or dolerite and K-feldspar.
The quantity of dissolved rock (Et), estimated from the total mole charge of major elements (Ca + Mg + Na + K + Fe + Al + Si) for basalt, dolerite, and gneiss, and (Na + K + Al + Si) for K-feldspar
dissolved in 0.01M acetic-citric acid as % of the total mole charge of
corresponding elements in rock powder, as functions of dissolution time (t). The rocks were milled under dry (full lines) and wet (broken lines) conditions. The lines are statistical fits to Eq. (3.1) for the corresponding data.
Dissolution rate of rock (Rt) at various contact times estimated from the total mole charge of major elements (Ca + Mg + Na + K + Fe + Al + Si) for basalt, dolerite, and gneiss, and (Na + K + Al + Si) for
K-feldspar dissolved in 0.01M acetic-citric acid per day relative to the
total mole charge of corresponding elements in rock. The values of Rt were calculated using Eq. (3.2) for the rocks milled for 0, 10, 60 and 120 min (T0, T10, T60, and T120) under dry (D) and wet (W) conditions.
pH of solution after dissolution of silicate rock powders for 1 hour, 7, and 56 days (1h, 7d, and 56d) as affected by milling time of the rocks. The pH of solution before dissolution was 2.50.
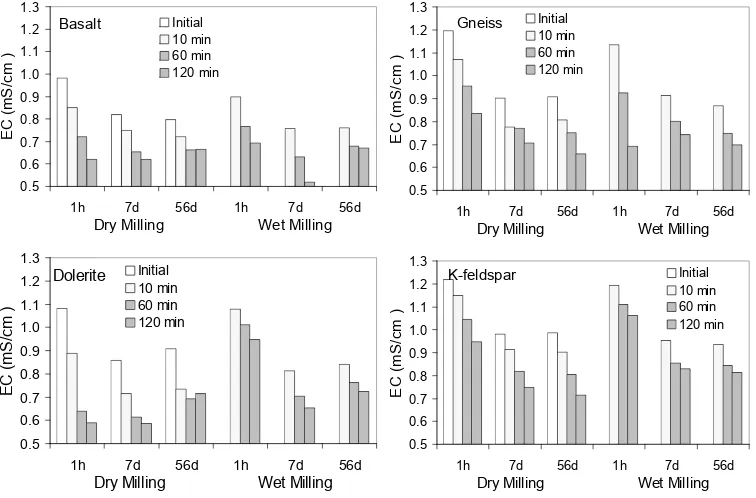
EC of solution after dissolution of silicate rock powders for 1 hour, 7, and 56 days (1h, 7d, and 56d) as affected by milling time of the rocks. The EC of solvent before dissolution was 1.3 mS/cm.
Congruency ratios (CR(Ca), CR(Mg), and CR(Al)) for basalt and dolerite powders as functions of dissolution time. The values of CR were calculated using Eq. (3.3).
Congruency ratios (CR(Na), CR(K), and CR(Al)) for gneiss and K-feldspar powders as functions of dissolution time. The values of CR were calculated using Eq. (3.3).
XRD patterns of basalt and dolerite milled for 0 (T0), 10 (T10), 60 (T60), and 20 (T120) minutes under dry and wet conditions, samples
before (B) and after (A) dissolution in 0.01M acetic-citric acid for 56
3.8.
XRD patterns of gneiss and K-feldspar milled for 0 (T0), 10 (T10), 60 (T60), and 120 (T120) minutes under dry and wet conditions, samples
before (B) and after (A) dissolution in 0.01M acetic-citric acid for 56
days.
XRD patterns of dry-milled basalt, dolerite, gneiss, and K-feldspar for 120 min (T120), samples before dissolution, after acid dissolution and after oxalate extractions.
The percentages of (Fe + Al + Si) dissolved in 0.01M acetic-citric acid
during 56d dissolution and those for in 0.2Moxalate acid extraction (4
h) of rocks dry milled for 120 min.
The quantities of amorphous Fe, Al, and Si (i.e., extractable in 0.2M
ammonium oxalate buffered at pH 3) for the rock powders before dissolution and for the residual rocks after 56d dissolution in acetic-citric acid.
Transmission electron micrographs of particles of dry-milled basalt (T120) before partial acid dissolution (B1 and B2) showing extensive volumes of amorphous materials that do not provide lattice images together with crystalline and amorphous materials in small volume of material.
Transmission electron micrographs of a particle of dry-milled basalt (T120) after partial acid dissolution (A). Crystalline (lattice fringes present) and amorphous materials are present within the same particle.
Transmission electron micrographs of particles of dry-milled gneiss T120 before partial acid dissolution (G1 and G2). Most parts of these particles are amorphous.
Transmission electron micrographs of several particles of dry-milled gneiss T120 after partial acid dissolution (G3 and G4). Some edges of particle G3 were amorphous, whereas in the middle parts (dark colored) were crystalline (C). All parts of particle G4 were amorphous.
Examples of electron diffraction images for crystalline and amorphous materials for particles of dry-milled basalt and gneiss. The crystalline materials generate weak-broad diffraction spots.
Mean quantities of Ca and Mg dissolved from 10 mixtures of soil + basalt SRF and soil + dolerite SRF minus those for untreated soil after 0, 2, and 10 month incubations (E0, E2M, and E10M), as functions of milling time. The values for y axes are calculated as % of CH3COONH4-extractable cations for soil-rock powder mixture minus for control soil relative to total of these cations in the rock powder (see Appendix A1). The error bars are for standard deviation of mean.
4.2.
Mean quantities of Na and K dissolved from 10 mixtures of soil + gneiss SRF and soil + K-feldspar SRF minus those for untreated soil after 0, 2, and 10 month incubations(E0, E2M, and E10M), as functions of milling time. The values for y axes are calculated as % of CH3COONH4-extractable cations for soil-SRF mixture minus for control soil relative to total of these cations in the rock powder (see Appendix A1). The error bars are for standard deviation of mean.
Mean increase of pH (pHtreated soil – pHcontrol soil) of 10 soils receiving SRFs milled for 0 (initial), 10, 60, and 120 min and incubated for 2 and 10 months (2M and 10M). Sd is the standard deviation of mean.
Mean increase of EC (ECtreated soil – ECcontrol soil) of 10 soils receiving SRFs milled for 0 (initial), 10, 60, and 120 min and incubated for 2 and 10 months (2M and 10M). Sd is the standard deviation of mean.
The relationships between mean values of the increases of pH and EC and the mean increase of exchangeable base cations (EAC) for 10 soils
mixed with basalt (■), dolerite (□), gneiss (▲), and K-feldspar (∆)
SRFs milled for 0 (initial), 10, 60, and 120 min under dry condition.
The relationships between mean quantities of alkali elements from silicate rocks dissolved in 23 soils after incubation for 2 months (E2M)
and quantities dissolved in 0.01M acetic-citric acid for 1 hour, 1 day
and 56 days (E1H, E1D, and E56D), designated respectively with r values
for regression lines calculated from data points of ○, ∆ and □
respectively.
Effects of the application of Ca as CaCl2, basalt SRF, and dolerite SRF on cumulative yield (oven-dried plant tops) and cumulative Ca uptake
for the 1st, 2nd, 3rd, and 4thharvests (H1, H2, H3, and H4) of ryegrass
grown on soil WP-6. For the reference treatment (+CaCl2) the amount of dry tops for H1 was too small for elemental analysis, and plants for the +40 mg Ca treatment died after H3, so that Ca uptake data for those treatments are not available. Error bars are the standard error of mean.
Effects of the application of Ca as CaCl2, basalt SRF, and dolerite SRF on cumulative yield (oven-dried plant tops) and cumulative Ca uptake
for the 1st, 2nd, 3rd, and 4thharvests (H1, H2, H3, and H4) of ryegrass
grown on soil MR-5. Error bars are the standard error of mean.
Effects of the application of Mg as MgSO4, basalt SRF, and dolerite SRF on cumulative yield (oven-dried plant tops) and cumulative Mg
uptake for the 1st, 2nd, 3rd, and 4th harvests (H1, H2, H3, and H4) of
ryegrass grown on soil WP-6. Most plants for this treatment died.
5.4.
Effects of the application of Mg in forms of (a) MgSO4, (b) basalt SRF, and (c) dolerite SRF on cumulative yield (oven-dried plant tops)
and cumulative Mg uptake for the 1st, 2nd, 3rd, and 4th harvests (H1,
H2, H3, and H4) for ryegrass grown on soil MR-5. Error bars are the standard error of mean.
Effects of the application of K as K2SO4, gneiss SRF, and K-feldspar SRF on cumulative yield (oven-dried plant tops) and cumulative K
uptake for the 1st, 2nd, 3rd, and 4th harvests (H1, H2, H3, and H4) of
ryegrass grown on soil BSN-1. The broken lines are drawn from best fit equations (Table 5.5) describing relationships between application rates of K fertilizers and cumulative K uptake. These lines were used to calculate the relative agronomic effectiveness (RAE) of SRFs (section 5.3.2). Error bars are the standard error of mean.
Effects of the application of K as K2SO4, gneiss SRF, and K-feldspar SRF on cumulative yield (oven-dried plant tops) and cumulative K
uptake for the 1st, 2nd, 3rd, and 4th harvests (H1, H2, H3, and H4) of
ryegrass grown on soil SCP-11. The broken lines are drawn from best fit equations (Table 5.5) describing relationships between application rate of K fertilizers and cumulative K uptake. These lines were used to calculate the relative agronomic effectiveness (RAE) of SRFs (section 5.3.2). Error bars are the standard error of mean.
Plots of yield versus Ca uptake for each harvest (H1 – H4) of plants grown on soil WP-6 receiving Ca fertilizers (Ca experiment). The
plots for nil Ca and +CaCl2was not presented due to insufficient data
(most plants for the nil Ca and +CaCl2 treatments dead).
Plots of yield versus K uptake of each harvest (H1 – H4) for plants grown on soil BSN-1 receiving K fertilizers.
Plots of yield versus K uptake of each harvest (H1 – H4) for plants grown on soil SCP-11 receiving K fertilizers.
The amount of CH3COONH4-extractable Ca, pH and EC of soils
WP-6 and MR-5 after the 4th harvest as affected by application rate of Ca
fertilizers.
The amount of CH3COONH4-extractable Mg, pH and EC of soils
WP-6 and MR-5 after the 4thharvest as affected by application rate of Mg
fertilizers.
The amount of CH3COONH4-extractable K, pH and EC of soils
BSN-1 and SCP-BSN-1BSN-1 after the 4thharvest as affected by application rate of K
5.13. The percentages of dissolved Ca and K from SRFs in the soil for glasshouse experiment of 12 months. Detailed calculation to provide
LIST OF APPENDICES
Total elemental composition of milled-silicate rocks determined
using XRF1.
The quantities of dissolved elements from milled-basalt dust in
0.01M acetic-citric acid
The quantities of dissolved elements from milled-dolerite dust in
0.01M acetic-citric acid
The quantities of dissolved elements from milled-gneiss dust in
0.01M acetic-citric acid
The quantities of dissolved elements from milled-K-feldspar dust in
0.01M acetic-citric acid.
Congruency ratio (CR) for dissolution of milled basalt in 0.01M
acetic-citric acid, calculated using Eq. (3.3).
Congruency ratio (CR) for dissolution of milled dolerite in 0.01M
acetic-citric acid, calculated using Eq. (3.3).
Congruency ratio (CR) for dissolution of milled gneiss in 0.01M
acetic-citric acid, calculated using Eq. (3.3).
Congruency ratio (CR) for dissolution of milled K-feldspar in 0.01M
acetic- citric acid, calculated using Eq. (3.3).
The percentage of dissolved (Ca + Mg)1 from basalt and dolerite
SRFs in soils after incubation for the first hour (rapidly dissolved), 2
and 10 months (designed as E0, E2M, and E10M respectively), which
were calculated as CH3COONH4-extractable (Ca + Mg) for soil-SRF mixture minus that for control soil (nil SRF), relative to total of (Ca + Mg) in 1 g SRF added.
The percentage of dissolved (K + Na)1 from gneiss and K-feldspar
SRFs in soils after incubation for the first hour (rapidly dissolved), 2
and 10 months (designed as E0, E2M, and E10M respectively), which
were calculated as CH3COONH4-extractable (K + Na) for soil-SRF mixture minus that for control soil (nil SRF), relative to total of (K + Na) in 1 g SRF added.
B2.
Results of analysis of variance for the effects of the application rate of fertilizers on concentration of plant nutrients in dried tops of ryegrass for each harvest (H1 – H4).
Mean concentrations of Na, Cu, Zn, Mn, Fe, and Si in oven-dried tops of ryegrass grown on soil WP-6, as a function of the application rate of Ca fertilizers. Plants for the control, +10 and +20 (H4) mg Ca/kg as CaCl2 died, the amounts of dry shoot (H1-H2) for the
treatments of +20 and +40 mg Ca/kg as CaCl2 were too small for
elemental analysis (data for nutrient concentrations for these treatment are not available). The broken lines are for critical values
for deficient levels in ryegrass (Pinkerton et al., 1997) but are
probably higher than applies to the cultivar used in this research which is highly efficient in utilizing nutrients.
Mean concentrations of Ca, Mg, K, P, S, and Cl in oven-dried of ryegrass grown on soil WP-6, as a function of the application rate of Ca fertilizers. Plants for the control, +10 and +20 (H4) mg Ca/kg as CaCl2 died, the amounts of dry shoot (H1-H2) for the treatments of
+20 and +40 mg Ca/kg as CaCl2 were too small for elemental
analysis (data for nutrient concentration for these treatments are not available). The broken lines are for critical values for deficient levels
(Pinkerton et al., 1997) but are probably higher than applies to the
cultivar used in this research which is highly efficient in utilizing nutrients.
Mean concentrations of Na, Cu, Zn, Mn, Fe, and Si in oven-dried tops of ryegrass grown on soil MR-5, as a function of the application rate of Ca fertilizers. The broken lines are for ritical values for
deficient levels (Pinkerton et al., 1997). but are probably higher than
applies to the cultivar used in this research which is highly efficient in utilizing nutrients.
Mean concentrations of Ca, Mg, K, P, S, and Cl in oven-dried tops of ryegrass grown on soil MR-5, as a function of the application rate of Ca fertilizers. The broken lines are for critical values for deficient
levels (Pinkerton et al., 1997) but are probably higher than applies to
the cultivar used in this research which is highly efficient in utilizing nutrients.
Mean concentrations of Na, Cu, Zn, Mn, Fe, and Si in oven-dried tops of ryegrass grown on soil MR-5, as a function of the application rate of Mg fertilizers. The broken lines are for critical values for
deficient levels (Pinkerton et al., 1997) but are probably higher than
applies to the cultivar used in this research which is highly efficient in utilizing nutrients.
B8.
B9.
B10.
B11.
B12.
B13.
Mean concentrations of Ca, Mg, K, P, S, and Cl in oven-dried tops of ryegrass grown on soil MR-5, as a function of the application rate of Mg fertilizers. The broken lines are for critical values for deficient
levels (Pinkerton et al., 1997) but are probably higher than applies to
the cultivar used in this research which is highly efficient in utilizing nutrients.
Mean concentrations of Na, Cu, Zn, Mn, Fe, and Si in oven-dried tops of ryegrass grown on soil BSN-1, as a function of the application rate of K fertilizers. The broken lines are for critical
values for deficient levels (Pinkerton et al., 1997) but are probably
higher than applies to the cultivar used in this research which is highly efficient in utilizing nutrients.
Mean concentrations of Ca, Mg, K, P, S, and Cl in oven-dried tops of ryegrass grown on soil BSN-1, as a function of the rate of K fertilizers. The broken lines are for critical values for deficient levels
(Pinkerton et al., 1997) but are probably higher than applies to the
cultivar used in this research which is highly efficient in utilizing nutrients.
Mean concentrations of Na, Cu, Zn, Mn, Fe, and Si in oven-dried tops of ryegrass grown on soil SCP-11, as a function of the rate of K fertilizers. The broken and full lines are for critical values for
deficient toxic levels, respectively (Pinkerton et al., 1997) but are
probably higher than applies to the cultivar used in this research which is highly efficient in utilizing nutrients, and the full lines are
for toxic levels in ryegrass (Pinkerton et al., 1997).
Mean concentrations of Ca, Mg, K, P, S, and Cl in oven-dried tops of ryegrass grown on soil SCP-11, as a function of the application rate of K fertilizers. The broken lines are for critical values for
deficient levels (Pinkerton et al., 1997) but are probably higher than
applies to the cultivar used in this research which is highly efficient in utilizing nutrients.
Calculation for dissolution of nutrient from SRFs in the soil for Ca experiment on soil WP-6 and K experiment on soils BSN-1 and SCP-11.
143
144
145
146
147
Chapter 1
INTRODUCTION
1.1. General Background
The possibility of using silicate rocks as fertilizers has received significant
attention from agronomists and soil scientists during the last two decades. Although
some advantages over chemical fertilizers may be proposed (Leonardos et al. 1987 and 2000; Coroneos et al. 1996; Hinsinger et al. 1996; Bolland and Baker 2000; Coventry et al. 2001), the present day use of silicate rock fertilizers (SRFs) in agricultural practices is very limited mostly due to uncertainty about the true
effectiveness of SRFs. Despite conflicting experimental agronomic results, the
generally very small and slow release of nutrients from SRFs into soil solution is the
main limiting factor (Hinsinger et al. 1996). Efforts should, therefore, be made to identify appropriate methods for accelerating the release of nutrients, as well as to
identify those factors determining the suitability of particular soils and plants for
fertilization with SRFs.
Silicate rocks may contain several elements essential for plants, and so may
be used as multinutrient fertilizers as suggested by Leonardos et al. (1987, 2000)
and Coventry et al. (2001). Global resources of some conventional sources of
fertilizer feedstocks (e.g., KCl) are limited so that identification of alternative
sources will enable optimum use of resources. For many developing countries that
spend scarce dollars to import chemical fertilizers, locally produced SRF may be an
appropriate material for their farming systems. From an environmental point of
view, applying SRF is non-polluting due to the slow release of nutrients to soil
solution such that water pollution resulting from leaching or erosion of SRF from
agricultural land will be minimal. Furthermore, some SRFs do not contain elevated
levels of contaminants such as Cd, F, and U that occur in some chemical fertilizers
and thus provide a more sustainable source of plant nutrients. The use of SRFs in
broad scale agriculture has been proposed for the utilization of quarry by-products in
Western Australia (Coroneos et al. 1996; Hinsinger et al. 1996; Bolland and Baker
the utilization of mine tailing (Bakken et al. 1997, 2001). These materials have been evaluated in plant growth experiments.
Evaluations of the effectiveness of SRFs have produced conflicting results.
Applications of silicate rocks, including basalt (de Villiers 1961; Gillman 1980;
Barak et al. 1983; Priyono 1991; Gillman et al. 2001, 2002; Coventry et al. 2001) and gneiss (Wang et al. 2000a, 2000b), granite (Coroneos et al. 1996, Hinsinger et al. 1996), fly ask (Pathan et al. 2003) or silicate minerals such as felspars (Sanz Scovino and Rowell 1988), hornblende, microcline, and biotite (Harley 2002) or
micas (Weerasuriya et al. 1993) positively affected soil properties and stimulated plant growth. On the other hand, granite quarry dust provided minor amount of
soluble K and reduced wheat yield by up to 65 % (Bolland and Baker 2000) relative
to standard fertilizers. These different results may be due to the large diversity of
rocks, grinding methods, plant species, and soils used in these experiments. Most
authors agree that the major limiting factor for the use of SRFs in agriculture is the
very slow release of nutrients from the SRFs so that consequently very large rates of
SRFs should be applied (Hinsinger et al. 1996).
Mafic rocks which are dominated by ferromagnesian minerals contain higher
concentrations of several essential plant nutrients (e.g., Fe, Mg, Ca, and Mn) than do
felsic rocks (Krauskopt 1972; Aubert and Pinta 1977; Harley and Gilkes 2000), and
consequently mafic rocks may be more suitable fertilizers than are felsic rocks.
However, the selection of rock type will depend on the specific nutrient deficiencies
of the soil (Coroneos et al. 1996; Hinsinger et al. 1996; Bolland and Baker 2000). Ground feldspar (Sanz Scovino and Rowell 1988), mica (Weerasuriya et al. 1993),
and gneiss (Wang et al. 2000a) may be much more suitable sources of K than are mafic rocks that contain little K. Soil properties, including texture (Priyono 1991),
pH (Holdren and Berner 1979), water content and organic matter content (Oliva et al. 1999), may also determine the effectiveness of SRFs. Similarly the different
external nutrient requirement of different plant species is likely to affect the
agronomic effectiveness of SRFs.
In comparison to the little amount of literature dealing with the potential use
of silicate rocks in agriculture, there is an extensive literature on the dissolution of
silicate minerals, although not so much the dissolution of silicate rocks. The extent
(Feigenbaum et al. 1981; Strömberg and Banwart 1999). Particle size was shown to greatly determine the effects of basalt dust on soil properties (Gillman et al. 2001, 2002). Milling methods that produce superfine particles of minerals with enhanced
chemical reactivity have been evaluated for industrial uses by several workers,
including Garcia et al. (1991), Sugiyama et al. (1994), and Suraj et al. (1997). These milling methods also have been employed to improve the fertilizer effectiveness of
several silicate minerals (Harley 2002) and phosphate minerals (Lim et al. 2003). Further evaluation of high-energy milling as a method for manufacturing SRFs,
including the use of reactive additives to enhance fertilizer effectiveness, is proposed
and has been evaluated in this thesis. In addition, soil properties that affect the
dissolution of SRFs in the soil were identified. These properties may be appropriate
indicators for soil testing to evaluate the potential for use of SRFs for specific soils
and plant species.
1.2. The Objectives of Research
The main hypotheses of this research are that (1) high-energy milling affects
several physicochemical properties of silicate rocks and increases the release of
plant nutrient elements from SRFs and (2) soil properties affect the dissolution of
SRF in the soil. To evaluate these hypotheses, several experiments were carried out
with the following main objectives.
1. To identify the effects of the condition and duration of high-energy milling of
silicate rocks variously combined with reactive additives on the
physicochemical properties of mafic (basalt and dolerite) and K-rich felsic
(gneiss and K-feldspar) rocks.
2. To identify the dissolution characteristics of the milled rocks in a dilute organic
acid to provide a simple method for predicting dissolution of the milled rocks in
soils.
3. To identify soil properties that influence the dissolution of SRFs in soils.
4. To measure the agronomic effectiveness of ground mafic (basalt and dolerite)
1.3. Organisation of the Thesis
Following the above objectives, the main content of this thesis is divided into
6 chapters including this chapter. Chapter 2 describes the milling methods used in
this research and the physicochemical characteristics of the milled rocks.
Dissolution of the milled rocks in a dilute organic acid is described in Chapter 3, and
dissolution in soil is discussed in Chapter 4. Chapter 5 describes a glasshouse
experiment that measured the agronomic effectiveness of milled mafic and felsic
rocks as fertilizers. A summary of research findings, their limitations and
recommendations for future research are provided in Chapter 6, followed by the lists
of references and appendices. Tables and figures are placed within the
Chapter 2
EFFECTS OF MILLING TIME, CONDITIONS, AND REACTIVE
ADDITIVES ON THE CHARACTERISTICS OF SILICATE ROCKS
2.1. Introduction
An effective method to accelerate the release of nutrients from SRFs to soil
solution is high-energy milling that produces superfine reactive particles. Many
workers (Gasalla et al. 1987; Kühnel and Van der Gaast, 1989; Garcia et al. 1991; Sugiyama et al. 1994; Aglietti 1994; Suraj et al. 1997; Uhlík et al. 2000) have reported that high-energy milling has major effects on several physicochemical
properties of minerals and rocks. High-energy milling may destroy the structural
order of minerals and increase the effective surface area, both effects will increase
the reactivity of minerals. For example, Aglietti (1994) showed that dry milling of
talc increased CEC and the amount of Mg dissolved in water. High-energy milling
accelerated nutrient release from several silicate minerals (Harley 2002) and rock
phosphates (Lim et al. 2003) in the soil. Too intensive milling, however, may cause agglomeration or sintering of fine particles resulting in a decrease of the effective
surface area. Agglomeration is due to a number of processes including exposed
hydrogen ion bonding of surface hydroxyl groups on the fine particles,
agglomeration may be avoided by immersing the material in a polar liquid during
milling (Veale 1972), e.g., wet milling in H2O (Reay 1981; Harley 2002) or in
hydrocarbons including alcohol (Papirer and Roland 1981). The addition of
potentially reactive additives, such as NaCl and KCl, to eliminate agglomeration and
to supply additional plant nutrients may be beneficial has not been investigated for
silicate rocks. This chapter describes the results of investigations of the effects of
milling methods including milling time and condition and the use of NaCl and KCl
additives on several physicochemical characteristics of mafic (basalt and dolerite)
and felsic (gneiss and K-feldspar) rocks.
The specific objectives of the research described in this chapter are to
identify (1) the effects of milling time and condition (wet and dry) and (2) the
effects of adding NaCl, KCl, and K-feldspar during the milling process on several
2.2. Materials and Methods
2.2.1. Samples of Silicate Rock
The silicate rocks used in this research were (meta) basalt, (meta) dolerite,
gneiss, and K-feldspar, respectively from Bunbury, Jarrahdale, Northam, and Port
Hedland, Western Australia. The bulk samples of the first three rocks were washed
with deionized water, air dried, and broken with a hammer to about 1-cm diameter,
ground with a steel Tema ring mill for 3 min at 760 rpm, and sieved to pass a 250µm sieve. K-feldspar (Ø < 150 µm) was supplied by Commercial Mineral Ltd. Perth,
Western Australia, which material commercially used in ceramic bodies and glazes,
and as an abrasive powder, consisting of microcline (65.6 %), albite (31.2 %),
anorthite (0.6 %), kaolinite (< 1.0 %) and free quartz (< 1.0 %) (Commercial
Minreral Ltd., 1997). These materials are designated as initially milled rock (T0).
2.2.2 Milling Procedures
The initially milled rocks (5 g) were further milled with a ball mill
(Spex-8000) using a 80cm3 steel vial and 50 g of ∅ 5mm steel balls for 10, 30, 60, 90, and 120 min. In the following discussion, milling times will be denoted as T0, T10, T30,
T60, T90, and T120. For wet milling, 15 mL H2O was added to the samples prior to
milling. Other subsamples of initially milled basalt, dolerite, and gneiss, respectively
were added to reagent grade NaCl or KCl (4.5 g rock + 0.5 g NaCl or KCl) and
milled for 120 min under dry and wet conditions. Basalt and dolerite T0 were also
mixed with K-feldspar at a ratio of 1 : 1 and milled for 120 min under dry and wet
conditions. The adhered rock powders on the mill vial were scratched with a
stainless steel spatula, and for those on mill balls were removed by hand shaking the
balls using stainless steel screen. All of these powders were transferred to plastic
containers for storage. The wet-milled samples were removed from the mill vial and
ball surfaces using a DI-spray bottle, and were transferred to plastic bottles through
plastic panels equipped with a stainless steel screen. The suspensions of the
wet-milled rocks were centrifuged for 10 min at 11,000 rpm using Eppendorf 5810
Centrifuge (maximum capacity of 4 x 1.1 kg and speed 12,000 rpm), the supernatant
was discharged and the powders were oven dried at 60o C for 48 h and placed in
2.2.3 Analytical Methods
Identification for physicochemical properties of the milled rocks was carried
out in their original condition (without any pre-treatment) as that might be used in
practices. However, an exception was made for the measurement of particle size by
using Malvern Mastersizer that the rock powders were ultrasonically dispersed prior
to measurement. This treatment was applied due to concern to the possibility of
scratching on the detection lens of the instrument by coarse (agglomerated) particles
being measured. Care should be taken, therefore, in interpreting the results of this
measurement as such pre-treatment to the samples may result underestimate values
of particle size relative to those for the untreated SRFs.
The concentrations of major elements in the initially milled (T0) and milled
(T10 – T120) silicate rocks were determined by XRF (Philips PW 1400) after fusing
the samples with lithium metaborate (Karathanasis and Hajek 1996). The
determination of Fe was done in spite of the potential risk for sample contamination
due to the use of Fe-steel ball mill, and hence of overestimation of the actual
dissolution rate.
An extracting solution of 1M ammonium acetate (CH3COONH4) buffered at
pH 7.0 was used to measure the quantities of exchangeable basic cations (Ca, Mg,
K, and Na) in the milled rocks. A subsample (250 mg) of rock powder each was
added to 20 mL extracting solution in a 30mL plastic container, and then shaken for
1 h on an end-over end shaker. This step was repeated three times for the same
sample and the filtrates from each extraction were combined. The concentrations of
Ca and Mg in the filtrates were measured using Atomic Absorbance
Spectrophotometry (AAS), K and Na were measured using flame emission. The
lanthanum solution (LaCl3) was added to suppress interferences for Ca
determination, and Cs solution was added to overcome ionization interference for K
determination. The quantity of each exchangeable cation was calculated in units of
centimole charge per kg rock dust (cmolc/kg) and % of total in rock (i.e., the amount
of each exchangeable element relative to the total content of the element in rock
powder for each milling time and condition).
The quantity of amorphous constituents was determined as (Fe + Al + Si)
soluble in 0.2M ammonium oxalate-oxalic acid buffered at pH 3.0 using the
and Al in the filtrate were measured using AAS and Si was determined using the
molybdate blue method (Strickland and Parsons 1968). In addition, the
concentrations of Mg and K in the filtrates for milled basalt, dolerite, and gneiss,
and K and Na in the filtrate for milled K-feldspar were measured using AAS (for
Mg) and flame emission (for Na and K). The concentration of Ca in the filtrate was
not measured due to the present of white precipitate in the filtrate when lanthanum
solution was added as a suppressing agent for measurement of Ca with AAS. Further
identification of the precipitate was not carried out. It was presumed that the
precipitate might be La-oxalate complex as such precipitate only present when La
solution was added to oxalate filtrates, but there was no precipitate caused by adding
La to the other filtrates (e.g., filtrates of ammonium acetate, acetic-citric acids, and
CH3COONH4 extractions). The pHH2O (1 : 5) and electric conductivity (1 : 5) of
water extracts of the milled rocks were measured with pH (Cyberscan 2000) and EC
(Cyberscan 2000) meters.
The particle size distribution of rock powders was measured in duplicate by
using a Malvern Mastersizer (the lowest detection limit is Ø 0.02 µm). The sample
was ultrasonically dispersed in water for 5 min prior to measurement and stirred
continuously during measurement. Specific surface area of duplicate samples
(without dispersion) was measured by the BET-N2 method (Brunauer et al. 1938)
using a Micromeritics Gemini III 2385 Surface Area Analyser. Before measurement
of specific surface area, subsamples of the rocks that had been dry-milled with NaCl
and KCl were washed with deionized water twice to dissolve free NaCl and KCl that
may have remained in the rock powders. Mineralogical characteristics of rock
powders were derived through analysis of XRD patterns by applying a X-ray
Powder Diffraction Analysis Software (XPAS) V.3.0 described by Singh and Gilkes
(1992). The XRD patterns were collected with a Philips PW-3020 diffractometer
using monochromatised Cu Kα radiation, generated at 50 kV and 20 mA. The
2.3. Results and Discussion
2.3.1. General Characteristics of Silicate Rocks
The total elemental and mineral compositions of the silicate rocks (T0) are
presented in Table 2.1. The total content of elements for each rock milled for
different time and condition is presented in Appendix A1, which values are used as
the basis for calculating the proportion of extractable or dissolved elements (i.e., %
of total in rock) throughout the thesis.
Table 2.1. Total elemental and mineral compositions of the silicate rocks at their initial condition (T0)
Elementa (oxides) %
Mineral Compositiond
: Mg-Hornblende (5 - 6), Pargasite (5 - 6), Augite (5 - 6), Albite (6 - 6.5), Anorthite (6 - 6.5), Biotite (2.5 - 3), Phlogopite (2 - 2.5)
: Mg-Hornblende, Pargasite, Augite, Albite, Anorthite, Biotite, Diopside (5.5 – 6.5)
: Quartz (7), Albite, Biotite, Chlorite (2 – 3) : Microcline (6 – 6.5), Albite, Anorthite
a
Average values of 4 replicates.
b
Total iron is expressed as Fe2O3, much Fe is present as Fe+2. c
Normalized to total of 100 % to exclude structural H2O. d
Duplicate measurements, and minerals listed in order of decreasing abundance, followed by relative hardness numbers (Deer et al. 1992).
As shown in Table 2.1, mafic (basalt and dolerite) and felsic (gneiss and
K-feldspar) rocks have quite different elemental and mineral compositions and contain
minerals of various relative hardness values. These differences may relate to their
suitability for use as fertilizers and their responses to milling treatments.
The mafic rocks have similar elemental and mineral compositions, which are
dominated by ferromagnesian silicates (hornblende, pargasite, and augite) of the
amphibole group. The total contents of silica are 47 - 50 % SiO2 and alumina are 14
amounts Ca (11 % CaO) and Mg (6 % MgO). The hardness of most minerals present
in the mafic rocks is 5 – 6.
The felsic rocks have different elemental and mineralogical compositions to
the mafic rocks. Gneiss is dominated by quartz with some feldspars and micas,
whereas the K-feldspar is reported by Commercial Minerals Ltd. (1997) to consist of
microcline (65.6 %), albite (31.2 %), and anorthite (0.6 %) with minor kaolinite and
free quartz. Both felsic rocks contain high concentrations of silica (61 - 75 % SiO2)
and alumina (15 – 19 % Al2O3), the major plant nutrients are K and Na. The
concentration of K in K-feldspar (11.5 % K2O) is much larger than that for gneiss
(1 % K2O), conversely the concentration of Na in K-feldspar (2.5 % Na2O) is lower
than that in gneiss (4 % Na2O). Appreciable amount of Ca and Mg occur in minor
mafic minerals in gneiss. The relative hardness of most minerals composing these
felsic rocks is 6 – 6.5.
Based on their major plant nutrient contents, the mafic rocks could be
potential sources of Ca and Mg, and the felsic rocks potential sources of K providing
that these elements are released to soil solution. An evaluation of these milled SRFs
is needed to identify the solubility of nutrient elements in soils.
2.3.2. Effects of Milling Time and Condition
2.3.2.1. Physical and Mineralogical Properties
Particle Size and Surface Area
Plots of volume median particle size (D50) and surface area versus milling
time are presented in Figure 2.1. Although each type of rock exhibits different
responses to milling treatments as indicated by the changes in particle size and
surface area, some general trends may be summarized as follows:
1. Milling clearly reduced particle size for all silicate rock dusts used in this study.
The most significant effect of milling occurred for 10 min of milling which
reduced particle size to 2 – 3 µm for dry milling and 5 – 10 µm for wet milling.
2. The changes in surface area due to milling did not always systematically follow
the changes of particle size measured with the Malvern Mastersizer, especially
for dry-milled basalt. This condition was due partly to difference in sample
Figure 2.1. Median particle size (D50, full lines) and specific surface area (SA, broken
lines) for dry- (∆) and wet- (□) milled rocks as a function of milling time.
dispersed, but those for surface area measurement were not). Moreover, the
BET-N2 method may measure the area of both external and internal (porosity)
surfaces of rock particles (Hodson 1999).
Dry milling for 10 min caused the powder to adhere strongly to the grinding
vial with this effect increasing with increasing milling time. In this condition, only a
small proportion of rock particles were impacted by the steel balls so that dry
milling for more than 10 min was ineffective in further reducing particle size.
Moreover, the process may also promote agglomeration in the form of larger
particles as was observed with the Malvern Mastersizer. For wet milling, on the
other hand, only a minor proportion of the powder adhered to the grinding vial, so
that agglomeration was unlikely to have occurred in this condition and the powder
was easily removed from the vial.
As shown in Figure 2.1, basalt powder has a high surface area (16.2 m2/g) in
sampled from the exposure of rock blocks of Ø 0.25 – 0.50 m on which weathering
may have occurred for centuries. Thus, this microporosity of basalt, at least partly, is
as a consequence of natural alteration and it is possible also gas vesicles in the glass
component of basalt. Regardless the characteristics of this microporosity for basalt,
the reduction in surface area of dry-milled basalt might not be solely due to
agglomeration, but also to the collapse of initial pores as extensive agglomeration
was unlikely to occur during wet milling of basalt. The overall result of these
opposing mechanisms was the relatively constant surface area of wet-milled basalt.
For dolerite dust, dry milling for 10 min decreased particle size about 7 fold
(i.e., from 14.5 to 2.2 µm) and increased surface area about 4 fold (i.e., from 1.4 to
5.5 m2/g). However, further milling increased particle size to about 6 µm (for T90),
indicating that agglomeration occurred for dolerite powder when it was dry milled
for 10 – 90 min which caused a slight decrease of surface area, then increase to
about 8 m2/g for T120. Wet milling for 10 min reduced particle size about 3 fold and
it remained constant for further milling although surface area continuously increased
about 3 fold, i.e., from 2 (T0) to 7 (T120) m2/g.
For gneiss dust, dry and wet milling for 10 min decreased particle size about
10 fold, i.e., from 35 to 3 µm (dry milling) and to 4 µm (wet milling), and increased
surface area by about 5 fold, i.e., from 1.3 to 6.2 m2/g. Further milling under the dry
condition had no effect on the surface area of gneiss dust, while further milling
under the wet condition increased the surface area of gneiss dust to 43 m2/g (T120)
although there was no corresponding reduction in particle size.
Dry milling increased the surface area of K-feldspar dust by about 23 fold
over its initial state, i.e., from 0.5 m2/g (T0) to 11.8 m2/g (T120). Wet milling for 10
min increased surface area about 14 fold (from 0.5 to 6.8 m2/g). Further milling for
120 min increased surface area to about 9 m2/g. The particle size of wet milled
K-feldspar was reduced to about 5.5 µm for 60 and 120 min of milling while the
particle size of dry milled K-feldspar dust showed a complex behaviour that may
reflect agglomeration of particles for the longest milling time.
Agglomeration of dry-milled silicate minerals has been reported for α
-spodumene (Gasalla et al. 1987), kaolins (Juhász 1980; Garcia et al. 1991), talc (Aglietti 1994), and antigorite (Drief and Neito 1999). These authors reported that
depending on milling procedure and mineral species, and that agglomeration either
decreased surface area (Garcia et al. 1991; Sánchez-Soto et al. 1997) or increased
surface area (Gasalla et al. 1987). These conflicting results may be due to
differences in the minerals, grinding methods, and procedures for measuring surface
area but the same apparently conflicting trends were observed in the present work
using standard procedures for grinding and measurement.
The absence of agglomeration for several silicate minerals wet milled in H2O
was reported by Reay (1981) and Harley (2002), and for milling in hydrocarbons by
Papirer and Roland (1981). According to Veale (1972), immersing particles in a
polar liquid during milling reduces sintering as water and other polar organic liquids
surround and neutralise positive and negative charges on the newly exposed surfaces
of particles, thereby limiting direct interactions between particles.
Characteristics of XRD Reflections
The XRD patterns of the SRFs are presented in Figures 2.2 – 2.5, results of
measurement for relative peak area (RPA) and width at half peak height (WHPH)
are presented in Figure 2.6.
The silicate rocks consist of mixtures of several minerals (Table 2.1),
consequently their XRD patterns are more complex than for K-feldspar. Many of the
XRD reflections of the minerals present in basalt, dolerite, and gneiss coincide,
consequently, only the limited number of XRD reflections that did not coincide were
available for measurements of RPA and WHPH (Figure 2.6) as indices of crystal
properties using an interactive program of XPAS (Singh and Gilkes 1992).
Peak area is an indicator of the abundance of a mineral and the width of a reflection
is an inverse measure of crystal size or more specifically the size of the coherently
scattering zone (Klug and Alexander 1974). As shown in Figure 2.6, milling
increased WHPH and decreased RPA. These trends indicate that milling reduced
crystal size and also induced structural disorder in the minerals which decreased
total diffracted intensity (i.e., area under peak) as amorphous material does not
diffract coherently but contributes to background scattering. The increased
broadening of XRD reflections indicates a reduction in the crystal size of the
milling on the XRD patterns of rock dusts (see Figures 2.2 – 2.5) occurred during 60
min of milling with the effects for dry milling being greater than for wet milling.
Figure 2.2. XRD patterns of basalt milled for several milling times under dry and wet conditions. P = pyroxene 110 (d = 6.45 Ǻ), A = amphibole 131 (d = 3.89 Ǻ), and F = feldspar 114 (d = 3.47 Ǻ).
Figure 2.4. XRD patterns of gneiss milled for several milling times under dry and wet conditions. C = chlorite 004 (d = 7.0 Ǻ), Q = quartz 101 (d = 3.43 Ǻ), and F = feldspar (albite) 220 (d = 3.17 Ǻ).
Figure 2.7. The relationships between percentages of exchangeable basic cations (Ca + Mg + K + Na) and oxalate-extractable (Fe + Al + Si) versus the percentage of amorphous materials (calculated as averaged [100% - RPA] for several XRD peaks of several minerals) for dry- (□ full lines) and wet- (■broken lines) milled rocks.
Assuming that the XRD peak area after 120 min of milling is a measure of
the abundance of crystalline minerals remaining in the rocks (Klug and Alexander
1974), it appears that non crystalline (amorphous) forms of minerals in the rock
dusts increased from an initial value of zero to about 40 (wet) – 60 % (dry) for
basalt, 30 – 80 % for dolerite, 45 – 85 % for gneiss, and 30– 80 % for K-feldspar
dusts. These major changes in crystal size and structural order (e.g., amorphization)
due to milling are likely to have a major impact on the solubility of ground rocks in
soil solution and thus the effectiveness of ground SRFs. Figure 2.7 indicates that the
quantity of amorphous materials is closely related to the percentages of
CH3COONH4-exchangeable basic cations (Ca + Mg + K + Na) and acid
oxalate-extractable (Fe + Al + Si) in the milled rocks.
2.3.2.2. Chemical Properties
Contamination by Iron
The concentration of total iron expressed as Fe2O3 in the milled rocks increased with
increasing milling time due to contamination by metallic Fe from mill vial and balls,
with wet milling producing greater contamination than dry milling (Figure 2.8). For
milled basalt, dolerite, and K-feldspar, the maximum percentage contamination was
< 2 % Fe2O3 and this is unlikely to be a serious problem in relation to the use of the
milled rocks as fertilizers or for wear of the milling equipment. Contamination of
milled gneiss was much higher (7 – 10 % Fe2O3) which may be a consequence of the
presence of the abrasive mineral quartz (hardness = 7, Table 2.1) in this rock type
and indicates an unacceptable rate of wear of the milling equipment.
pH and EC
The effects of milling time and milling condition on pH and EC of 1 : 5 rock dust :
water extracts are presented in Figure 2.9. Milling increased the pH of most rock
dusts with dry milling having the greater effect. The increase of pH due to milling
for 120 min was in ranges of 1.0 - 1.5 and 0.3 - 1.0 units respectively for dry and
wet milling. Milling also increased the EC of 1 : 5 rock dust : water extracts, except
for basalt dust. The increases of EC due to milling for 120 min were about 120 and
dry- and milled gneiss respectively), 300 and 100 µS/cm (for dry- and
wet-milled K-feldspar respectively).
Figure 2.8. Concentration of iron (expressed as % Fe2O3) versus milling time of
basalt (▲), dolerite (∆), gneiss (■) and K-feldspar (□) milled under dry (full lines) and wet (broken lines) conditions.
The increased surface area of minerals exposes more basic cations to
exchange by H+ in extracting solution and amorphization may reduce bond strengths
thereby increasing surface ion exchanges which will increase dissolution and the pH
and EC of extracts of the milled rocks. For the same milling times, the pH and EC
values for dry-milled rocks were higher than for wet-milled rocks, presumably
because this exchange process occurred during wet milling and the solution
containing dissolved basic cations was discarded. Consequently, values of pH and
EC for wet-milled rocks tended to be lower than for dry milled and in some
instances unmilled rocks (T0).
Solubility of Basic Cations
It is evident that the amounts of exchangeable and extractable elements in the
milled rocks are closely related to the amounts of amorphous silicate present (Figure
2.7) which generally increase with milling time. The plots of quantities of
exchangeable basic cations (Ca, Mg, K, and Na) versus milling time are presented in
Figures 2.10 and 2.11. The quantities of exchangeable Mg and K (for basalt, 0
4 8 12 16 20
0 30 60 90 120
Milling Time
Fe
2
O
3
(%
Figure 2.9. The pHH2O 1 : 5 (full lines) and EC 1 : 5 (broken lines) of suspensions of
dry- (∆) and wet- (□) milled rocks as a function of milling time.
dolerite, and gneiss dusts), K and Na (for K-feldspar dust) were also compared to the
quantities of these cations extracted with 0.2M ammonium oxalate-oxalic acid
(Figure 2.12) to identify the effect of amorphization during the milling process on
quantity of exchangeable divalent- (represented by Mg) and monovalent-
(represented by K) basic cations in 1M CH3COONH4 pH 7.
These figures show three general trends: (1) milling increases exchangeable
basic cations with the increase due to dry milling being larger than for wet milling,
(2) the plots of exchangeable basic cations versus milling time for dry milling are
approximately parabolic, while those for wet milling are linear (Figures 2.10 and
2.11), and (3) milling greatly increases the amount of soluble amorphous cations and
the difference between % oxalate-extractable cations (soluble amorphous cations)
for dry-milled rocks, indicating the strong retention of basic cations by the
amorphous materials.
For dry-milled rocks, the maximum values of extractable basic cations were
reached for various milling periods (10 – 90 min). The maximum values of
exchangeable Ca for dry-milled basalt and dolerite were similar, i.e., about 3 % of
total Ca, but exchangeable Mg for milled basalt was larger (about 8 % of total)
Figure 2.10. The percentages of CH3COONH4-exchangeable Ca and Mg for basalt,
dolerite, and gneiss milled under dry (full lines) and wet (broken lines) conditions as a function of milling time. The % exchangeable cation is calculated relative to total of this cation in rock for each milling time and condition (Appendix A1). Total element presented in each graph is for initially milled rock (T0).
Figure 2.11. The percentages of CH3COONH4-exchangeable K and Na for basalt,
dolerite, and gneiss, and K-feldspar milled under dry (full lines) and wet (broken lines) conditions as a function of milling time. The % exchangeable cation is calculated relative to total of this cation in rock powder for each milling time and condition (Appendix A1). Total element presented in each graph is for initially milled rock (T0).

![Figure 2.7. The relationships between percentages of exchangeable basic cations (Ca + Mg + K + Na) and oxalate-extractable (Fe + Al + Si) versus the percentage of amorphous materials (calculated as averaged [100% - RPA] for several XRD peaks of several min](https://thumb-ap.123doks.com/thumbv2/123dok/357287.317692/36.612.143.532.85.618/relationships-percentages-exchangeable-extractable-percentage-amorphous-materials-calculated.webp)