jrt-:r-MANAGING THE LAST
FRONTIER
OF INDONESIAN
FOREST
IN
PAPUA
,JONNI MARWA
HERRY
PURNOMO
DODIK
R.
NURROCHMAT
Facufty of
ForcsW
Bogor
Agticullwal Universry
ASEA'V.'(OREA
Book'Title:
Managing the Last Frontier of lndonesian Fore8t in Papua ISBN: 978-979-926'l -76-2
AuthoE: Jonni Marwa Herry Pumomo Dodik Ridho
Nurochmat
Publisher: Faculty of Forestry Bogor Agricultural UniverEity
Bogor, lndonesia
Layout & Printing:
Muhammad Nando
lndrawarman@INTMMEDIA
First Printed: January 2010
4o/,rou/o/Vono,rta
We are indebted to s€velal percons and institutions that made ii possible for this book to be
published.
We owe
our
deepest thanksand
appreciationto
the
ASEAN-KOREA Environmental Cooperation Unit (AKECU) that has provided us with tund for publishing this book. Special thanks are due to Dr. Hendrayanto as Dean of the Faculty of Forestry IPB, kolessor Dr. Khairil Anwar Notodipuro as Dean oI the Graduate School o{ IPB, ?rofessor Dr. Dudun8Darusman as AKECOP Project Advisor and Dr.kti
Sundawati as AKECOP Project Coordinator in Indonesia for all kinds of assistance and supPori.My special gratitud€ Soes !o Mr. Soni Trisorr M.Sc a]ld Mr. Budiyanto, S.Hut for their most input on technicat aspects, and Ms. Ani Pu4ayanti, M.A ior her helpful assistance in English hanslation and proof readinS.
Finally, u,e would like to express my deepest and heardelt thanks to "Muhammad Nando Indrawarman@INTRAMEDIA" ihat has made valuabie supports {or iay-outin&
p
rltLnt, and publishing this book.JONNI MARWA
HERR,Y PT]RNOMO
Co,rte,tte
ChapterlPAPUA:THELASTFRONTIERFOREST...
Biophysicof theStud) Are
Soil Trpesand Freld ConJi6ura6on... Topo9raphy...
Ve8e1ations... .
Potency oI Iorest Resouces in Sarmi Re8ency... Forest Ec osysterns and Stand D).nandcs... Forest Utjlization in Pap
1 1
4
4
4
5 5
ChaPIeT3FORESTYIELDARRANGEMENIS .-. .-.-.-.
19 TheConcepilorYieldArrangementinForestManagement.... ...-....- .-
-...
19 ProductManagementBasedonSimulationModel...-.... ...-..-
.--.
-...
20 Stands andStand SEuctures...AGrowihModelforUnevenASedForesis...
Ingrowth, upglos'th and mortality lates
Model Buildint and Forest Yield Anrantemcn t
ldFnnfi.ationoi I$ue", Airns dnd Lirruiation5... ...
FormulationofConceptualModelarldSPecificationorQuantitativeModel...--...
SubModel for Stand StIuctUIe D),namics... .... .
Yield Arrangement Sub Model... EvaluatingReliabiliiyand LogicalModel... ...
The LIse of the Model
I
enano\o
lnlPrvenho22
25
26
28
28
29
32
u
40
40
42
42
M
47
47
49
49
49
49
50
50
51
52 S.enario Changing Cutting Cycle Scenario... ... ...
Chapter 4 ECONOMICVALUE OF PAPUAN FOREST... ...
Tlpes of Regional Income from Forestry Sectors.-.. Forest Concession Fee (trIPH/IUPHH)...
Forest Resource Provision (PSDH)...
Ref o.estation Fund (DR)
r-and and BuildingTal (PBB)...
Fo.6r.r
S€ctor Contribution on Regional Economy E orhmi. Condition of Sarmi Re8enry... Filtel}---i1 anCE onomkArElysis... ..-...-..b:.i
\-a-ue.rj:-.lmpaon:
-. ---1auo" Va ueApprod(h.....
...'-i-ilnteof
Return(IRR)......
..
....
-
..
...:.-:-:
aostRatio(BCR):
-
.R"\it"lizarion5ub-\.4ode1...l-:-::
rfPrice.r-:
Raie Change...- :'
l.iel
of the IndiSenousPeoPIeIncome...'.": :
-
-nsarionstandad Change on the IndigenousPeoPIe""
"
""-i:.-:j.1o
TimberHuntinS.-
--... - ..-
..-_:r:".r Business in the koduction Natural Forest
-::-1.s...',,..,,,'.,,,..,,,.,,,
i:-r-:rio
Reduce EmissionfromDeforestation and Degadation (REDD)"
"'-""
-'-
rr.a
rison of S{enariosrributiontowards
regional economy...-...:::pter5POLICYIMPLICATIONANDRECOMMENDATION'.'
.
FFFRENCES...-...-54
55
55
58
60
62
63
65
57
67
68
70
71 73
/*t
,f
Ta//,
Table 1
Table
L
fable,
Iabl€ 1
Table 5
Iable 6.
iable
:
.:.1:.::
T:t.L: 11
Iahle 1:.
fable
1l
ianre
l1
Ia5ie
l5
Tablc
l:
Tablc 1S
Table 19
2
5 5
26
27
27
28
30
43
45
51 58
61"
63
61
70
[image:9.468.28.449.90.714.2]-!er
f
C-ceibution of forestry sector
i
-kage
incorteof
/*t
of
fi12*"
Figurel Fi3l]Je2. Figxre3
F;grlre.1
Fi&re5
4
16
2a
34
Figl-re 6.
Fiqrre 7
Fi$re8.
Fi3xre9.
36
37
37
39
4'\
44
48
56
59
59
61
Figurel0
FiB!r€ 11.
Figure 12.
Fi8ue 13.
Fignre1.l.
Figurei5.
FiSure 15
Figwe17.
l,o"g
(a)
(b) Non di
43
I
I
n-
iee?.?ry
I
I
Cl,a7a,.
PAPUA:
THE LAST
FRONTIER FOREST
apual is one region in the eastend which gives the biggest conftiburion towards the richness of the tropical rain forest resources in Indonesia. With a total Iorest area of 40,803,132
h4
itscont
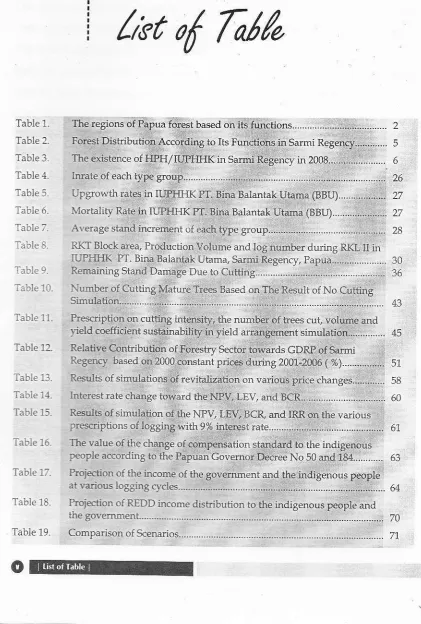
bution r€ached 32.8% rowards t}le totat area of Indonesian forests. The ecosystem oI ihe forest in Papua consists of the divelsity of both flora and fauna which combine the elements of bioregion areas; namely, South East Asia alld Australia. Based on the Decr€e of the Minister of Forestry, number891/KptsJI/199
dared 14 Ocrober 1991thetotaiareaoIforestcovers95.50%oIthetotalareaofIiianJayaprovince(.hatisnor,, called Papua and Wesi Papua).ft
comprises Conservarion Foresi, protccted Forest, and Production Forest (Table 1). Such a vast forest area stores an enormous potency of endemic flora and fauna, which is unequalled. There are more than 70 kinds of tradin8 woodswiih
merbau (lntsia spp.) as its superiority, therefore, this type oI wood becomes the major target for wood business in Papua. Othei
tadinS
woods Iound in rhis area are, ajnong othe$, Meranti Broup, consistintoI:
Matoa (Ponetii spp.), Menawa (AnisopterusW),
Ker.lan (Clnatium spp.), Nvatoh (Palaquin
W.),
Resak (Vrtica spp.), pntai (Alstoniasp
,
Damar (Agdthis spp.), Aravcatla (AnucariaW.),
Kap.ur (Dryabahtnops spp_), ForestMa\go (Ma gifelaspp.), Cglthis (Celthis sW.) and Kayu Cina (Podoa7ry,rs spp.). Those betong to mixed woods are:
Ketapanl
(Tenninalia spp.), Binuan8 (Acbmeless
matrana), Bintan|Jutr (CaLtaphllum inoplrylun), Terc]]tang (Canrynospema awiculata' KayluB:ugis (Kaordersiodentlron pinnatum), a]1d Pala hutan (Mynstldi Spp). Flrrthermore, the groupof
Kavr Il]taft includes: Danu (DracalttonleLun edule) andLinigua (Pteracdrpus spp.). Most oI these woods belon8 to the non dipterocaryaceaSroup
a fact that diJlers Papua from Kalimantan which is dominated bv dipterocarpacealorests.P:o.",. d o.-F ot'a.o .p^-,'orN6^G ,o.1" dmet,p6o_aoo,nr^:n " o"P- | " ':m odP-" '
Tablel.
Theregonq of
Papua{orest
basedon
its functions
Papua (Ha)
Iun.rioN of th€ Are. CoGnatlon Forest Area
(KsA + KPA)
!9,704,300
!
42,224,UOt
7,070,u6!
2,633,954Proteded lor€st Area
(HL)
r 10,619,090a. Lidited Production
Forest
12,054,110(HrI)
b
P€mancntProdudronForesr
[HP)
]
ru 5dr'2lu!7,638,676
11,856,665
18,354,283
r 2,9A0,474
!
197,425t 2,234,927
c
ConversionProduciionlot6t
IHPY)
19,262,130
!6,$6,623
r2,n5,45731AM,664 10,818,176
Sorre: Fsest Plannino Agency Forestry Deparlmenl (2004)
The formations/types ofvegeration
gown
in a vaiet]. of habitat spread our from the coastal area to ihe alpine zone/ so that Papua is b€stknown to have,,the 1argest aJtd mostcomplete tropicalrainforestecosvstem", apartirom other tropicalforests in Amazon and Congo. Also, Papuan forest holds more than 30,000 kinds oI wooden trees, 330 kinds of reptites and amphibians, 650 kinds of birds, 164 kinds of mammalians, and 700 kinds o{ buiierflies (CI, 2000). T}le aspe.ts oI climatic and edaphic of papuan region ptay an important rolein
deiermining these veSetation Iormation aJtd species diversity
formed.
From all oI the resource potencw of this Ioresr, many kinds oI b€nefits can be obtained, particularlv from the extact oI timber foresi products.The histoq' of forest resource utilization in papua is as old as the age oI papuan human civilization. The phase oI tife cornmencint from primiiive iife pattems - hunter garherer, shiftint .ultiyation, peasant cornrnunity to the modem stage is also inAuenced bv the role plaved b! forest resources. For the Papuan, forest is a ,,mother" who gives bkth. rarses and gives lives; ac.ordingly Lhey depend atmost enthely to this forcst. This means that the existence of Ioresi resouces has become a pilar for rhe systerrls of economy, €cology, socio culture, and even religion for the papuan tiJe peeetuity from one generation to another. Ever since tie collapse of naturat forests in Sumatera, Java, and Kalimantan regions due to the excessive exbaction, rhe forests ofPapua have become a iarget of timber for businessmen
in
Indonesia. Ir' fact, bu srnesses on Forests jn papua offer immense benefits for them; as a result,
it oPens opportunities for investors to locate their money here. In 1975_1990 the number oI timber companies operaied in papua rea.hed 20 companies.!,,irh 2l business units. Fivevears tater (1990-1995) ihere was an incrcase
of;i78."
(27neh
unir<)Tlai
numbertcpi
on growing so that in 2000 Papua became the ,,forest business Iield,, for 54 companies holding forest concession (HPH). AccordinS io the data from Forestn Office of papua province, in
1 ,16 ihe number of companies reached 46 spreading throughout Papua kovince (23 urtiis)
::j
\1 est Papua Province (23 units). This number, however, declinedup to35 units in 2007;-
r of$ hich were active, and the restwere stagnant.
::puan
forest
21,901,450ha
prcduchon forestwhich
has been managed -..tensively since 1970 by Forest Concession (HPH) holders. Based on the resolt of sat€lliterage
in
2004 thepdmary
forestin
the production forest area wasonly
65.22% or-..1,28a,153.05 ha (BPKH X, 2004). Thus, of the produ.tion forest area (21,901150 ha), not
aI
.an be expecied to produce logs.
The distribution of forest concession in Papua is mostly (57.41%) in Papua Province; while the one in West Papua reaches 42.59%. There are ttuee administrative regencies that give the liggest contribution towards concession area coverage, namely, Sarmi Regency, Boven
DiSIi
Regency, and Bintuni GuIf Regency. This paper {ocuses on the forest concession in SarmiRe8ency with a casc study on the holder of the Concession for the Utilization of Timber Forcst Products (IUPHHK), namely, PT. Bina Balaniak Utama.
HPH I'T- Bina Balaniak Utama (BBU) is one oI ihe companies belonginS to Ka)'u Lapis Indonesia (KLI)Croup. The workint arca of HPH PI. Bina Balaniak Uiama covers the forest group inTor River and Apauwer River. Geographicaliy, *ris forest group is located between 138'05'- 139'00 East LonSitudinal and 01'30'- 0130'South l-atitude, and belonts to the manaSement
oI
bolh Foiesiry OfficeoI
Sarmi Re8ency and Forestry Offic€of
PapuanBased on the map of satelite irnage made in 1 99, the toial area of IUPHHK workinS area was
325,300 ha consistinS oI215,249 ha forest area arld 2080 ha non forcst area; 1&067 ha was covered by cloud, and 84904 ha was a swamP area.
The following is the total area and the forest plaruing based on forest arrantementi 1)
koduction Foresl (HP) covering 59,593 ha; 2) Pemanent Production Forest G{PT) as much as
159,781 ha; 3) Conversion Forest amountin8 to 102255 ha; and 4) Other Utilization Area (APL) which covers 3,571 ha. In order to undersiand the dynamic and arrangement o{ forest products in the concession oI
PL
Bina Balantak Utama (BBU) region, the observation was focused on boih primary Iorest and logged over forcstsi
E -,,-, -ler'q
Iiglre 1. Production fo.est of pT.
Bioph) sicof ihe StudyArea
BBU in Sarmi Regenc).
SoilT! F€r and Field Configuration
Th.
:-'j::
-':iJ
found in HPH PT. Bina Balantak Uiama (BBU) concession are aluvial,..::.j
-:::::-rl.
and podsolic. The situation of field ol ihe h,ho1e area consists o{: dry soil:ii.r,
i;,:r.
6.:tr ". and brackish 13 %, w.fth an altitude rangingfro
0-600 m a.s.t. The area or'ih:i
e:.:::..
Permanent Plot (PUP) belongs to a flat caietory.TopoFaphl
Based
oi
&r:iope
area, most ofthe area in Sarmi Reffncy has an altiiude level between 100500 m abo\
.1:..ea le!.]forTor
AtasDistrict. Meanwhile, Sarmi, WestCoasr, East Coast, andsome parti
ri
-1..g.:o have aliitudes less ihan 100 m above the sea. The siope ranges between2% and 65'-.
i.:.!r!:
g of 2% 8% inEastCoastand trVest Coasr. TorAtasand some parts of Bongso vai., oeo\.-n <2'. andS?/"The topograph\ I n ts BL a rea is more dominant than ihe regions in ihe 1o!v tand, cove ngarea
asmuchas-17.8"!,ia:ll:i,rvavv17.2?6,andrarhersteepareas13.3%.Thisregionrelarively
d oes not have ven jieeF iopo graPhv, as a result, the production cost is smallcr. The Typ€s of Weather
According to the classiti.ahon
iofll
ardedhrsctmidt
and Ferguso& ihis area betongs to the one in A lveaiher l\'pe, \1iih en rlerage raintalt of more than 2.485 mnl/i-ear. The hishest rainfail occurs in lr{ay,l,hile the lorlestis in Sepienrber. RaL#a occursconirnuoust\*ithout
dn norll,,rndrh.;\ero3.
.
r,F%.rud
.,=ct"
,fr.,r
p.-r
-r
trForests in HPH PT. Bina Balantak Urama {-orking area belongs to the lropical rain foresL Based on the measurement ofPermanent plot (PUP), this area is dominatedby rhe h?es oi dipterocarp, such as me tbav (tnhia bijllga), ,..atoa (Pa"letia spp.),
ke\ai
(Candnunsi,
n\.atoh (Ptilaqltiwn nnbotnense), andrcsak (Vt:tlicr pdp ana). Meanr-hile, the typesofnondipierffa+
and non
commercial vegetationfound
in
ihis
areaarc
(Canaqn odorita), Dah.u (DrccontomeLu edrle), meclant (a,fsed sp.), iarnbu-jamb:ual, (E gel1ia spp.), pata huran (Mynsfica spp.), meh]..jo \Gnentw gtlelnon), and buah hitam (kecapi) (HaploloDr4wifi
arelaiivel], balance proportion.
Potenry of rorest Resources in Sarmi Regen y
Sarmi regency is one olthe new reSencies in Papua Province thathas been developed since 2002 with a total area of approximate\, 8,948 km'. Based on the Forest Area and Wate$hed Area Map,Iorests in Sarmi Regenry are divided into 6 forest area functions as ptesented in
Table 2
Table 2. Forest Diskibution Accoiding to Its Funciions in Sami Regen.y
(%)
No Tolalarea (Ha)
1
2 Natura Proteclion and Natural Conservaion Area
Limiled Produclion Forest Pennanent Pmduclion Forest Convercion Produci on Foresl
2U,675_42 1,296,78240 391,640.50 949,493.05 367,412.38 24003.40 8.03 39.37 11.8S 28.83 11.15 0.73 3 5 6
3,294,007 36
Saw: f.es1ry dne al Papta Ptuvh@ P0A6)
The majority
of
Saimi Regencyis
coveredby
forest v€geiaiionwith a
total
areaof
approximately 2,825,965 ha.
or
about 92.5%of
the total regency area. The condition of vegetation coverage is mostly dry land forests, 2,344,n6 ha (76.5%), swarnp forcsb,465.479ha (15.3%) and mantrove forest in the coastalarea, whichcovered13,699ha (0.6%). Logcover
areas (secondary forests) onlv cover 82,615 ha (2.7%). This leads to a conclusion that the forest
area in Sarmi Regenc], is mainly pdmar_y Iorests. This kind o{ potency offers management opportunities Ior the regional economic growth. ln line with the issue oI regional autonom,l-, the local govenment of SarDi regency accelerates the increase of regional incomesj one of which is tuom Iorestry sector. At the moment, ther€ afe 5 units forest management in the form
of Concessjon for the Utilizaiion of Timber Forest Products (IUPHHK) that utilizes loresi resourcesinSarmi Regenq, flable3).
100
[image:17.504.30.492.25.524.2]-Table 3. The exisien e ofHPH/IUPHHK in Sarmi Regercyin 2008
SK HPH/IUIHHK
F
s
I
F
i
N AMI of HPH/UPHHK
PT WapoAa Mxiida Timber
PL Bina Bal:nbkUbma Pf. Manberamo Alas Mandni
l'1 . Salaki Mrndin S.iahtera
n/90 2002 92
I
a
-d
i
I
r
!
i
a
ga
r
f,
It
I
Da
t
rt
E
d
!
a
i
d
stu@' Fdasiy cni6. Paw Pnvhe l2aN)
Forest Ecosystems and Stand Dynamics
The type oI forest ecosystem of Papuan forests is the one
('hich
is relaii\-elt complete, commencingyith
the formation of mangrove forests, swamP forests, low land forests, lolv land mountain forests, high iand mouniain forests to alpine Iorests (Petocz, 1989). The ecos,vstem ln these forests is considered to be one of the natural resources which gives multiple benefits in the realization of developmeni, not only from ecolo$cal point of view, but also ftom social, and economic ones. This faci was utierllr advantages in supporting development and gives an essential conlribulionin
producing incomefor
the country. However, this roleis nor.
facedby
unsusiainable forest management since dle forest condition has underSone changes. Forest ar€as, particularly the production natural forests, mostl), come from logged over areas whose conditions contiflres to experience a de$adationdue to €xcessive lo88in& so that efforts to manage the sustainable foiests ale definitely requircd.
One of tIrc major rcquirements to achieve sustainability in Iorest management units is the provision oI long term forest manatement plans where product management becomes its major component. Yield arlantement
tkouth
cutting allowance also plays a vital role in asustainable forest manaSement and therelorq has to be carded out in a specific way due to the fact that the condition and potenry of {orests vary ftom one area to another- Such a yield anangement has to be determined both precisely and objectively through a Sood plaruring
[image:18.534.56.466.22.274.2]potency
of
minimum stands that hasto
be Provided, while from the Point of!ie(
oi
ec':t-::
consi.leratiorL srructural standsl{ill
reveal the Picture on the abiliryfor
the siands tor%enec:'
(Suhendant,1993).The dynamic siructure of stands, ihen, is closely related to economic aspects in timt'er
Prcdur:o''
activiiies since it has a correiation with the duiation in which a capital i't-ill be invested in order tc produce the timber (Davis et al-, 2001)- Maximizing the discounted income is very imPortani Ei achieving both cuttjng intensiiy condiiion and oPtimal cuttint cycles lndeed, this stratety requires afinancia I evaluaiion as its element to assess the financiai pedormance oI a compa]ly'
By
relyint
solely on stand dynamic, nevertheless, a consideration is not adequate to explain for61 eiosystems not only because forests contains complexities and uncertainty, but also due to rhe fact dlatthef
are dynamic and non linear. Accordingly, the measurement has to be integrated, taking into accorrrt other aspects like economic and social (Low el dl., 1999i Ness etal,
200?' Such a comPlex character can be approached with a dynamic system apProach by building models usin8 a comPuterinstrument towards a comPlex siluation. Therr an exPerimeni and a behaviour study are
'aried
outtowards the models at a certainPeriod of time (Cadfield and Maj 2001inNess efnl',2004'
Vanclay (1983) points out that several models are built to test the ecotogy succession upon different types of forests; however, such models are not able to be aPPlied in yield alran8ements' Lilewise' tIrc trinsition mairix approach develoPed by Usher in 1956 calr only give a small
cont
bution in order to understand gowth processes in Iorest stands. With this kind of dynamic system model, it is exPecte'i thatit
would be able to determine ihe presc Ption oI foiest yield anangement from production consewation and socio-economic asPects aswell
as its contribution Sivenby
yield arangement method towards the income of not only so{iety but also local govemmeniForest Utilization in PaPua
Forest resource utilization can not be seParated fiom the Sovemment plan to indease lo'a] oriSinal
in'ome
This relation can be in the form oI either synergic or as]'mmetdc relation ln lact' excessile forest resouce utilization fails the ef{orls toconse
e {orest resources a topic wfuch then be'ame thetarget of the conJerence in Rio De Iainero in 1992'
During 20b0-2005, Indonesian forest area declined by almost 5.2% . Data shoh'ed that the sPeed of forest
areu
dlllle
in Srr.nutru Island reached 2% Per year, in Java Island was 0 42% Per year, inKalim"niai
Island reached 0.94% per year' Likewise, the decline sPeed in Sulawesi lsland was up to 1% Per year'
andinPapua, itreached0.T% Peryear (Medialndonesia,
The new paradigm in forest management is, therefore, expected to increase the income of the local government and the welfare of society by taking into account conservalion management
aspects. The control upon log production from Ioresi area is an important part in rea lizinS the ellorts
to
reach sustainable products direcdy leadto
the realization of lorest business conseivation. Theoretically, tlre production number of logs depends on forest condition andis determined based on etat cutting rules, accordingly, in a normal conditio& log production
is of a certain number which is relatively the same uriless there is a sophisticated technoloSy
input.
One
oI
forest managementforms
is
Ioresi
yield
arangementthrough
the determination of annual allowable cui (AAC) established by ihe Sovemm€nt. Forest yicld arrangement has its short-term and long+erm eftects, in other words, AAC establishment bores ecoloSical, economic and social consequences.At
the moment, Iorest armntement method use.lto
determin€amual
cutting allowance (AAC)is
generalfor
any forest condition; thus, it is practiced in most HPH. In conlrast, specfic condition of each forest is notalways the same in relation to its climatic and edaphic, so yield arrangement based on a
speciJi. site is defi nilely required.
On€ of the ruPHHK whose AAC is based on a conventional arrangement method is
IIIPHHK
FI. Bina Balafltak Utama (BBU) in SarIIri regency which manages 325,300 ha forest. However, the qu€stions raised in such a case are:
with
the knowledge and silvicultural techniques, de$adation of the current natural production for€sts, and chanSes in govemment's policies,will
lorest managedby
ILTPHHKthough
yield
arangement mechanism applied grve sustainable products?Will
the Iorest managed be able to give optimum contribution in supporting regional economy? AIldwill
it be feasible to be Siven to IUPHHK holders? If the answers are "no" an alternahve to sustainable yield arrangement is absolutely needed. Thiscan be carried out by conducting a study in order to know two important aspects in Papuan forest mana8em€nl tirc first is an alt€mative for the yield arrantement lrom uneven aged {orest based on the
ottinS
intensity arld a sustainable cutting cycle by using the dynamic approach, and the second is the inierrelation between forest yield arrangement and the economic impro\ ementof boL} sor;etyand re$on.This study, therefore, is expected to b€ able to recommend a valuable input fot the policy
make$
in
establishingthe
shategiesoI
production nair1al forest aran8ementin
asustainable way. Furthemore, the alt€matives of yield arrantement developed ln this study
efiaVtur
Tl-{E
DYIIIAM]CS
CIF
FOREST
The tr{istory
of
LheCrowth
and ProductModel
Developmentin
theWorld
oth growih and stand product models ha\.e a 1on8 hisiory. In the beSinnint of 1850
Ioresters ftom Middle Europe (French and Switzerland)had used a $aphic method to make ihe model for ihe growih and produ.tion offorests including the stand table (Vokila, 1955 in Peng 2000). The most m€ritorious person in this case was Henry Biley, a
forester ftom S$.iizerland lvho introduced the growth method through his
w
tin8 entitled Me'thode du Conto'le (conirol or check method) He succeeded indcvelopingan inventory s],stemthatcouldmeasure trces from thc small, middle, tobig sizes.Furthermore, America staried to make a stand table ftom 1920 to 1940 as a foun.lation in makint assumptions to make curves. This siand table had a siatus
quo
ntil
1950s. Srnce1970s, ho\a-ever, the hfluence of computer technologv has sigrlificantly assisted to build ihe models for growth alrd siand product, pariicularly the stand {or uneven age forests. Both of
these models described forest dynamics such as the growth, L\e mortalit)', r€productioo as
well as their relation with the stands at a cenain time; therefore, they are used widely in fotest manatement.
The elementa of stand d).namics are required in forest manaSement due to their abilities to update inventory data, predict the stand products, and €xplore management attenatives, and also silviculture choices so that they became useful information for decision makers (BurkharL 1990; Vanclay 1994 in PenS 2000). In the future, the impact on the
$owth
and product prediction with different scenarioswill
become keys to realize sustainable forest manatement (Kimmins I997 in Peng 2000).All models that have been developed are appljed from thestandlevel to individuaitre€, and ihepurposeis thai thrcugh thcse, proccsses from the standproc{uct models to ecological ones in the
fo(st
can bc reached.In general, uneven aged forestshave three major characters; namcly, 1) maximum diamctcr, (2) density (usually
the
.idth of basal area), (3) raiio or Q lactor, ihat is, the ratio of Lreer
The metric growth model is used ro observ€ the impact of both shorr-ierm and long ierm impact on different kinds of cutting altemarives io$'ards economic bcnefits and ecotogical diversiiy in mixed forests in Wisconsin, USA (Lu and BuonSiorno 1993). The growth modei developed here is thc same as the one proposed by Buongiorno and Michie (19E0); honever, there some additions in grouping the kinds and srzes o{ the plants. Moieover, ingrollrhplavs
i ts role as the function oldiameterand the number o{trces with rhe Ioltolving equarion: Its
:
14,650-0,020G. 0.007cr0,016c,+0.002N,
B'=0,3%)rr
= 29,596,0,039C", 0.033c, -0.043G--+0.010N,
(P=5,8%)r.
= 9,8-12 - 0,0i3 C. - 0,010 C, - 0,043 G, +0,012N,
(n'=4,2%)wherel,,I,, aJIdJ. are alnuaI ingrol,thraie (iree/ha) ofhees with high \.alu€,low value, and non commercial, respectil,elv, GH,
Gl,
andGN
are the total diameier (m/ha), and NH, NLand NN are the total numberoltees (iree/ha).
In addihor! Buongiomo ei dl (1995) carried out a study on the
$owth
and mixed tvpes of uneven ased foresis in Jura France, as l{,.ell as its implication on economic retum and tlee diversiiies. Ttle equationfol
ingrowth,upgrowtlr
ar1d mortatiry are based on theq?e
groupint (Fr,Spruce, and Beach). Suchastudvwasperfomedbyusingthelollowingmodet:t 11
:
I
ctI
\
B 1(.q-bifi+
e kL
(r kit-
h*i) + c k ({
= 31 _ 4./%)i=)
j= rThe Equation for
ingowft
of each species is a funcrion of h.ee number and reversedwith
basalareaoleachkind oftuee. Meanwhile, the ingowth equarion is asfollowit.
Ld.,t-8.'
),.n.., Iu.. ,\
j=lr,
c.
rR
J--c-oo)4,
= i,i8lo',rr, or number of k tvpe of trees per unit area belongs to rhe smalest diameterclass duringa5 yearintervat (rree/ha)
B
= basal area average of the -i dia rneier class (m'lha)Ck
=A
Constant which is expected not to be negative, meanint rhat ingrowth might happery not depending on stand situatio& can occur freely, and the form oI its stand sh-uctureisin line ra irhseedlingspread around the staJld.6,
=t'1+qi
: :
B (yrl-h,r+
s,q
i:t
j=t
( Rr=
1,3-40%),,j
=
upgrowth opportuniiyof
itypediametertoj*'ithin
5 yearst
-t.
/ ji1
n-"b=0(i=17
mlB
= ioial of basal area of all kinds of trees rrom -i diameier class to-j
(m':/ha)DJ
=averageofdiameterin-ldiameterclass(cm)Pi, qi, Si = paftrr.etet / regressioncooeficient.
Martrlih! (mij) is the opportunity
foi
a tree to die from ihei
tree andj
diameter class experienced within 5 years, is Iormulaied below:Z
B (yirihiri+
wiDj
(R:=7%)
where
:
i,ri
I^ t=
pammeter/ regressioncoefficientKaduki ef nl (2006), built a growth quantitative model, recruitment and mortaiity in tropical rain forests in Nortl-east South Wales Austmlia using multilevel nofl llnear re81ession in various disturbance levels. The resuli of simulation using simile toois was a moderate
prcdu.t
with
an intensityof
47'/, basal area (BA), and needed 120 yearsto
produce sustainable products without considering thelr inte$ation$.ith
ecolo$cal aspecis.fhe
sinSle tree selection (357. BA), however, produced a smal1 gap in the canopy, as a result, recruitment became low, thegowth
o{ the stem increased, but itneeded 180years to revive such an area.In the areas with intensive exploitation (50% BA)as a result of high activity of log$n& the area destroyed increased, and needed approximately 180 yea6 to revive. Theareas obtaining the impact of intensive logsin8 (65-80% BA) reduced siem density, created a
bigger gap on canop, a]nd gave big growth products and recruitm€nt. Nevertheless. such a
condition increased ihe period for revivin8 a 180-220 year decay.
In
addiiion,with
the avallability of simulation software, Stella Aswandi (2005), Septiana (2000),Balri
(2000),Cahyadi (2001), and LabetubuJl (2004) used this in order to simulate a d),namic model of stand structure.
With
suchkind
of
sysiem dynamic mode1,in$owih,
upgrowdr, and mortality were made non linear tor{.ards stand basal area by using hypothesis data.Mod€ls foran OptimalNaturalforestManagement
Tropical Ioresis are of many kinds, ac.ordingly,
it
is difficult to define an optimal stand structure and, probabl, itis more relevani s'ith the siudy on han'est cy.le lenSth, minmum diameterIor
han'esi (Vancial 1995), and the numberof
trees harvestedin
each cycle (Mendoza and Setyarso1986).I
I
I
Lu and Buongiolno (1993) studied both the short term and the lont rerm ofcurting re&me altematives towards the revitatization of e.onomy and ecological biodi\.eisi4,
;
mixedIorests in hardwoods forest, lvisconsb USA. The resutt of rhis srud\' is a simpte guidetrne fo. cuitin8 all kinds of trees whose diameter was rhe sma est (15 cm) e\.ery !,ear. They show thar the biodiveGiiy is nearly 95% of the naturat siands, and the tand rcntis approximatety 70% of whatcould bereached.
Likewise, Buongiorno e t dl (1995) determjnes a variety of tlee measurement and economi.
revitalization in th€ stands oI uneven aged Northemhardwood forest, the USA. Itwas found that natural stands which are notdisturbed ar€ tikely to reach rhe sustainabiiitv of rhe hiShest tre€ diversity. In generat, ihe economic stand harvesi policies gave an impact o; rhe deciine
of
dive$ity
of tree measurement for approximatety 10-20%, d€pending on ihe cuttin8 cycle IenSth.Other studics on the trade-o{fs between income and the variety of diprerocarps mixed foresr managementwereaisocarried outinthe low land olMalaysia. Among ihe r€gimes studie4 a
good compromise between economy and diversfty was ro cut more trees with 30 cm and 40 cm in diameter Ior the types of both Dipterocarpaceae and Non Dipterocarpaceae trces
in
every 10 years. Such a condition would tuard severat Eees in a]t measuemenrs and types. Voreo\ er,#,
Iindncidl re\ rtd'nahon.orrd
be compared lo orher u.rve.rmenr. in Vatdy.ra, and the highest result is under the present mana&ment redme, the diversiry, however, is significantly hither (Ingram and Buongiorno 1996).Other studies on an opiimum harvesi model
in
order to evaluate Indonesian SelechveCrtting and Replanting System
(IIrn)
by using the tinear progam was also pedomed by Siantud. A simulation was conducted towards 7 types ofcuning roiatior! 3 interestrates,3 levels ofstand damage and,6 types of royatry system. The resulirs that an oprimum cutting roiation is determined by not onlv ihe an]ouni of inrercst rares but also rhe existen e of standdamag€ level. The bigger ihe interest rates use4 the shorei the cuftint rotation is, so that
it
would give the hithesr forest products (Sianturi 1993).Indeed, simulations give more
flexibitty
in modeling (Buontiomo and Ciliess 1987).A
phenomenon is abl€ to be presented rhrough mathematical retations of a form thar is easy tobe applied upon the real sysrem. Simutarions are also used as the bestandmost useful toois
in
solving problems in foiest rnana8emenr. Both output and application that can b€ produce.t
Irom
these kindsof
models are, among others, stand dynamics, forest vatue, rhe bestremaining stand number, the best cutting intensity, optimum combination and sensitivity analysis.
SimulatiorModels
A modei is the reat absrraction ftom rhe reality (Harmon and Ruth 1994;
Cra.rrr et nt. 1997)
Banks el i?1. 1999), which
comp
ses formal description of essenrial elements upon a pa rticularBesides, a model is ctefined as a rcpresentative of a svstem in ordcr io study ihe s\.siem
A
model is crucial
for
taking into accountall
aspects being observed ftom a s_vsiem thai influen e the system on investitation. These aspects reprcsent the modelof
a slstem. Moreo\.er, more detail models nrighi allow one to draw a valid conclusioninorder to expla-n areaisystem. The cornponents ofasystemare elemenis (entities), attributes, andactiviiie. oiThe establishment of a model is able to help obtain the data from experimentand observation blocks. This can also help slnthesjze and deliver the existing knowledge as well as
idenrji
the gap of ourunderstanding. Besides, modelinS enables one to Iind the mostefficientway io test expedmental data, investi8ate their implication, and formulate
the
guidelines of optimumsilviculture gxidelines (Vanclay 2002).Furthermorc, a modcl is a form made to imiiaie a symptom or a
process-
Models are commonty taken from different kinds of assumptions rclaied to the sysiem operatioi. Such assumptions are then expressed in rclaiions to mathematics, logic, and svmbolic among theobjects or entities Irom a system.
Models can be grouped into quality model, iconic model, and quantitative model. The lattest model is a kind of model formed of mathematics, statistics, or computers. A mathematic model is usually of two cateSories; they are static and d),namic models. A static model learns about static system behaviour (wi0rout including time element). The dynamic model on the other hand, assisis us to find out how a system chantes in line with time. The
$owitL
decay, and assimilation are the bases of the dynanic system pattem.A simulation model .an be used for the followinS: (1) to analyze the detail oI certain policies,
(2) to conduct a sensitivity analysis (3) to compare several policy altematives (scenarios), and
(a) to obseffe the behaviour between the pdce and the benefits (Eriyatno 1999). The Ch.lleng€sin Naturrl forest ModelinS
Compared to tlee Iorests, natural forests have various difficulties in modeling since theY have more variables a]ld high complexity. This can be obseffed from the
dive$it,
of hee sPecies, forcst strdcturc, changes due to succession, natural disturbance, and interaction dynami.< among the stand elements (Turland, 2004.Apaii
from this, natural Iorest management exped€nces many obstacles due to the silvi.ulture system applied, both regulation Policies and economic situation o{ the govemmenL and the influence of enviionmental and social problerns.A computer as a modeling tool can be used io maximize the volume of timber provision,log production l€vels, and species composition. Even more, in environmenial conllict level, as
well as social and political charges, computers are also required. Neveriheless, modeling in naturatforests is admitted to be anextrememodel science. According to Turlall.d (2004, ihis is caused by several points; among others, data Iimilalion in both composition and stand dynamics, Iength oI the time period requircd io shift from one silviculture system or
mJn
I
natural disturbance, and the provision
of
tundior
inventory, crown straiificatio& and classi{icaLion olnaiuralresources_ The consequen.€ is ihatcomplexity of resources Ieadingtothe difficulty jn the prediction of growth and prcduct
modeis as well as product reSrlations. Model in the field of forestry is an abstaction of the realitv in the forest for research and management purposes. The major Iocus of the Ioreshy mod€ting is ro provide quantitative bJoroation in order to plan for€st management and policy making.
Furthemore, th€ purposes oI modeling in Ioresty
fiet4
in particuta, are, among otherc (Turland, 2004iI
to up dalr IorestinventorydataI
io make an evaluation in order to obtain good silviculture sysiem altemativesa
to predict both the growth aft] the products for a particutar period of timeI
todeterminePermanentPe odI
to make model oI Iorest covered ievel ro see the landscape, habitar and area usage changesina certainplacearrdatace aintime.
The models of stand dynamic and sitviculture system
in
uneven aged mixed forest are relatively complex alld can be tiven Geaiion towards haffest pedod .!l hichare direcied to the Purposes to manage the forests and move obstacles to the more complex levels in order to plan forest mana$ment. Several poinrs of the complexities of uneven aged mixed forest using computer model are carried out so as to initiate the following:
i
The continuitv of temporary chan8es towards the growtb mortality, and recruitmenrin
a
Natural vegeiation succession that occurs actively torvards species composiiion and the changing stand structuresa
Natural disaster (such as foresr lire) thar o{curs in a varied wav, from the minor to the major on€ on the intensity s.ate, frequency, as well as spatial paftemsI
Forests which are permanentty managedin
a selective wayin
order to urilize both cornmcr.ialand non.ommercral producrs rowdrd. rrregrtdr
v offore\t ,rru. lureI
Effectiveness of siivicutture system which is limited by both economic and policy (sociat :nd environmental) facton so that it reduces forest producrion capacityI
Complex d),namics ftom uneven ated forests detemin€cl by species compositiorr mixedspecies, in this case, its relativity abundance, and iheir tol€rance to shad e
I
Spatial variation.In
a
short disrance, thereis
lil€ly
a
change on forest structure (paticularly its species composition) in different areas, there can ae seed ranctomizahon, naiural plot disruibance pauerns, and rhe hisrory of silviculiure system iniewentionTernporan timber
flol\
an.t oihcr financial o bstacl€s tor'r rds choices in harvcstpe
od Various charges on sustainableforestmanat€menr (social, economt, and en\.ironment).The Approachesto Dynamic Systems
According io Eriyatno (1999) a systen is rclation association totaliiy that has structures nl positional asl{-ellas dimcnsiona I aspe.ts, particularlvthe dimension ofspa.eand time.
A
system can be imagnled as a collection separated from interacted components.Tle
elements of a svstem can bc
h
the fornrs of objects, facts, mcthods, policies procedures, organizational paris, andothers.
The relahon betwcen s!.stems may bein
the form of trartsactiorl, interaction, interrelated correction, relation, and 1ike.In
a svsrem there are transformation processes thatprocess inpui to becone output in linc rviih rhe purpose to be reached.Furthermore, Erivaino (1999) poinis outthatthere aretluee thlnking pattems iharbecomeihe main guidelines for sysiemexperts in order to analyze problems. They are (1)c)'bemetic, that
is, ihe
o
eniation in goals, (2) holistici namelv the integraied point oi f.iew towards system sdecisio& and (3) effectiveness; namely/ a principle that gves moie focus on the yietds that are operational and can be implemented rather than an in-depth theorv
to
reach decision existention. Experts give problemlimitationwhichshould use a svstcmapproachin its study, namely, problems that meet the Iollo\^.ing .haracteristi.s: (1) compticared, (2) dynamic, and(3) probabilistic.
Furthetmore, a dvnamic systemis a study on systemchanges ac.ordingto time by taking into account the feedback factom (Pumomo 2004). A dynamic sysiemis a method that can be used io understand a complex and complicated
problen
The dynamic system model will invotve many kinds of input, relatio& and output among parts oiihe siJsiem and modei. tuobiems thatwill
be made n1to thc dynamic system have to have tH,o major characterc;namel,
(1)characteristically dmamic/ covering quantities ihat changc according to time that can be described in theformofachangint Eraphbas€d on the time (2)dloughron aleedback since au systenrs basically have a feedback svstem Forest ecosvstem is a complex system which consists
of
many kinds oI component interactions and is influenced by various Jactors, accordingly, a specfic method, namely, systemanaiysis, has to b€ applied. The essence of rhe system analysis does not lie on the Sroup ofquanliiaii\,€ techniqret raihar,itlocusesmoreonI
I
the strateglr to soh.e problems which are dilficuli or can neither be solved by mathematcs no.
I
..s
.9
E
(siatisiics)
High undersland ng {physlcs)
Low undelstanding High undeslanding
Analysis ol System a.d Simulaiion Levelof re alively process undeBlandlng
Figure2. The compa.lson of Problem Solving (Grant et a|.1997)
Dynamic Models for Sustarnable Forest Madagement
The objective of sustainable products, in the concession oI both even aged and unev€n aged forests is to r€ach a particular condition from a forest stand so thai pmducts can be obtained sustainably by arranging forest productiviiy, not only the
gowth
but also product harvest. Forests that have multiple uses in terms of ecoflomy and ecoloSy are, in fact, complex and dynamic ecosystems. Such forests are manaSed based on units which are in line with thelr management goal. Forest management as an ecosystem has to adjust with environment that suroundsit
(adaptive), as a result, a specilic prescdption thai offers optimum ecosystem d).namic balancewill
be obtained (Pur:nomo ef al. 2003, Pumomo 2004). Accordingly, the division oI Iorest management units has to be based on the characte stics of the suroundingarea which has specific characteristics.
Futhermore, in every forest management unit, there are activities of plannin& harvestin& and educatinS. The activity of product management plarlnint such as the d€termination of optimum forest cutting prescdption (cuttint intensity and .utting cycle) is conducted based on the condition of the first stand, information on the Iund, and the benefits as well as
d)'namic behaviour oI stand structure. Moreover, the intensiiy and optimum cutting cycle havean implicahon towards the income oflocal govemment and indigenous society froma compensation based on pri.e infomaiion and forest management benefit. The behaviour of stand shucture dynamic is based on the information concerning growth and products obtained Irom vegetative peimanent plor (PU?). The understanding towards stand shucture cannot be separated from the information on the diversity of t?ee types in both PLIP and
[image:28.504.26.458.47.373.2]In order to .leiermine opiimum cutting intensity (both cutiing intensity and cuiting cycle) a
system dynamic model is developed, consisting of a model for stand structure dynamics, a
model for econonric revitalization, another model for produci
manafme
L and a mo.tel for the indigenous people income. Mcanx,hile, the inJormationon
treetype diversig
is inJormaiion that supports stand structuredynamic
odel. A variety of simulation models related to both cutting intensity and cutting .ycle are perlormed so as ro derermine the prescdptionof
opdmum product management viewed from the aspectsof
production susiainability and economy.Finaily, for€sts posses thetu ou.n complexity and uncertainiy, therefore, the utilization of timber forest product in a rnanaSement unit cannot be conducted partially (separatelr, but rather, it has to be
pe
ormed holistically. One of the approaches that is able to accommodatethe complexity of forest management is the dy:namic aralysis approach (Gtanl et
al.$9n.The
Cl,apa,.
FOREST
YIELD
ARRANGEMENTS
The
ConceptforYield
Alrangement
in
Folest Managementtand products are the
nurber
of stand dimensions thai can be han ested a]ld vielded dla cerriiJr time, or t}e cumulaHve numbe. up to ceftain iime (Ddvis &Jot nson tqS4. The sustainability of stand ploducts will be reached when thegowth
and the harvest occurin
a balancedway.
koduct
sustainability is used as a tundamental principlein
harvesting and exuemely depends on rhe yietd arranSement sysrem used. yield arrangement
is a method used to contol the number, the types, and votume of tog, so ihat it can be used for
the follor,.ingharvesting (Mcleish & Susanty 2000).
Yield arrangement gives arl impact to the sustainability of forest resources with regard to ecology, economy, and social. In addiiion io thaL pioduct sustainability that has been applied in either hopical or subtropical Iorest leads the natural forest uiilization to the lont ierm one whenever applies consistently, and this
will
give an obvious impact towards environmentat seffices (such as proteciion for water and soilpt:nnind
aswe
as their biologicat quatities (f or i$tance, iheir biodiversity).Harvesting sustainability means that the number ar1d types of the same products (dimensioq qualities, and types) can be taken continuously for a long pedod. This means rhat haNesrins
has to corlsider the sustainability of forest resources.
Theoreticall, product sustainability is noi absolute- Indeed, th€re is relaiivity in it. The relativity is the measuremenl to de€lare the products, the lvidth and vo|.rme of a timber,
curen.v,
or
the numberof
trees. Thereis no
guarantee that the useof
one product measurementwilt give the same sustainability if measured \^'ith oiher measurements. Ii only thereis ihe
same sustainability ievelfor all
product measurements,this
musi be an outstandjng event, and it isnota generalnatural phenomenon (Suhendang 1995).koduct ManaSement Based on Simulation Model
Product manaSement based on the simularion model camot be separated from
gro
.th and product models. This simulation model is advantageous in explaining, understandint and predicting. Similarly, simulation modelis
usefulfol
anal_yzing dataand
slmthesis, communicatinS the existence knowledge, and identiiring a gap in unde$tan.ling (Vanclay2002).
Furthermore, a simulation model can be applied on forests which are varied from one place to another due to forest ecosvstem complexity/ so that the assumption on stand homog€neity is
not really important. This kind of model carl also be used to test a variety of manatement regimes, where product rea lization depends on the accuracy ar1d completeness of the model. Such models need knowledge
on
grol{,.th speed and stand d),namics (Alder 1999 ,fl Krisnawaty 2001).At this present tim€, several simulaiion soltware have been developed to predict either AAC or product manaSemeni. Several studies on product management method For logged over
ar€as on productionnatural foresi innaiurallorestshavebeencarried out based on the forest provision stand combination, incremcnt stand volume and forest stand siructure dynamic, as
well as so.io-economic condition of the sun'ounding people.
a.
Dipterocary Forest Growth Simuiation Model (DIPSIM).DIPSIM (Dipterocarp Forest Growth Simulation Model) is a kind of computer software developed by Sustainable Forest Management Sysiems Programme (SFMP) through a
cooperation between Indonesian Govemment (the Minister of Foresiry and Plantation) and G€many (Deilrscne Gesellscluft fuet Tednische Zusanmenntbeit, GIZ). DIPSM ls a
grola.th o{ individual tree developed Irom
gowth
data aJlcl products through repeated measurement at PUPin
EastKalimantan.
DIJSIMis
used to d€temined amual allowable cut (AAC) based on forest growth simulatiorr tl€e diameter, tlee quatity chanS€s, mortality, recruitment and harvesting simulation (Kleine &Hiffich
1999 il, Suh€ndang 2002).b.
Sustainable and Yield Management for Tropical Forests (SYMFOR).SYMIOR is a model oI growth and yield used to measute and evaluate management sysiemecologically, and nota modelofforesiconcession economically. SYMFORmod€l cajl b€ used to predict ihe growth of the tree, cuitinS yield, and ihe remaining stand
in
study cases
in
SYMFOR method experiment showed that Reduce tmpacr Logging (RtL) system 70 mr/hawiih
a yield regllationin
a susrainable Iorm gave abetter
resutr compared to TPTI system and RIL 8 trees/ha based on the a rnount of produ.rion potency,particularlylor areas with high potenry €usaflty & Sarjono 2001).
c.
Yield Simulation System (YSS)YSS is computer software consisiing ofseveral program modules used to predicr stand condition in the tuture through a simulation technique by using transjtion
rnatix.
YSSwas developed in1999 by Rombouts.
d.
Model Prototipe Thc Forest LandO
ented Resource EnvisioninSsystem (PFLORES) The pFLORES model is a prctotype FLORES model built by Muetzelfeldr in 197. This PFLORES model used modeling software belongsto
AME which basicaly explains sociological, ecological, and environmental interactions as well asfactors
which are related to area usage lactorc (Muetzelfeldt et al. 1994.e-
Model for The Forest Land Oriented Resource Envisioning System (FLORES)FLORES is another model developed based on the FLORES protot},?e model during a
workshop
in
Bukit
TinSgi, West Sumatera,in
1999. Sucha
modet wasbuilt
for
approximately three years based on the idea given by Vanclay in 1995 by using computer inslrument. The materials presented in and sent to the workshop in Bukit Tinggi were compiled to be built as a FLORES model. This FLORES model uses Simile software as its
toot in processinS data. This model is developed
in
order to undeEtand inieractions between humans and natural resources in marginal forests in all developint countnes, suchas Indonesia, Zimbabwe and Cameroon (N,luetzelfedt and Massheder 2003).f.
MYRLIN (Methods of Yield Replations with Limited lnformation)This method was built by Alder alld his ftiends to predict the yield of srand growth
in
kopical rain {orcsts. This method explains the patterns for tree diameter addition {or t}te species.of vegetative grown
in
a tlopical rain forest that has significant similadties b€tween one region and another based on gen€ral assumptions made in rcsponse to the$owth
yield. This model uses an equation to predici diameter additior! tree mortality, and oiher changes in the forest statistically (Aider 2002i,
Vanclay 2003).g. The Simiie Visual Modeling Environrnent
Simile proglarnming is a place that provides the ability and relative ease to build models and simulations on biological processes in forests, stand
growtb
mark€ting process, includin8 humans and other systemsin
the forests (Vanclay 2003). In the beSiirnin& Simile was previously known as AME (ASroforestry Modeling Envirorunent) built by researcheE from the University of Edinburgh, and for the last 6ve yeam, it has focuse.l more on forestrv field. Other language programs the sarne as Simjle are Vensrm, Powercim and Stela. Ttus study used the stella applicationresearch progiam9.0.2Stands and Stand Structures
Buontiomo and Gilless (1984 defined stand as a reiatively smatt ptot of area cDt within a very
short time, Ior instance, one year. A stand might cov€r the entire florest area or just a part of a
vastforestarea which is managed with a ce*ain cutting cycle. A siand in a forest management
peEp€ctive coyers a lorest area which gco$aptucaily is centralized and has combination features and vegetation characteristics (type compositior! growth pattem, and growih qualities), physical features (the form of the fietd), has a certain minimum coverage as
requircd (Suhendans 1993).
The stand shucture is both physical and temporary distribution of trees in a srand based on their t,?es, vertical arld
hor;ontal
dist
bution patterns, tree sizes or those belong to crown vok rne, leaf widthinde{
stems, stem diameter, age of rhe rees or their combination (Otiver and Larson 1990).Stand structure can be differentiated as vertical stafld sEucture, horizontal stand structure, and spatial stand structure. According to Richard (19b4), a vertical stand sftucture is,a tree individual spread in various crown layers; wher€as a horizontal stand stucture is de{ined as the number of tl€es per width measurement in each diameter ctass (Meyer et l71. 1961 in Davis
e, a/. 2m1). A spatial stand structur€ is retated ro ihe existence of rees in a certain growinS
space, determined by drc
suroundint
envirorunent, competition processes, the tree ability to grow and die, and the possibility of seeds to grow and improve ihe siand capacfties_ This study, however,wi[
on]y locus on the horizontat stand srructure.In generat, the horizontal stand structure of a naiurat foresi follol^,s negarive exponmtiat equation or referred to as ,l- (upside down J letter), bui natural foresr srand struciure does not always folow this symbol (Meyer ef nt. 1961, Davis & Johnson 1987). The resulr of a study on ihe tropical rain forest in Imataca, {ound out ihar stand suu.rure ior alt types oI vegetatiors folow this.J symbol, however, when made for each type, rheir stand structure form: varie.t, accordinttotheirtolerancectDracte stictowardsshade.
Due to economic factor .onsideratio& a stand shlcture is able to show the minimum potency that has to be piovided, while
w
h the ecolo$cat consideration oI srand sbudure, a picture on regeneration ability from related stand can be obtained (Suhendang 1993).The stafld sEucture in the form of curve which is .tosety si]nilar to /- IiSue with the follow ing model: N = Noeb, has been found in stud ies on forest ecotog, . Suhen;ang (1985) in his study
abolrt the low land bopical Iain narural forest in
Bentkunat,
Lampun8, piesented a standstructue form
in
the model oI densityfulction
coniinuous iandom variable, based on tamma spread,lognormal, negativeexponentiai and Weibutl. Fulrhermore, itwas revealed that the use of density tunction model to arange stand structures is due to its signlficantty high reliability and easiness on its apptication. Based on the study oI Suhendan; (1995)in
Riau ftovince, the srand structure model N = N.e'D carl be accepted bva
e\peflmenr ptots, identified by the big deternination coefficient obiained (IL h,as approximatetv beth,een 73 %Anoiher stand structure model N =
\e
rD was also fomed by Rosmantika (1994 on togged over naiural foresi irr Stagen, Pulau Lalit, South Kalimantan rrhoseR
\.atue obrained rlasbet$?een 66 % and 99,3 % .
Moreover, Krisnawaii (2001)
h
her studyin
Central Katjmantan Iound o11t that a stand structure modei N = N,e rD l\,hich follow /- symbol could be accepred byaI
type groups in every expedmental area, l^.ith its determination cocfficient value as much as 87% to 98.8% Ior Dipterocapaceae type group, and between 98.996 to 99.6% for Non Dipterocarpaceae type $oup, and from98.6% to99.9% for Non commercial type goup, r,,.hile Ior atl other types the rangewasbehveen 98.891, and99.6%.In
this paper, both siand condiiion aJId stand structure were studied based on dara andn
ormation on logged over natural forest stand and primary forest stand. LotSed over naturai foresi stand \^'as iake. fromVegetation Permanenr plot (pup) tocated in logged over blocks which $,ele measured andobse
ed for 5 vears. Meanwhiie, the primaiy foresi srand daia R-ere obtained {rom a pdmary lorest area which belongs to a concession area. The pdmary data $therecl included: data on stand growth and pdmarlr foresr stand strucrure. The standgiol\th
data used s,ere the results of PUP measurement at Annuat Work ptan (RKT) Block 1999/2000whichwas the locationoflogged over area iwo years aso. OI rh€ total PUP area covering 24 hectare; ii lvas only 12 hectare used, consisiing oI rhr€€ pup, namel]., block 4, 5 and 5 which were not given any silviculture tlea irnent. The total area of observatron block was on each 100 m x 100 m (1 ha) blocir comprisint 100 obsen arion p1ot, each o{ whosesize w,as (flat distance)10 m \.10 m. GeoSraphically, PUP was located at 138.42 East longftude and 1'55 SouthLatitude.
Measurement was cafiied out fiom 2001 to 2005 and rvas repeated once a year_ These data were presenied
in
several Diameter class (Phn_D) according ro the type$o!p
with
an interval of 10 cmupwai4
the smallest diameter (Phn D,,) sized 10-20 cm. The division according to the type group was.onducted by Srouping vegetaiion into diptcrocarpaceae, non-dipterocaroaceae, aJId non-conrmercial types respe.tivcly. Such a division was based on the Sroupingpe
ormed by PT. BBU by taking inio account that these rype groups are the major con:imerial type groups on tade.Other supportint data used were PUP report, daia on Producrion
yield
Report (LHp), weather daia, Amual Work Plan (RKT) Book Five Year Work ptan (RKL) Book, and Forest Concession Work Plal1 (RKPM), maps, both financial andTpfl
reports, as well as orher sources that suppori this research. The above data weie iaken h.om the otrseivation on theBase Camp, al1d also inJormation from intenelated institutions.
The componenis aIlanted stand structure d,,nanics consist ofthe number of trees withln a
varietv of diameter class, and type group, by involving srand dynamic etemenrs, such as
ingrowth, upgrowtlr and moitality. The stand sLrucure generat model can be approached with a netative exponenrial equation which were fomulated as follow (Meyer 196i in Davls
N=Nr-N
= Number of uees in every diamet€r classNo
= Constantwhichshows stand density in the smallest diametere
= ExPonential (2.718)k
= Rate of tlee number decline in each tree diameter increaseD
= Centre of diameter classOf all type comPositions in t}le pdmary forest are4 the non diPterocaryaceae tyPe was of the
tlgg""in -U"iir'fl'"
research area, amounring to 39 tvpes,follow€d
byihenon'onmer;l
ty"frs which reached 21 tyPes, and Iinally diPterocaryaceae with 8 tvPes' Some of them are: ,irerbau(rzria
uijuga),iatoa
\PametiasP
,
kenan (Cnnainl
sp)' nvatoh (Pntaquium amboinerse), and resak (Vatica Pap nnn), kerlalrga (Cananga orlorata:)' Dah'r (DracantoneLumed le),meiang(Litsea sp.), and Pala hutan (Mynslica sPP') (HPH
LL
BBU 2001). The tyPs oftrees obsewei not only in logged over area but also in primary forest are dominated by commercial tre€ types ftom Non Dipterocarpaceae group: namely, 57 35 % in primary forests'
and 6s.08 % in theiogged over area- The non comercial tyPes, on the other hand' werc found
in
p
mary Iorests,as;ch
as 30.88%, and 21'28% was found in the logged over area Theiipt".o.urpu."n"
typ". were found approximately 11 76 % and 10'63 % in Primary forests andlogged over area, resPectivelY.
ln
additionto
the standstructue
ctlanges' stand dlrnarnics showed stand behavior' regenemtion ability, hee in.lividualgowth
that suPPots the stand' paticularly alter the d;iturbance. rhe dlnamic ocdns in a stand every iime Period could be obseryed through three main variables; namely: ingrowth, uPgrowtlr andmortality
lngrowth gave a material input in the form of the numb€r of trees in the smallest diameter class, so that it could ad d rhe n;mber of the trees in that diameter. UPgrowtt! however, caused the exit of tree numherin
that particular diameter class, but give inpu r on the number of the trees Ior the above diameterclass. Finally, moriality caused the exit of mateial (rumber oI the tre€s) in one diam€ier 'l a ss
sothatitwould.tecreasethenumbeloftreesinth€diam€terclass'TheProcessofmalerial input (number of trees) among diameter class€s might iead the stand io oP€n'
The result of analysis towards the tlree obsewation blocks in the logged over area was that t}rcre were 47 tree types consisting
of
Dipteroca4aceae Sroup (5 Eeet]"es)'
Non-Dipterocarpaceae (32 tlee tyPes), and non-commercial group (10 tree iyPes)'It was predicted that in average, the entire primary {orest structure Produced an exponential modeias Iollows: Y = 396.31 eI" (4.25), where
P
= 0.83 aIId p =0 003' The result o{ stand prediction with this kind of model was considered to descdbe a clilrlax condition that'ould
be reached in this area or to show the aveGge of primary forest in the
begimint
of foresr management period- Meanwhile, for tlle logged over area, the following model was obta ined: v = zds"r7i-i.+1 ul)a p = 0,004 Rl = 0.82. The prediction on
the stands in both Prima ry natural forest and logged over area was shown in Figure 3.
-
Logg€n over forr
Figute 3. Forest sted stru.ture in rhe resear€h area
A Gro'!.th Model for Uneven Aged Forests
A
growth model is anatual
d].nami. abstraction of one foiest stand includinggrowt]t
mortaliiy, and other changes in the structue and composition of a stand. (Vanclay 1994).
A
grow0r model comprises a series of mathemahc equation that carr also be cormected with a
computer irctument in order to make a model.
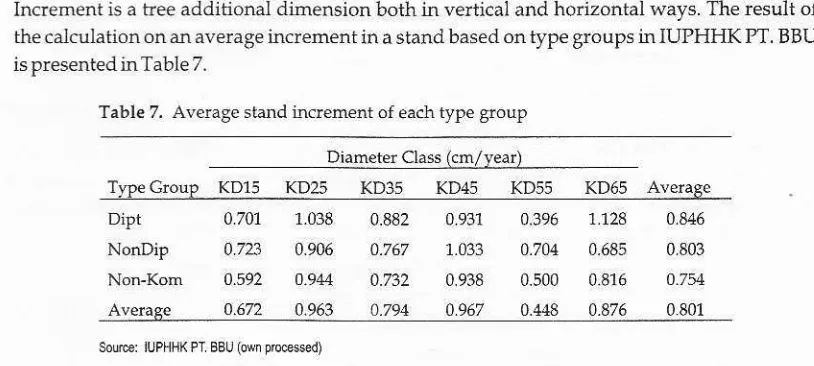
The gowth leads to the addition of dlmension in one or more individuals in a {orest stand at a
cetain period of time (for instanc€, volume growth mrhaiyrr). The yield of a stand is the number of stand dimension drai can be haflested and excreted at a ceitain hme or in a cumulative way ior a specific time (Davis and Iohffon 1984- In an uneven aged stand, yield is a total production along
ce
ain period of time; while growth is the yield of production. Grcwth aIId yield, therefore, have a relation regarding rnathematics: iJ yi€ld is y $en growthis iis derivation; namel, dvldl
The empirical model is categorized into thiee Broups:
namel,
individuai hee models or single tree models, stand class models, and whole stand models (Davis efal.
2001; Vanclay1995, and Tllrland 2004. The individual tree model uses an individual tree as its basis unit
in
arranging the model. The minimum input required in the application of such a model is the list of al1 tree iypes arlanging ihe stand including the measurements on diameter, the height and form of crown. Other models also take into account the stand arrangement that include diameter size, the heighi and the form of crowru spatial position of every tree, the height of the
tee
and the classof
the crown. The approach to the whole stand model describes the condition of the tree or lorest stands by using a littl€ pa rameter (Davis and Johirson 1987). [image:37.502.55.486.25.248.2]managed by selective cutting like TPII, are, among oihers: mortality rate and ingrowth, tyPe identificahon and the acclrrac-v
oI
re-measurcment on every individual tree.ln gowth
exprcsses the increase on the number of tre€s per hectare in the smallest diameter class for acertain penod of time. Meanwhile, up$owth €xpresses addition on the number oI tre€s Per he.tare towards a certain diameter deriving from smaller diameier ctass at a certain pedod of
time.
Finall,
mortality, expresses ihe number of hees per hectarc died in every diameter classdurint
ace
ainp€
od.
The number of trees fixed in every diameter class at a cea.inperiod of time is the accumulation oI
gowth
opporiunity with the Proportion of mortality and the proportion of either ingowth propotion or upgrowth proporiion. The most suitable approach olten used in modeling the uneven aged for€sts at this moment is the siand class models (Vanclay 1995).IngiowttL upgowth and mortality rates
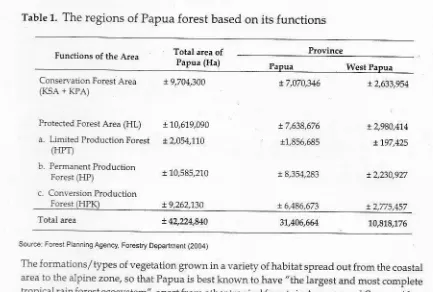
The initial state variable in this stand structure is the number of hees in a diameter class
thn
D6), so that inSrowth is defined as the numbei of logs enterinS Phn D,5. Ingrowth is.expressed in a proportioo symbolized by inrate. Data available are in the forrns of data of
live
[image:38.504.44.457.222.465.2]year measurement, so that inrate used is the average of the Iive year measurement. Table 4 desc bes the result of calculation oI each type group.
Table 4. Iruate of each type Sroup
Iffate
oflive
year measurement (";)200i/2002 2002/2001 200
r/200,{
l00r
200q
^;::T"
0.7667 0.0694 0.0045 Dipterocarp Non-Dipterocarp Non Commercial 0.2667 0.0117
0 0508
o.0278 0.04938 o 0167 0.1143 0.05194 4.0476 0.1439 0.1456 0.0299
Source: IUPHHKPT. BBU (@n prG$en)
Upgolvth is defined as the addition of tlee number per hectare per year in a diameter ctass or
certain growth pllase derived from the smaller diameter class- The shif! to the higher
gowth
level
meansthe
decreaseoI
densilr
in
the ppvious
gowth
level.Upgowth
fordipt€rocarpaceae $oup went up from 25 cm {0.1038) diamet€r class, but then decreased to 55 cm or 0.0096 diameter class. Next, in non dipterocarpaceae $oup, there was an upgrowth iflcrease ftom 15 cm (0.0723) diameter class to 45 cm (0.1033) diameter class, arld also a
Comparc.l to the result
ofstudyinpupHpH
pI. Sumali