This article has been presented at ISTTH 2016 and will be published at Acta Horticulturae
2. Draft Publikasi Ilmiah
Optimized estimation of mangosteen maturity stage using SVM and color features
combination approach
Slamet Riyadi
1a, Afrizal Zuhri
2, Tony K. Hariadi
2, Indira Prabasari
3, Nafi Ananda Utama
3 1Dept. of Information Technology, Universitas Muhammadiyah Yogyakarta, Indonesia
2Dept. of Electrical Engineering, Universitas Muhammadiyah Yogyakarta, Indonesia
3Dept. of Agrotechnology, Universitas Muhammadiyah Yogyakarta, Indonesia
Abstract
Estimation of maturity stage of mangosteen during harvest is critical because it
affects the quality of mangosteen. Currently, the estimation is manually performed
by labor using visual method.
Since the visual method is not precise and
consistent, the use of image processing technology promises a better result. The
objective of this research is to develop an image processing method to optimize
estimation of mangosteen maturity stage by combining Red-Green-Blue (RGB) color
features and implementing Support Vector Machine. The methodology involves fruit
collection, image acquisition and image processing step. In the image processing
step, color features i.e. sum, mean and standard deviation of R, G and B component
were extracted from images. These features were then combined and used as
parameter input for SVM training-testing. The proposed method yielded a
significant improvement on maturity stage estimation and was able to increase its
accuracy up to 91% using combination of nine features.
Keywords: mangosteen, maturity stage, image processing, features extraction, SVM
INTRODUCTION
Mangosteen (
Garcinia mangostana
L.) is a tropical fruit and a major commodity for
Indonesia export. In 2013, mangosteen export contributed about USD 5.73 million which
was the highest contribution of fruit export followed by salak (
Salacca zalacca
) and
mangos. Ministry of Trade, Indonesia, also records about 153% of quantity increment of
mangosteen export or equal to USD 13.70 in January
–
Mei 2014 compared to the same
period in the previous year. Mangosteen from Indonesia have been exported to Thailand
(42%), Malaysia (25%), Hongkong (22.3%), Uni Emirate (3%) and Singapore (2.2%)
(Kemendag 2015). Currently, only about 11% of the total mangosteen products are then
exported whereas the export price could be 5
–
8 times compared to domestic. This low
quantity of export for mangosteen occurred due to the low quality of fruit.
Estimation of maturity stage during harvest is very critical since it affects the quality
of mangosteen. If the fruit is harvested too early before its ripeness, it will not be
perfectly mature. However, if the mangosteen is harvested overripe, it cannot be exported
due to export time constraint (Palapol et al. 2009; Paull & Ketsa 2004). Nowadays,
mangosteen is selected for harvest by means of visual estimation performed by labor.
This maturity stage estimation is not precise and consistent, especially for long duration
a
This article has been presented at ISTTH 2016 and will be published at Acta Horticulturae
and high quantity of harvest. Estimation results in the early morning could be different
with results on the afternoon. Different labor also performs different estimation results.
Various image processing technologies had been proposed to overcome manual
methods performed by labor for any task during harvest and postharvest. Researchers
proposed quality evaluation and grading of fruit and vegetables such as apple (Bennedsen
et al. 2005), star fruit (Abdullah et al. 2006), strawberry (Liming & Yanchao 2010),
orange (Aleixos et al. 2002), papaya (Riyadi et al. 2007a; Riyadi et al. 2007b; Riyadi et
al. 2007c) and potatoes (Barnes et al. 2010). Almost all of fruits inspected are from North
America, Europe and East Asia, where only few tropical fruits are studied (Zhang et al.
2014).
Few researchers reported their results of image processing application to estimate the
maturity stage of mangosteen. Since the maturity estimation is based on skin surface color
of mangosten, all of researchers use color processing to differentiate among the stages.
Color features which are color index of red (R), green (G) and blue (B), were
conventionally correlated to four stages of mangosteen maturity and then yielded 70%
accuracy of maturity stage estimation (Suhandy & Ahmad 2003). Another method
proposed RGB score on three maturity stages and used this score as threshold values to
estimate the maturity stage of sample mangosteen (Sandra 2011). Since these two
methods implemented simple classification technique, consistency of the results highly
depend on the selection of data and threshold score. Selection and combination of RGB
color features are important to uniquely represent the maturity stage.
Advanced classification technique, namely artificial neural network, was then used to
increase the estimation accuracy. This technique used some color features such as mean
of RGB component, hue-saturation-intensity (HSI), energy, entropy, contrast and
homogeneity as parameter inputs for training-testing of neural network (Whidhiasih et al.
2012). Instead of artificial neural network for classification task, a modern method, that is
support vector machine (SVM), is widely used for various applications. The SVM was
implemented to identify skin defect of citrus and performed 96% accuracy for defect and
non-defect fruit (Khoje et al. 2013). This method also had a good performance to evaluate
2-4 objects per second which were moving on high speed conveyor belt (Weyricha et al.
2012). In many cases, the SVM method outperformed the artificial neural network (Shao
& Lunetta 2012).
Estimation of mangosteen maturity stage using image processing method is
promising. Therefore, the objective of this research is to optimize the maturity estimation
by combining features of RGB color component and implementing the SVM. Three RGB
features namely sum, mean and standard deviation of R, G and B component were used
and combined to create features sets. The best combination that produces the best
estimation accuracy was also studied. According to Ministry of Agriculture, Indonesia,
six stages of maturity standard is used in this research.
METHODS
This research was conducted in Laboratory of Postharvest, Department of
Agrotechnology and Laboratory of Advanced Multimedia, Department of Information
Technology, Universitas Muhammadiyah Yogyakarta. It involved several steps i.e. fruit
collection, image acquisition and image processing.
This article has been presented at ISTTH 2016 and will be published at Acta Horticulturae
Mangosteen fruits were collected from a mangosteen farm in Purworejo, Central of
Java, Indonesia. Every mangosteen was then manually classified to the respective stage
according to its color. This manual classification is the ground-truth which will be
compared to the classification by the proposed method. For initial research, a number of
24 mangosteens were selected for further step which are consisting four mangosteens per
stage.
Image acquisition
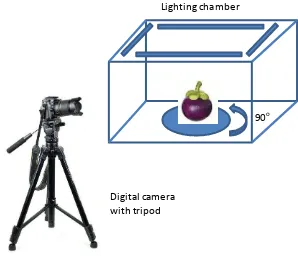
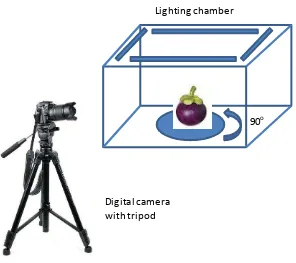
The next step is image acquisition to obtain images of fruit using equipment setup
shown in
Figure 1. A lighting chamber equipped with lamps was used to control and make a
uniform intensity of light. A digital camera was prepared in front of the open side of
chamber. A tripod was also used to adjust position and direction of camera properly. The
fruit was then put inside the chamber and the acquisition of images could be performed.
To obtain the whole surface of mangosteen, the fruit was rotated 90
oand captured every
rotation.
90o Lighting chamber
This article has been presented at ISTTH 2016 and will be published at Acta Horticulturae
Figure 1. Equipment setup for image acquisition consists of lighting chamber and digital
camera with tripod. Mangosteen was rotated 90
oto obtained whole surface
images.
Image processing
Images obtained from the previous step were then processed using Matlab software.
The image processing task consists of two steps, i.e. color features extraction and SVM
training-testing. In the extraction of color features, three features were computed, namely
sum, mean and standard deviation of R, G and B component, or in short SRGB, MRGB
and SDRGB, respectively. It should be noted that every feature related to R, G and B
component. Therefore, the total features produced are nine. These nine features were then
combined to create features sets containing six features (SRGB & MRGB, SRGB &
SDRGB and MRGB & SDRGB) and nine features (SRGB, MRGB & SDRGB). Every
feature set was used as parameter input for SVM training and testing.
RESULTS AND DISSCUSION
From the fruit collection, a number of 24 mangosteens were selected and they
consisted of four mangosteens per stage. In the images acquisition, every mangosteen was
rotated 90
oand captured using digital camera. Therefore, a total of 96 images were
produced from the images acquisition steps.
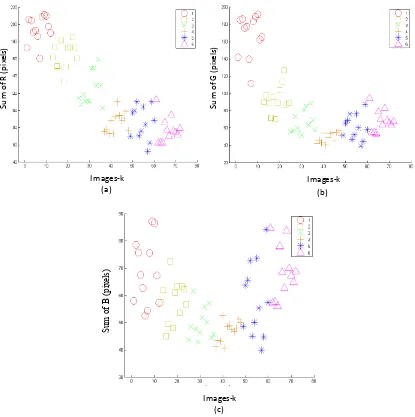
Three features (sum, mean and standard deviation) were computed from R, G and B
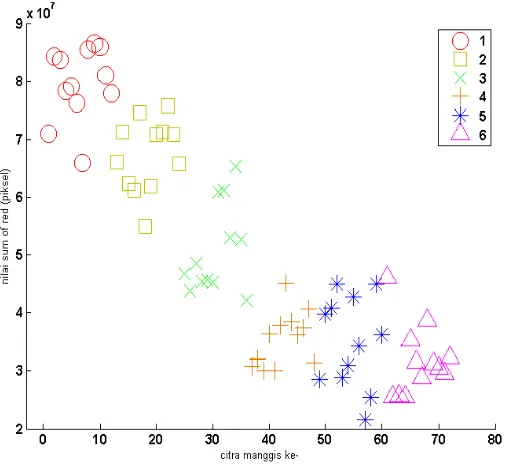
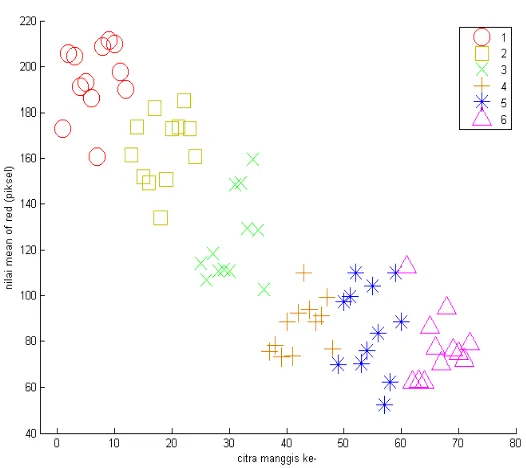
component then produced nine features. For instance, Figure 2 shows scatter plot of mean
of R, G and B component that shows distribution of features for every image. It can be
seen that the scatter plot of features for sum of R and G are similar. These features
produce a pattern that is able to differentiate between stage 1, 2 and 3, while pattern for
90o Lighting chamber
This article has been presented at ISTTH 2016 and will be published at Acta Horticulturae
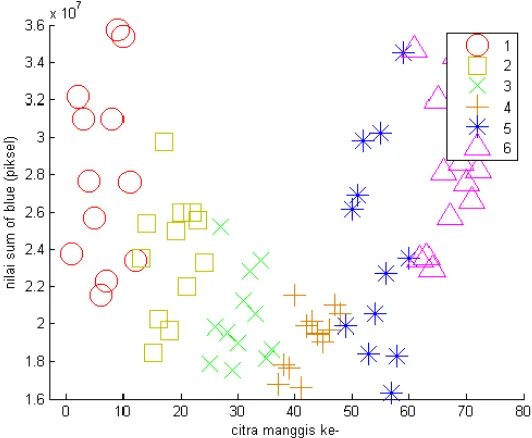
stage 4, 5 and 6 are overlap each other. From Figure 2(c), it can be seen that scatter plot
of sum of B does not indicate good distribution to differentiate among stages. However,
based on RGB color theory, a color pixel does not only depend on one or two color
components but depend on all of three color components. Therefore, all of features are
appropriate for SVM parameter input. Similar discussion is also applied on the sum and
standard deviation of R, G and B.
Figure 2. Scatter plot of mean of (a) red (R), (b) green (G) and (c) blue (B) from the
images
Nine color features obtained were then used as parameter input for SVM
training-testing. A half of the total images were selected as training data and the rest as the testing
data for SVM. Tabel 1 shows the accuracy result of maturity stage estimation for every
features set. It can be seen that the highest accuracy was obtained by combining all of
nine features those are sum, mean and standard deviation of R, G and B component.
This article has been presented at ISTTH 2016 and will be published at Acta Horticulturae
Tabel 1. Accuracy of maturity stage estimation
Features set
SRGB &
MRGB
SRGB &
SDRGB
MRGB &
SDRGB
SRGB,
MRGB &
SDRGB
Accuracy
83%
87%
87%
91%
CONCLUSION
The development of image processing method by combining color features and
implementing SVM classification method to optimize estimation of maturity stage of
mangosteen has been discussed. The color features i.e. sum, mean and standard deviation
of R, G and B component were extracted from images. The combination of sum and
mean, sum and standard deviation, mean and standar deviation and all of nine features
were used as parameter input for SVM training and testing. The result confirmed that the
combination of nine features is able to increase the accuracy of estimation up to 91%.
ACKNOWLEDGEMENT
Authors would like to thank Universitas Muhammadiyah Yogyakarta, Indonesia, for
the research fund (Cluster Research Scheme
–
ABT 2015) and the publication support
(Internationalization Program
–
UMY 2016).
Literature Cited
Abdullah, M. Z., Mohamad-Saleh, J., Fathinul-Syahir, A. S. & Mohd-Azemi, B. M. N.
2006. Discrimination and classification of fresh-cut starfruits (Averrhoa carambola L.)
using automated machine vision system.
Journal of F ood Engineering
76(4): 506
–
523.
Aleixos, N., Blasco, J., Navarron, F. & Molto, E. 2002. Multispectral inspection of citrus
in real-time using machine vision and digital signal processors.
Computers and
Electronics in Agriculture
33(2): 121-137.
Barnes, M., Duckett, T., Cielniak, G., Stroud, G. & Harper, G. 2010. Visual detection of
blemishes in potatoes using minimalist boosted classifiers.
Journal of F ood Engineering
98(3): 339-346.
Bennedsen, B. S., Peterson, D. L. & Tabb, A. 2005. Identifying defects in images of
rotating apples.
Computers and Electronics in Agriculture
48(2005): 92-102.
Kemendag. 2015. Manggis makin laku di luar negeri.
http://www.kemendag.go.id/id/news/2015/07/31/manggis- makin- laku-di-luar-negeri
[6
June 2016].
This article has been presented at ISTTH 2016 and will be published at Acta Horticulturae
Liming, X. & Yanchao, Z. 2010. Automated strawberry grading system based on image
processing.
Computers and Electronics in Agriculture
71: S32-S39.
Palapol, Y., Ketsa, S., Stevenson, D., Cooney, J. M., Allan, A. C. & Ferguson, I. B. 2009.
Colour development and quality of mangosteen (Garcia mangostana L.) fruit during
ripening and after harvest.
P ostharvest Biol. and Tech.
51: 349-353.
Paull, R. E. & Ketsa, S. 2004. Mangosteen. Dlm.
The Commercial Storage of F ruits
Vegetables and F lorist and Nursery Stocks
.
http://www.ba.ars.usda.gov/hb66/092mangosteen.pdf
Riyadi, S., Husain, H., Mustafa, M. M. & Hussain, A. 2007a. Papaya Size Grading using
Centroidal Profile Analysis of Digital Image.
P roceeding of the
6th WSEAS International
Conference on Circuit, Systems, Electronics, Control & Signal P rocessing 2007
, hlm. 347
- 351.
Riyadi, S., Mustafa, M. M., Hussain, A. & Hamzah, A. 2007b. Papaya fruit grading based
on size using image analysis.
P roceeding of the
International Conference on Electrical
Engineering & Informatics 2007
, hlm. 645 - 648.
Riyadi, S., Rani, A. A. A., Mustafa, M. M. & Hussain, A. 2007c. Shape characteristic
analysis for papaya size classification.
P roceeding of the
5th Student Conference on
Research & Development 2007
, hlm.
Sandra. 2011. Image processing application for mangosteen grading with non-destructive
method.
Journal of Applied Sciences Research
7(12): 1890-1894.
Shao, Y. & Lunetta, R. S. 2012. Comparison of support vector machine, neural network,
and CART algorithms for the land-cover classification using limited training data points.
ISP RS Journal of P hotogrammetry and Remote Sensing
70: 78-87.
Suhandy, D. & Ahmad, U. 2003. Development of Image Processing Algorithm for
Determining the Maturity of Fresh Mangosteen.
Buletin Keteknikan P ertanian
17(2):
29-38.
Weyricha, M., Wanga, Y., Winkela, J. & Laurowskib, M. 2012. High Speed Vision Based
Automatic Inspection and Path Planning for Processing Conveyed Objects.
P rocedia
CIRP
2(2012): 442-447.
Whidhiasih, R. N., Guritman, S. & Supriyo, P. T. 2012. Identification of mangosteen
maturity stage based on color using fuzzy neural network.
Jurnal Teknologi Industri
P ertanian
22(2): 82-91.
This article has been presented at ISTTH 2016 and will be published at Acta Horticulturae
Non destructive method for maturity index determination of Garcinia mangostana L using image processing technology
Indira Prabasari1, Nafi Ananda Utama1, Nur Azizah U. Hasanah1, Slamet Riyadi2, Tony K. Hariadi2, Afrizal Zuhri2
1
Faculty of Agriculture, Universitas Muhammadiyah Yogyakarta, Indonesia
2
Faculty of Engineering, Universitas Muhammadiyah Yogyakarta, Indonesia
Abstract
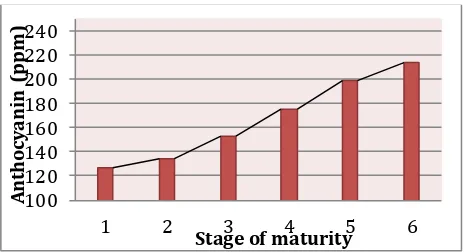
Postharvest maturity index for mangosteen (Garcinia mangostana L) is very important for picking and grading during postharvest processing. Skin color change is the primary maturity index for mangosteen. However determination using human eyes needed many skilled labours and was inconsistent therefore new method in image processing technology using SVM (Support Vector Machine) was employed in this study. Chemical analysis of mangosteen was performed and used as a reference of SVM method. The chemical analysis of mangosteen showed that anthocyanin content increased from 126.20 ppm at stage 1 to 213.98 ppm at stage 6. Reducing sugar content increased from 3.17% at stage 1 to 7.92% at stage 6. The same pattern was found for total soluble solid, an increase from 3.86% at stage 1 to 7.81% at stage 6. Whereas for total acid content and hardness the pattern was the opposite. Total acid conte nt was decreased from 1.78% at stage 1 to 1.06% at stage 6 and the fruit hardness of mangosteen was also declined, showing the number from 4.30 N at stage 1 to 0.69 N at stage 6. For SVM method, image aquisition was conducted for mangosteen images from stage 1 to stage 6, followed by color feature extraction for each stages. The result was trained and tested using SVM and resulted accuracy level of 83.3%.
Introduction
This article has been presented at ISTTH 2016 and will be published at Acta Horticulturae Mangosteen is usually picked when the colour is pink to red across the skin. If it is picked too early the fruit will not be ripe perfectly and it degrades the quality (Tongdee and Suwanagul, 1989; Paull and Ketsa, 2004; Palapol, et al., 2009). The low quality of mangosteen make s the fruit is declined for export purposes and that is a loss for the farmer since the price of mangosteen overseas is about 5-8 higher than the local marketplace (Suyanti and Setyadjit, 2007).
The purplish red color skin in mangosteen is caused by the anthocyanin pigments. Anthocyanin is a pigment found in mangosteen when the fruit is ripe. The identification of man gosteen colour can be measured visually or with destructive analysis using HPLC, Spectrophotometer, GC/MS and other chemical analyzes. Measurement done by human eyes is usually subjective and inconsistent and the measurement can differ from one person to another. Meanwhile destructive method requires the fruit to be destroyed and through stages of complex analysis that take a long time to finish. Therefore it is important to develop a non destructive method in determining the ripeness of the fruit. Mechanical analysis of non destructive ends for ripeness
y olo usi g a eu al et o k NN a d fuzzy al eady idely tested (Riyadi, et.al., 2007a;
Riyadi, et.al., 2007b). Re e tly a e te h i ue has ee de eloped that is suppo t e to
a hi e “VM hi h has a higher degree of accuracy. Testing SVM on mangoes showed very
good results with a 95% accuracy rate (Nandi et al., 2014).
Material and methods
Mangosteen
Mangosteen was obtained from a fruit plantation in Purworejo, Central Java, Indonesia. The fruit was immediately brought to the Post Harvest Laboratory, Faculty of Agriculture Universit as Muhammadiyah Yogyakarta, Indonesia (UMY) and stored at room temperature. Mangosteen was classified based on the maturity level visually and divided into six crite ria of maturity (Standard ASEAN STAN 10; 2008):
Stage 0: yellowish white or yellowish white with 5-50% scattered pink spots
Stage 1: light greenish yellow with 5-50% scattered pink spots
Stage 2: light greenish yellow with 51-100% scattered pink spots
Stage 3: spots not as distinct as in stage 2
Stage 4: red to reddish purple
Stage 5: dark purple
This article has been presented at ISTTH 2016 and will be published at Acta Horticulturae
Method of Destructive Fruit Maturity
Detection of maturity with destructive methods was performed to obtain the reference data of mangosteen maturity.
Extraction of anthocyanin- Methods of extraction and isolation of anthocyanins were modified from Lestario et al. (2011). Mangosteen peel was cut into small pieces then macerated with methanol containing 1% HCl in 1: 4 (w/v) overnight at 5oC. The filtrate was filtered with Whatman no. 1, and partitioned with a separating funnel with the addition of diethyl ether to separate the components of non-anthocyanin (Ozela, et al., 2007). To add polarity in order to separate solvent well, it was added distilled water (filtrate volume ratio: diethyl ether: distilled water = 1: 2: 1).
Total Content of Anthocyanin - Method from Giusti and Wrolstad (1996) was used to determine the total anthocyanin content in the skin of mangosteen. Anthocyanin extract was dissolved in KCl-HCl buffer (1M, pH 1) and NaOAc buffer (1M, pH 4.5) with a ratio of extract against buffer was 1: 5 (v/v). Each solution was measured its absorbance at 520 nm and 700 nm after incubation for 15 min at RT and the results was incorporated into the formula A = [(A510-A700)pH1 - (A510-A700)pH4,5] and calculation was incorporated into the law of Lambert-Bee that A = ε.L.C.
Analysis of Reducing Sugar - Reducing sugar analysis was done used Nelson-Somogyi method. Mangosteen flesh was destroyed and filtered. Sample of 1 mL was added with distilled water up to 10 mL and taken 1 mL to be added with 9 mL of distilled water. Diluted samples was taken 1 mL and mixed with Nelson mixture (Nelson mixture of A and B 25: 1 (v /v)) then heated at 100°C for 20 min. The sample was cooled at RT. Sample was added with 1 mL of arsenomolybdat and 7 mL of distilled water and then shaken. The sample was measured its absorption at 510 nm.
Analysis of Total Soluble Solid (TSS) - TSS analysis was done by destroying the flesh of mangosteen then sealed with a refractometer (Atago, Tokyo, Japan) and calibrated with distilled water.
Analysis Tertitrasi acid (TA) - It was conducted by making a filtrate flesh of mangosteen (5 mL) and titrated with 0.1 M NaOH.
Fruit Hardness Test - Fruit hardness test was done with a hand held penetrometer.
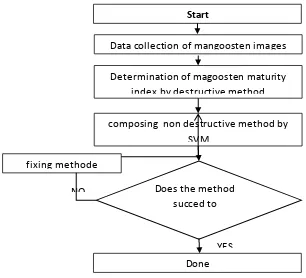
Non destructive methods in detection of fruit maturity by image processing technology
This article has been presented at ISTTH 2016 and will be published at Acta Horticulturae Figure 1: Development of non-destructive method for mangosteen maturity index
The description of each phases of the development of non dektruktif methods for mangosteen maturity as follows:
1. Data collection of Mangosteen - At this stage, mangosteen was photographed to obtain image data of mangosteen maturity from stage 1 to stage 6. The fruit w as photograph using digital camera with 24 mp CMOS sensor in a light box of 60x40x50 cm to create even lighting.
2. Establishing image processing technology method- The process of SVM method began with the extraction of RGB (red, green blue) color features of mangosteen image. RGB features were summed and averaged for each colour and 6 values were processed in the SVM method.
3. Results validation - Validation of the results was done to determine whether the determination of maturity index with SVM method gave accurate results as the destructive method. The data reference was the concentration of anthocyanin content and supporting data including sugar, TSS, TA and fruit hardness test.
Result and discussion
Determination of magoosten maturity index by destructive method
composing non destructive method by SVM
NO
Done
Start
YES fixing methode
Data collection of mangoosten images
This article has been presented at ISTTH 2016 and will be published at Acta Horticulturae
Destructive method in fruit maturity detection
Ripening process of mangosteen from stage 1 to 6 showed an increase in anthocyanin content from 126.20 ppm at stage 1 to 213.98 ppm at stage 6 (Fig. 2). The increase of anthocyanin was reflected in the change of its skin color from stage 1 to stage 6 as shown in Fig. 3. The skin color changes correlated with ethylene production and it was shown by our data on other chemical compound changes we will be discussed later. Studies showed that the development of skin color in outer pericarp of mangosteen was correlated with the increase of cyanidin-3-sophoroside and the cyanidin-3-glucosides during ripening process (Palopol et.al., 2009). Reducing sugar increased from 3.17% at stage 1 to 7.92% at stage 6 during ripening process as shown in Fig. 4, and this indicated glycolysis process where polysaccharides converted into glucose. This finding was supported by the increase of total soluble solids from from 3.86% at stage 1 to 7.81% at stage 6 and the decrease of total acid content from 1.78% at stage 1 to 1.06% at stage 6 as shown in Fig. 4. These phenomenon was affected by the increase in ethylene production during ripening process of mangosteen as suggested by Palopol et.al. (2009). Fig. 5 showed the decrease of hardness from 4.30 N at stage 1 to 0.69 N at stage 6 indicated degradation of pectin in the cell wall, and this also found in other fruit like oranges (Prabasari et.al., 2011).
Figure 2. The increase of anthocyanin content during ripening of mangosteen
Stage 1 Stage 2 Stage 3
100 120 140 160 180 200 220 240
1 2 3 4 5 6
A
n
th
o
c
y
a
n
in
(
p
p
m
)
This article has been presented at ISTTH 2016 and will be published at Acta Horticulturae
Stage 4 Stage 5 Stage 6
Figure 3. Maturity stages of mangosteen during ripening. The skin color changed from yellow green in stage 1 to deep purple in stage 6
Figure 4. The increase of reducing sugar, total soluble solid and total acid during ripening of mangosteen 0 2 4 6 8 10 12 14 16 18 20
1 2 3 4 5 6
P e r c e n t
Stage of maturity
Total Asam Tertitrasi Total Solub le Soli d 0 1 2 3 4 5
1 2 3 4 5 6
H a r d n e ss
This article has been presented at ISTTH 2016 and will be published at Acta Horticulturae Figure 5. The decrease of hardness during ripening of mangosteen
Non destructive methods in fruit maturity detection
The sum of R and G was quite far between stage 1, 2 and 3. When the values were put into scatter plot the pattern indicated obvious group between stage 1, 2 and 3 as shown in Fig. 6 and 7. However in stage 4, 5 and 6 the pattern of scatter plot between stages was slightly overlapped. Meanwhile scatter plot from sum of B did not show distinguish groups particularly between stages 4, 5 and 6 as shown in Fig. 8. All together the result of sum of R, G and B was in line with the result of visual detection (data not shown) that differentiation between stages 1, 2, and 3 was easier than differentiation between stages 4, 5 and 6.
This article has been presented at ISTTH 2016 and will be published at Acta Horticulturae Figure 7. Scatter plot from sum of G (green)
Figure 8. Scatter plot from sum of B (blue)
This article has been presented at ISTTH 2016 and will be published at Acta Horticulturae
together indicated characteristics of grouping of R, G and B and showed that it was possible to be used as a non destructive methods to diffrentiate stages of mangosteen.
This article has been presented at ISTTH 2016 and will be published at Acta Horticulturae Figure 10. Scatter plot from mean of G (green)
Figure 11. Scatter plot from mean of B (blue)
This article has been presented at ISTTH 2016 and will be published at Acta Horticulturae other stages were between 50 and 85%. In summary, the mean of accuracy in detecting mangosteen maturity was 83.3%.
Table 1. Result of training and testing of SVM to detect mangosteen maturity
Stage Sum of image
testing
Sum of images classified correctly
Accuracy of classification (%)
Note
1 8 8 100.0 -
2 8 8 100.0 -
3 8 7 87.5 1 image
classified as stage 4
4 8 4 50.0 1 image
classified as stage 3 meanwhile 3 images classified as stage 5
5 8 5 62.5 3 images
detected as stage 4 whereas 2 images detected as stage 6
6 8 8 87.5 -
Mean of accuraccy in stage detection 83.3
This article has been presented at ISTTH 2016 and will be published at Acta Horticulturae In conclusion, destructive methods showed characteristics of chemical compound changes during senescence and when the same samples were used to examine non destructive methods using image processing technology it showed the accuracy in detecting mangosteen maturity with the level 0f 83.3%.
References
Fu, C., Loo, A.E., Chia, F.P., Huang, D. (2007). Oligomeric proanthocyanidins from mangosteen pericarps. J. Agric. Food Chem. 55 : 7689–7694.
Giusti, M.M. dan Wrolstad, R.E. (1996). Characterization of red radish anthocyanins. J. Food. Sci.
61 : 322-326.
Ji, X., Avula, B., Khan, I.A. (2007). Quantitative and qualitative determination of six xanthones in
Garcinia
mangostana L. by LC–PDA and LC–ESI-MS. J. Pharm. Biomed. Anal. 43 : 1270–1276.
Lestario, L.N., Rahayuni, E., Timotius K.H. (2011). Kandungan antosianin dan identifikasi antosianidin dari kulit
buah Jenitri (Elaeocarpus angustifolius Blume). AGRITECH 31 (2) :93-101.
Nandi, C.S., Tudu, B., and Koley, C. (2014). Computer vision based Mango fruit grading system. International
Conference on Innovative Engineering Technologies (ICIET 2014) Dec. 28-29, Bangkok Thailand.
Palapol, Y., Ketsa, S., Stevenson, D., Cooney, J.M., Allan, A.C., Ferguson, I.B., (2009). Colour development and
quality of mangosteen (Garcia mangostana L.) fruit during ripening and after harvest.
Postharvest Biol and Tech51: 349–353.
Paull, R.E., Ketsa, S. (2004). Mangosteen. In: Gross, K.C., Wang, C.Y., Saltveit, M.E. (Eds.), The Commercial
storage of fruits vegetables and florist and nursery stocks.
Prabasari, I., Pettolina, F.P., Liao, M.L., Bacic, T. 2011. Pectic polysaccharides from mature orange
(Citrus sinensis) fruit albedo cell walls: Sequential exreaxtion and chemical characterization.
Carbohydrate Polymers (84), 484-494.
This article has been presented at ISTTH 2016 and will be published at Acta Horticulturae analysis. Proceeding of the International Conference on Electrical Engineering and Informatics 2007. pp 645-648.
Riyadi, S., Rani, A.A.A., Mustafa, M.M., and Hussain, A. 2007b. Shape characteristic analysis for papaya size
classification. Proceeding of the 5th Student Conference on Research and Development 2007. pp 347-351.
Suyanti dan Setyadjit (2007). Teknologi penanganan buah Manggis untuk mempertahankan mutu selama
penyimpanan. Buletin Teknologi Pascapanen Pertanian Vol. 3 : 66-73.
Tongdee, S.C., Suwanagul, A. (1989). Postharvest mechanical damage in mangosteen. ASEAN
Food J. 4 : 151–155.
Ozela, E.F., Stringheta, P.C. dan Milton, C.C. (2007). Stabi lity of anthocyanin in spinach vine
(Basella rubra)