DOI: 10.12928/TELKOMNIKA.v15i2.3906 686
A Model and Algorithm of Dynamic Map Expression
and its Application
Wanwu Li1, Lin Liu*2, Xuchen Wei3, Jiajing Li4, Zhaohui Liu5 1,2,3,5
Geomatics College, Shandong University of Science and Technology, Qingdao 266590, China
4
Ocean University of China, Qingdao 266100, China 2
Key Laboratory of Surveying and Mapping Technology on Island and Reef, National Administration of Surveying, Mapping and Geoinformation, Qingdao 266590, China
*Corresponding author, e-mail: [email protected]
Abstract
On the basis of summarizing the research results of visual variables, we define six dynamic visual variables of the map symbol in this paper. We analyze the related attributes of dynamic symbols, and then construct a dynamic map expression model based on symbols. A key technology to realize dynamic expression, the key frame transform algorithm is present in the paper. The cartography process of the urban population proportion dynamic change map of the cities in Shandong province are taken as an example to demonstrate the methods and process of dynamic mapping based on the above map dynamic expression theories and models, which includes base map digitization, sorting and processing of attribute data, adding the map elements, the creation of special dynamic effect such as color transform, continuous flashing and object moving, and realization of interactive function. Finally, the paper shows the dynamic map of sea level rising influence on Qingdao, the Typhoon Soulik traveling map and other dynamic map effect at the end of the article.
Keywords: spatial visualization, dynamic expression model, key frame transform algorithm, dynamic visual variable, interactive function.
Copyright © 2017 Universitas Ahmad Dahlan. All rights reserved.
1. Introduction
Map is the second language of geography and a graphical symbol model of geoinformation, which uses ikonic and vivid color graphic symbol to convey the spatial information to people by abstracting the real world correctly and appropriately [1, 2]. Map is also a tool of spatial cognition, and it is the only tool. It can find the spatial existence relationship between the things and the objects in the visual moment [3]. Map in the traditional sense is usually shown in static form, which represents the information of geographic entities at a certain moment in dynamic environment. But objectively, the geographic space is always changing. In addition, the request of the people for refinement, imagery and dynamic of map service rise continuously. Thus the dynamic map expression has become a new form of expression and research content in Cartography. The dynamic map expression is a kind of map expression method [4] that can help to obtain dynamic visual perception of spatial position and attribute characteristic of geographical entity from the view of the user reading maps. And it can use the multi-dimensional visualization model and dynamic map symbols, etc. to express a continuous changing process of geographic entity, ordynamic natural phenomenon and social economic phenomenon [5, 6]. With the development of the computer interaction technology [7] and the improvement of the spatial information visualization theory, the dynamic map expression has been developed and achieved a series of results.
developed within the QGIS software.
However the visual effect of dynamic map expression is restricted by key frames and the number of frames. That is, the more the number of animation frames is given, the more continuous without jumping the visual effect is, but the greater the amount of data is. So the selection of key frame is particularly important. Simultaneously, the existing research results are in the lack of systemic results for symbolic models of dynamic map expression.
2. Materials and Methods
2.1. Construction of Dynamic Expression Model Based on Symbols 2.1.1. Dynamic Visual Variable
Bertin [12] has put forward eight basic visual variables of map symbol, which are shape, size, direction, lightness, density, structure, color and position. In order to adapt to the dynamic map expression and increase the dynamic characteristics of symbols, we define dynamic visual variables of symbol including start time, duration, speedof change, and frequency of change, order of change and rate of change on the basis of summarizing the result [13, 14] of dynamic visual variables. It is important to note that the first four variables are single symbol visual variables and the last two variables are group symbol visual variables. And the end time of the variables can be derived from the start time and duration.
2.1.2. The Dynamic Symbol Attributes
The feature of geographical entity includes four aspects: attribute feature, geometry feature, position feature and topology feature. The geometry feature which includes geometry shapes and size may be sorted in attribute feature with respect to position features, but it is classified as a single item to emphasize the geometry attribute. Dynamic features of geographical entity [15] means to be the changes of the above four features, that is the change feature of attribute feature, geometry feature, spatial position (movement) feature and topological relation feature.
Dynamic visual expression based on symbols is to use graphics snapshot within recognition limit of human eyes to simulate and display dynamic feature of the change and movement of ground entity and phenomenon in a certain period by choosing appropriate time resolution. That is, using the overlap of the eight basic visual variables and the proposed six dynamic visual variables displays the changes of attribute features, geometry features, position features and topology features of geographical entity.
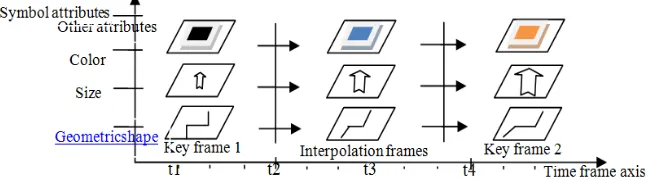
2.1.3. Construction of Dynamic Expression Model Based on Symbols
Figure 1. Dynamic Expression Model Based on Symbols
2.2. Design of Key Frames Transform Algorithm for Dynamic Expression
The transformation mapping among the key frames controls the interpolation generation of the intermediate frame of the symbol [12], which is the key to achieve dynamic symbols expression. The symbol feature of each key frame includes attribute feature, geometry feature, position feature and topology feature. The transform algorithm of the key framesat particular moment is designed based on the dynamic expression model of symbol, which is as following.
Firstly, set C for symbol frame at intermediate moment and judge if there is a time Ti which meets , and if there is no time to meet the conditions, that means the symbol frame C is beyond the change range of the current symbol and cannot generate the intermediate frame. Then calculate the time proportion of the position of intermediate frame
, put it into symbol rate dynamic model , and calculate
the weight coefficient K.
Several typical dynamic models of symbol rate are presented here for the request of different rates:
(1) In the case of symbols changing first rapidly and then slowly, use the symbol rate
dynamic model , and in which the larger “a” is, the faster the symbol changes on early stage.
(2) In the case of symbols changing first slowly and then rapidly, use the symbol rate dynamic model , in which the larger “a” is, the faster the symbol changes on later stage.
(3) In the case of symbols changing at a constant speed, use the symbol rate dynamic model , and where “t” and “K” should meet the following conditions:
Secondly, for the non-geometrical attributes, calculate all the non-geometrical attributes of intermediate frame after getting the weight coefficient Kaccording to the attribute
transformation formula:
For the geometrical attributes, generate the geometrical attributes of intermediate frame C by using two-dimensional Murphy Transformation according to the geometrical attributes of the two frame before and after intermediate frame C: Gigand Gi+1. For illustration purposes, it is thought that the complex graphics can be obtained through the combination of the Euclidean geometry geometric point, line and plane three basic graphics. The intermediate graphic between two different graphics can be generated by the graphics transformation matrix. In the matrix element , i and j represent the original element types two adjacent frames. And their corresponding functions are the corresponding graphics transformation functions.
3. Use interpolation formula separately for each pair of mapping points to get the geometrical attributes of intermediate frame.
3. Experimental Results
Application examples of graphics dynamic expression is stated in the part. We takes the making process of the dynamic change map of the proportion of urban population of cities in Shandong Province from 2000 to 2004 as an example, and introduce the basic method of dynamic map making by Flash MX3.
3.1. Digitization of Base Map
Digitization of the map can use different software. The map digitized using Flash MX3 can be used directly and the map digitized by other software such as ArcInfo、Coreldraw need to be transformed to the format that can be recognized by Flash MX3, then it will be imported to Flash MX3. Create a new movie clip element and named as the "subject" in Flash MX3, import the base map in JPG format into the bottom layerthen load the vectorized maps of cities into corresponding layers and adjust its size and location to coincide with the base map.
3.2. Attribute Data Collation
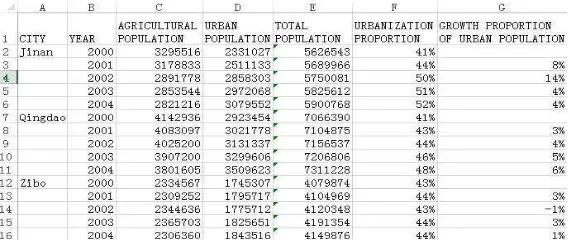
The amount of urban population and rural population of cities in Shandong province five years from 2000 to 2004 is counted and input into Microsoft Excel form. The total population, the proportion of urban population and the chain growth rate in each year are calculated as shown in Figure 2. The numerical range of the proportion of urban population of citiesis also calculated (15%-52%) to reserve.
Figure 2. The table screenshot of urban and rural population of cities in Shandong province in 2000-2004
3.3. Adding Map Elements
1. Adding dynamic title. We put "subject" element into the scene in Flash MX3, and
create a new layer and add the title “Dynamic map of urban population proportion in cities of
Figure 3. Vectorizationof base map after adding map elements
2. Creating and adding the legend. We create graphic element named "ruler" and draw a ratio scale of urbanization by rectangular drawing tool and gradient color tool. In this example, the urbanization proportion scale is divided into 4 big levels and 39 small levels. On the premise of scientificity, the color changes of each administrative region should be taken into account. The colors should not be in the same color gamut, otherwise it makes the whole map into a color and difficult to distinguish the color. And the map should notuse too much color gamut, otherwise too messy. For the other legends such as compass, scale and seat of government, wemay import the existing legend resources into resource library. After creating a legend layer, the needed legend resources will be put into the scene. Finally, we make them suit the maps by adjusting color, size and location.
3.4. The Creation of Special Dynamic Effects
1. Color transformation effect. Taking Jinan city as an example, it surbanization proportion in the five years are 41%、44%、50%、51%、52% respectively. We set the length of animation to 25 frames and insert a key frame for every 5 frames. Each frame corresponds to the change of ayear, and the color of each frame will be set to the corresponding color in the legend of urbanization proportion corresponding year. and then we create shape tween animation to realize the color transformation of administrative region. We create a new layer and a 25-frame long animation, also insert a key frame for every 5 frames and add the digital information of urbanization proportion to the layer. Similarly, we create the dynamic maps of all the administrative regions. The results are shown in Figure 4.
Figure 4. Dynamic map effect
2. Continuous flashing effect. The design scheme is that when the urbanization proportion of an administrative region in a year is higher than the given threshold, make the map flash firstly for attention and then play the subsequent animation. The urbanization proportion of Jinan from 2001 to 2002 in the example rises from 44% to 50%, since we insert the key frame between the eleventh frame and the twelfth frame and set the color transparency of the administrative region at eleventh frame to 60%. In this way, it will generate flashing effect when playing the tenth frame.
way. After completing drag the buttons into the scene on a suitable place. Right click the “play”
button to choose the action option and add the certain codes to the button. The user can realizes the simple interactive control of the dynamic map in this way. So far, dynamic map of urban population proportion in cities of Shandong Province from 2000 to 2004 has been completed.
4. Discussion and Conclusions
Based on the above constructed symbolic dynamic expression model, we adopt the key frame algorithm to select and process the key frames to better balance the visual effects and the amount of data of the dynamic map. And the effect of partial the dynamic maps produced is shown as follows.
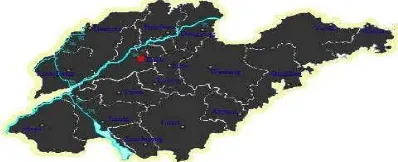
Figure 5. Dynamic map of sea level rising influence on Qingdao
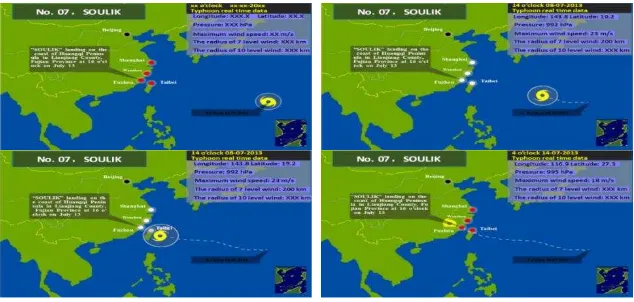
Figure 6. Typhoon Soulik advancing map
greatly expands the application function of the traditional static maps. This paper builds the dynamic map expression model based on symbol and designs the key frame transformation algorithm. Compared with the existing production methods of dynamic map, this result can improve the visual effect of dynamic map expression, effectively carry out the selection and transformation of key frames and reduce the difficulty of key frame selection. On the basis of the above theoretical study, the method and process of making dynamic map using generals of tware are demonstrated in detail by examples. The research in this paper will be beneficial to combine the dynamic map expression with the matic map and 3D expression, and promote the study and application of the matic dynamic expression and three-dimensional dynamic expression.
Acknowledgements
This work was supported by Natural Science Foundation of Shandong Province (NO.ZR2012FM015), Scientific Planning Project of Qingdao Economic and Technological Development Area (NO.2013-1-27), the Key Laboratory of Surveying and Mapping Technology on Island and Reed, National Administration of Surveying, Mapping and Geoinformation of China (NO.2014B08), the Key Laboratory of Satellite Mapping Technology and Application, National Administration of Surveying, Mapping and Geoinformation (NO.KLAMTA-201407). The authors gratefully acknowledge the financial support of the above.
References
[1] Blatt AJ. Technological Changes in Maps and Cartography. Journal of Map and Geography Libraries. 2013; 9(3): 361-367.
[2] Caquard S, Cartwright W. Narrative Cartography: From Mapping Stories to the Narrative of Maps and Mapping. The Cartographic Journal. 2014; 51(2): 101-106.
[3] Zhu XY, Zhou CH, Guo W, Hu T, Liu HQ, Gao WX. Preliminary Study on Conception and Key Technologies of the Location-based Pan-Information Map. Geomatics and Information Science of Wuhan University. 2015; 03: 285-295.
[4] Kleeb R, Gloor P, NemotoK, Henninger M. Wikimaps: dynamic maps of knowledge. International Journal of Organizational Design and Engineering. 2012; 2(2): 204-224.
[5] Li WW, Liu L, Dai HL, Yang XT. Research and Design on Navigation Electronic Map System.
TELKOMNIKA Telecommunication, Computing, Electronics and Control. 2013; 11(2): 285-290. [6] Chen R, Chen CC, Yau BB. Patent Analysis with Innovative Patent Map System. TELKOMNIKA
Indonesian Journal of Electrical Engineering. 2014; 12(2): 917-923.
[7] Shao K, Peter M. Making Advanced Computer Science Topics More Accessible through Interactive Technologies. Interactive Technology and Smart Education. 2012; 9(2).
[8] Dong WH, Ran J, Wang J. Effectiveness and Efficiency of Map Symbols for Dynamic Geographic Information Visualization. Cartography and Geographic Information Science. 2012; 39(2): 98-106. [9] Cheng QW, Zhou L, Cheng HH. Design Method for Dynamic Map Symbols Based on RIA
Environment. Applied Mechanics and Materials. 2013; 321-324: 984-988.
[10] Nossum, Alexander S. Semistatic Animation‐ Integrating Past, Present and Future in Map Animations. Cartographic Journal. 2012; 49(1): 43-54.
[11] Duarte L, Teodoro C, Guerner DAJ, Espinha MJ. A dynamic map application for the assessment of groundwater vulnerability to pollution. Environmental Earth Sciences. 2015; 74(3): 2315-2327. [12] Bertin J. Semiology of Graphics: Diagrams, Networks, Maps. Wisconsin, French: William J. Berg.
1983.
[13] Łukasz H. The analysis of visual variables for use in the cartographic design of point symbols for mobile Augmented Reality applications. Geodesy and Cartography. 2012; 60(1): 19-30.
[14] Li ZL, Ho A. Design of Multi-Scale and Dynamic Maps for Land Vehicle Navigation. Cartographic Journal. 2004; 41(3): 265-270.
[15] Resch B, Hillen F, ReimerA, Spitzer W. Towards 4D Cartography - Four-dimensional Dynamic Maps for Understanding Spatio-temporal Correlations in Lightning Events. Cartographic Journal. 2013; 50(3): 266-275.
[16] Zhou P. Spatio-temporal Data Dynamic Visualization Based on Key Frame Animation. Bulletin of Surveying and Mapping. 2012; 01: 67-69.