FIRST-ORDER ULTRAVIOLET DERIVATIVE SPECTROPHOTOMETRIC METHODS
FOR DETERMINATION OF RESERPINE IN ANTIHYPERTENSION TABLET
Latifah K. Darusman
1,2, Mohamad Rafi
1,*,
Wulan Tri Wahyuni
1,2, and Rizna Azrianiningsari
1 1Division of Analytical Chemistry, Department of Chemistry, Faculty of Mathematics and Natural Sciences, Bogor Agricultural University, Kampus IPB Dramaga, Bogor, Indonesia
2
Biopharmaca Research Center, Institute of Research and Community Empowerment, Bogor Agricultural University, Kampus IPB Taman Kencana, Bogor, Indonesia
Received February 21, 2012; Accepted October 31, 2012
ABSTRACT
A new ultraviolet derivative spectrophotometry (UVDS) method has been developed for determination of reserpine in antihypertension tablets. A first-order UVDS based on the measurement of the distance between peaks to baseline (DZ) at the wavelength of 312 nm was used. Evaluation of analytical performance showed that accuracy as percentage recovery was 99.18-101.13%, precision expressed as relative standard deviation (RSD) was 1.91% and linear correlation was also obtained 0.9998 in the range of 10-50 µg/mL. Estimation of limit of detection and limit of quantitation was 0.8868 µg/mL and 2.6874 µg/mL, respectively. As a reference method, HPLC methods from United States Pharmacopiea (USP) were used. Commercially tablets available were analyzed by the two methods. The content of reserpine in tablets was found 0.2260±0.0033 mg by UVDS and 0.2301±0.0051 mg by the USP methods. The result obtained from the two methods was compared statistically using F-test and t-test and showed no significant differences between the variance and mean values of the two methods at 95% confidence level. This method was faster, easier, low cost and gave result as well as the reference method published by USP.
Keywords:ultraviolet derivative spectrophotometry; first-order derivative spectrum; reserpine
ABSTRAK
Metode baru menggunakan spektrofotometri derivatif UV (SDUV) telah dikembangkan untuk penentuan reserpin dalam tablet antihipertensi. Pengukuran jarak antara puncak ke garis dasar (DZ) pada panjang gelombang 312 nm dari spektrum derivatif orde pertama digunakan untuk penentuan kuantitatif reserpina. Evaluasi kinerja analitik yang dilakukan menunjukkan akurasi sebagai persentase perolehan kembali sebesar 99,18-101,23%, presisi metode yang diekspresikan sebagai simpangan baku relatif (SBR) sebesar 1,91%, dan korelasi linear dengan nilai 0,9998 diperoleh pada kisaran konsentrasi 10-50 µg/mL. Estimasi limit deteksi dan limit kuantitasi diperoleh sebesar 0,8868 µg/mL and 2,6874 µg/mL. Sebagai metode pembanding digunakan metode KCKT dari United States Pharmacopiea (USP). Sebagai sampel digunakan tablet komersial yang kemudian dianalisis menggunakan dua metode tersebut. Kadar reserpine dalam tablet diperoleh sebesar 0,2260±0,0033 mg dengan SDUV dan 0,2301±0,0051 mg dengan metode KCKT USP. Hasil yang diperoleh dari dua metode tersebut dibandingkan secara statistika menggunakan uji F dan uji t dan menunjukkan tidak berbeda nyata untuk ragam dan rerata dari dua metode pada selang kepercayaan. Metode SDUV memiliki keuntungan yaitu cepat, mudah, berbiaya rendah, dan memberikan hasil yang relatif sama dengan metode KCKT yang diterbitkan oleh USP.
Kata Kunci:spektrofotometri derivatif ultraviolet; spektrum derivatif orde pertama; reserpina
INTRODUCTION
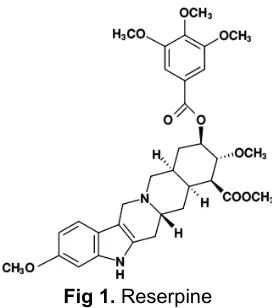
Reserpine (Fig.1.) is an alkaloid derived from the roots of Rauwolfia serpentina which has been used for antihypertension and tranquilizer drugs. It also proposed has protective ability against neurodegenerative diseases, especially Alzheimer’s disease [1]. Many analytical technique have been used for quantitative
analysis of reserpine such as spectrophotometry [2], liquid chromatography-mass spectrometry [3], spectrofluorometry [4], colorimetric [5], photochemically induced fluorescence [6] and high performance liquid chromatography [7].
Fig 1.Reserpine
curve into a derivative. In DS, the information contained in the spectrum is presented in a potentially more useful form and greatly increasing the versatility of the technique [8]. This technique usually improves resolution bands, eliminates the influence of background or matrix and provides more defined fingerprints than traditional ordinary or direct absorbance spectrum, since it enhances the detectability of minor spectral features [9-10]. Although the use of derivative spectrum is not new, it has only become practical in recent years with the development of microcomputer technology, which allows the almost instantaneous generation of derivative spectrum.
As an alternative to the existing techniques, in this work we proposed a fast and simple method for determination of reserpine in tablets based on UVDS. This technique has several advantages such as fast, simple, and inexpensive [8]. It is useful for determining active compound in drugs [11-14]. Furthermore the proposed method was compared to HPLC method published by USP [7] as a reference method.
EXPERIMENTAL SECTION
Materials
Reserpine was purchased from Sigma-Aldrich (St Louis, USA), ethanol and acetonitrile (HPLC grade) were obtained from Merck (Darmstadt, Germany). Ammonium chloride was obtained from Merck (Darmstadt, Germany). Serpasil® 0.25 mg tablets (Biochemie, Indonesia) obtained from local drugs store was used as samples.
Instrumentation
UVDS method was performed on UV-vis spectrophotometer U-2800 equipped with 10 mm quartz cells and connected to an IBM-PC computer, fitted with UV Solutions 2.0 software (Hitachi, Tokyo, Japan). HPLC analysis was performed on HPLC LaChrome Elite
used.
Procedure
Preparation of standard and sample solutions
An accurately weighed 5 mg reserpine was dissolved in warm ethanol (60-65 °C) and stirred for 30 min in the range of temperature 45-50 °C. The solution was transferred to 50 mL volumetric flask and diluted with ethanol. The solution was used as stock standard solution. Serpasil® 0.25 mg tablets were ground and an amount equivalent to 1.25 mg reserpine was accurately weighed and dissolved in ethanol with the same procedure as the standard solution preparation.
Optimization of UVDS parameters
Scan speed, derivative order, smoothing and number of point window were optimized in order to get suitable setting for obtaining derivative spectrum in the quantitative analysis of reserpine by UVDS. Scan speed at 100, 200, 400 and 800 nm/min was evaluated. First, second, and third derivative order; smoothing using Savitzky-Golay method at the level 2, 3 and 4; and number of point window at 7 until 51 with an interval 2 were evaluated too under the optimum scan speed. All the parameters were evaluated using UV solutions 2.0 software.
Calibration curve and sample measurements by UVDS
Working standard solutions at 10, 20, 30, 40, and 50 µg/mL were prepared from the main standard solution. Absorbance of standard solutions was measured at the optimum UVDS condition. The calibration curve was then constructed by plotting the graphically measured amplitude (DZat wavelength 312
nm) from the optimum condition vs. the corresponding reserpine concentration. The sample solution was measured too and concentration of the sample was determined from the calibration curve.
Determination of reserpine by HPLC
Quantitative analysis of reserpine by HPLC was carried out according to the procedures described in USP [7]. The HPLC was carried with a condition as
follow: LiChrosorb RP-18 (250 mm × 4 mm i.d., 5 μm
particle sizes) was used as separation column and acetonitrile and ammonium chloride 1% (1:1) at pH 5.6 as mobile phase with a flow rate 1.0 mL/min and injection volume of 20 L. Before used, the mobile
phase was sonicated and filtered through a 0.45 μm
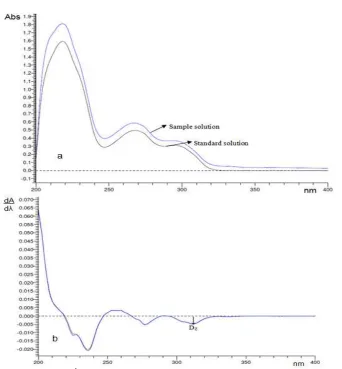
Fig 2.(a) Original spectrum, (b)1D spectrum of reserpine and sample (concentration of reserpine = 25g/mL)
samples solutions. Detection wavelength for detection of the analyte was made at 268 nm.
Analytical performance test
The UVDS method was evaluated for its analytical performance by measuring:
Accuracy. The accuracy was determined by spiking method. Three samples (10, 15, and 17.5 mL) of standard reserpine (100 µg/mL) were transferred to individual 50 mL-volumetric flask, 10 mL of sample solution was added to each volumetric flask containing the standard solutions, and filled to the mark with ethanol. All solutions were prepared in three replicates and analyzed. Recovery of analysis represents the accuracy.
Precision. The precisions of the methods were determined by intraday repeatability, which was evaluated by analyzing 9 samples at the same concentration. Percentage of RSD was representative the precision.
Linearity. The calibration curve was obtained from five concentrations of standard solution in the range 10-50
µg/mL. Each concentration was made in 6 replicates and measured at the optimum UVDS condition. The linearity was evaluated by ordinary least square regression method.
Limit of detection (LOD) and limit of quantitation (LOQ).The LOD and LOQ were determined based on standard deviation and slope of standard curves regression equations.
RESULT AND DISCUSSION
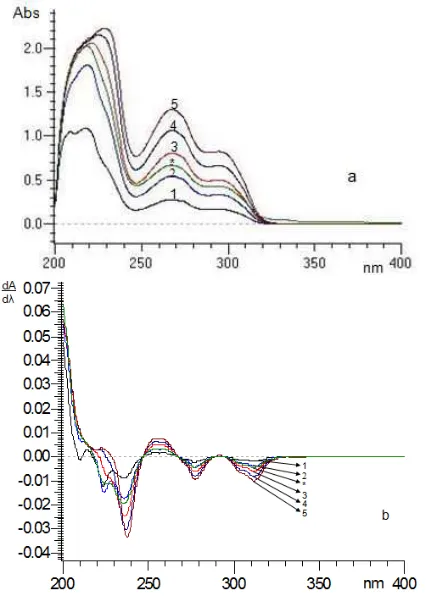
Fig 3. Overlay spectrum of reserpine standard solution with the concentration of 10 g/mL (1), 20 g/mL (2), 30 g/mL (3), 40 g/mL (4), 50 g/mL (5), and sample solution (*) in original spectrum (a) and1D spectrum (b)
Table 1. Calibration data, LOD and LOQ for the determination of reserpine by1D UVDS method
Parameters 1D312
Concentration range (g/mL) 10−50 Correlation coefficient (r) 0.9998 Regression equation (Y)a
Slope (b)
Average of six determinations
Table 2. Accuracy of the 1D UVDS methods for the determination of reserpine
Reserpine (mg)
Added Founda Percentage recovery (%) 1.0300 1.0417 ± 0.0358 101.13
1.6300 1.6167 ± 0.0358 99.18 2.0050 2.0258 ± 0.0036 101.04 a
Average from three determinations
UV-spectrophotometric method can not be used for the determination of reserpine directly at the maximum wavelength because matrix effect of UV-absorbing
have higher absorbance values than the spectrum of reserpine standard dissolved in ethanol at the same concentration as the sample solution. Derivatization was conducted to minimize the interference from absorption due to the matrix sample. The first-order derivative (1D) spectrum of reserpine gave the best alignment between the standard and the sample spectrum in for determination of reserpine. It indicated that the matrix of sample did not disturb the measurement as shown in Fig. 2b.
From the optimization process, we obtained the optimum condition for measurement of reserpine by UVDS. The optimum scan speed was 200 nm/min, this scan speed provided the most narrow spectrum. 1D was chosen for determination of reserpine because in some cases higher order derivatization can reduce signal-to-noise ratio [15] and also make the linearity and sensitivity much worse. Smoothing order and number of point window affected the amplitude and resolution of the spectrum. Small number of point causes narrow amplitude while high number of point gives broad amplitude. The optimum smoothing order was 3 while the optimum number of point window was 27.
Under the described optimum conditions, the calibration curve were prepared by plotting DZ(distance
between peak to baseline) from the1D spectrum values against the concentration of reserpine at the wavelength 312 nm. As shown in Fig. 3, the values of Dz from each reserpine standard solution were
increased linearly with the increasing concentration of reserpine standard solution, so Dz could be used as a
signal to measure the concentration of reserpine in a sample. Excellent linearity was observed in the range
concentration of 10−50 µg/mL with correlation
coefficient (r) was 0.9998 and negligible intercept, confirming the mutual independence of the component derivative signals. The linearity of calibration curve and conformity of the1D measurements to Beer`s law were proved by the high values of the correlation coefficient. The calibration data is summarized in Table 1.
Analytical performance of the UVDS method was performed by evaluating the accuracy, precision, limit of detection (LOD) and limit of quantitation (LOQ). Accuracy was verified through recovery test by adding some known amount of standard to the sample solution. Three standardized concentrations were measured in three replicates, resulting percentage of
recovery in the range of 99.18−101.13% (Table 2).
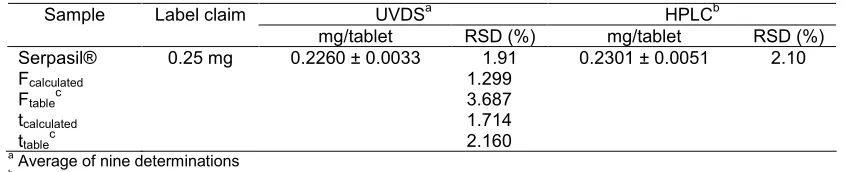
Table 3. Determination of reserpine by 1D UVDS and HPLC method and statistical analysis between the two methods
UVDSa HPLCb
Sample Label claim
mg/tablet RSD (%) mg/tablet RSD (%)
Serpasil® 0.25 mg 0.2260 ± 0.0033 1.91 0.2301 ± 0.0051 2.10
Fcalculated 1.299 aAverage of nine determinations
bAverage of six determinations c
Theoretical value for F and t at 95% confidence level examined from 9 determinations of reserpine in the sample within the same day. A satisfactory precision of the UVDS method expressed by relative small amount of RSD (%) as showed in Table 3. LOD and LOQ were estimated from the calibration curve and showed in Table 1. According to those values, UVDS method is capable to detect concentrations of reserpine in the concentrations above 0.8868 µg/mL, but not precise and accurately. Concentrations values higher than 2.6874 µg/mL of reserpine may be precise and accurate quantified by the proposed UVDS method.
The results obtained from UVDS method was compared with a HPLC method from USP statistically by the student t-test and the variance F-test to determine whether the means and variance of the two methods were significantly different. The student t-values and variance ratio F-values at the 95% confidence level did not exceed the theoretical values, indicating that there was no significant differences between the means and precisions of the UVDS method and HPLC method for determination of reserpine in the samples used (Table 3).
CONCLUSION
First-order UVDS method could be used for quantitation of reserpine in antihypertension tablet. The proposed method is simple and fast and doesn’t require elaborate treatment and not time consuming method. Analytical performance of the method showed a good result, so this method can be used as an alternative method to HPLC for determination of reserpine.
REFERENCES
1. Arya, U., Dwivedi, H., and Subramanjam, J.R., 2009, Exp. Gerontol.,44, 6-7, 462–466.
2. Singh, D.K., Srivastava, B., and Sahu, A., 2004, Anal. Sci.,20, 3, 571–573.
3. Ke, J., Yancey, M., Zhang, S., Lowes, S., and Henion, J., 2000, J. Chromatogr. B, 742, 2, 369– 380.
4. Chen, H., and He, Q., 2000,Talanta,53, 463–469. 5. Adegoke, O.A., Idowu, S.O., and Olaniyi, A.A.,
2007,Trop. J. Pharm. Res.,6, 2, 695–703.
6. López-Flores, J., Fernández-de Córdova, M.L., and Molina-Díaz, A., 2007, Anal. Bioanal. Chem., 388, 1771–1777.
7. United State Pharmacopeia, 2008, United State Pharmacopeia-National Formulary: The Official
Compendia of Standards, United State
Pharmacopeia, Rockville.
8. O’Haver, T.C., 1979, Clin. Chem., 25, 9, 1548– 1553.
9. Kazemipour, M., Noorozian, E., Tehrani, M.S., and Mahmoudian, M.A., 2002,J. Pharm. Biomed. Anal., 30, 4, 1379–1384.
10. Ojeda, C.B., and Rojas, F.S., 2004, Anal. Chim. Acta, 518, 1-2, 1–24.
11. Şatana, E., Altinay, Ş., Gőğer, N.G., Őzkan, S.A., and Şentűrk, Z., 2001, J. Pharm. Biomed. Anal., 25, 5-6, 1009–1013.
12. Lastra, O.C., Lemus, I.G., Sánchez, H.J., and Pérez, R.F., 2003,J. Pharm. Biomed. Anal.,33, 2, 175–180.
13. Ertűrk, S., Çetin, S.M., and Atmaca, S., 2003, J. Pharm. Biomed. Anal.,33, 3, 505–511.
14. Millership, J.S., Parker, C., and Donnelly, D., 2005, Il Farmaco,60, 4, 333–338.
15. Popović, G.V., Pfendt, L.B., and Stefanović, V.M.,