The journal homepage www.jpacr.ub.ac.id p-ISSN : 2302 – 4690 | e-ISSN : 2541 – 0733
Development of Spectrophotometric Method for Iodide
Determination Based on Starch-Iodine Complex Formation with
Hypochlorite Oxidizing Agent
Qurrata Ayun1,2, Hermin Sulistyarti1*, and Atikah1
1
Department of Chemistry, University of Brawijaya, Malang, Indonesia
2
Department of Chemistry, University of PGRI Banyuwangi, Banyuwangi, Indonesia
Corresponding email: [email protected]
Received 7 August 2014; Accepted 24 March 2015
ABSTRACT
Iodine is one of the most important elements for human body. Both, the overage and the deficiency supply of iodine give negative impact for human health. In this research, a simple and inexpensive spectrophotometric method is developed is based on starch-iodine complex formation, where iodide was oxidized with hypochlorite to form iodine, which then reacted with starch to form a blue starch-iodine complex. In this research, the common analytical parameters were optimized regarding to sensitivity and selectivity. It was noted that maximum wavelength for starch-iodine complex was 618 nm, optimum time for complex formation and oxidation was 15 minutes, and optimum hypochlorite concentration was 6 ppm. Under the obtained optimum conditions, the proposed method showed linearity from 0-20 ppm iodide (r2 = 0.994), with limit detection of 0.20 ppm. Determination of iodide with this method was unaffected by Cl-, and Br-; but SCN- affected the measurement of iodide at concentration of 1 ppm. Application to synthetic and urinary samples showed that the proposed method has good agreement with the standard spectrophotometry (leuco crystal violet method), and can be used as an alternative method for iodide measurement.
Keyword: Iodide, starch-iodine, hypochlorite, spectrophotometry, optimization
INTRODUCTION
Iodine is one of the most important elements for human body, in which the excess and the deficiency of iodine supply will give negative impact for human health, such as
hyperthyroidism that causes the body’s metabolic processes take place too quickly and iodine deficiency disorders (IDD) which causes cell–growth inhibition both cognitive and motoric function, hypertension, osteoporosis, and mortality [1,2]. IDD is a set of symptoms or abnormalities are caused by the body suffers from a lack of iodine continuously for long
periods of time, so that it can have an impact on a person’s growth and development [3].
World Health Organization (WHO) recommends spectrophotometry as standard method to determine iodide level based on redox reaction. Iodine is most commonly quantified by measuring the catalytic effect of iodide on the reaction between cerium (IV) and arsenic (III) in the Sandell-Koltoff reaction [7]. This method has quite high accuracy and precision. However this method required complicated analysis steps and some materials are difficult to obtain.
This research develops a spectrophotometry method that is simple and inexpensive while maintain good accuracy and precision. This method is based on the formation of a blue starch-iodine complex, where iodide is oxidized to iodine with hypochlorite as colorless and a relatively strong oxidant [10] prior to reaction with starch. This method is then validated by comparing the results with those obtain from standard leuco crystal violet (LCV) method [11]. The result from both methods was tested using t-student test with 95 % confidence level, to examine whether both methods have no significant difference.
EXPERIMENT
Chemicals and Instrumentation
Materials used for this experiment had analytical reagent grade or as mentioned, i.e.: potassium iodide (KI), starch, H2SO4 (96 %, ρ = 1,84 g/mL), sodium hypochlorite (NaOCl),
citric acid (C6H8O7), ammonium hydroxide (NH4OH), leuco crystal violet, potassium
peroxymonosulfate (KHSO5), ammonium dihydrogen phosphate (NH4H2PO4), mercuric
chloride (HgCl2), and distilled water.
The instrumentations used for the experiment were analytical balance (Adventer AR 2130), oven, UV-Vis spectrophotometer (Shimadzu 1601), pH meter, glassware, pipette volume, Mohr pipette, magnetic stirrer, hot plate, and desiccators.
Reagents and Sample Solutions
Reagents used for spectrophotometric method include stock solution of 1000 ppm iodide, 1000 ppm hypochlorite solution, 1 % starch, 1M H2SO4 solution, citric buffer pH 3.5
and stock KHSO5 solution of 0.01 M. Urine sample of ± 20 mL was placed in plastics bottle
of polyethylene and kept in the fridge at temperature of ± 4 0C; afterwards, each urine sample taken 10 mL, after filtered with Whatman filter paper, each urine sample was added with 0.5 mL H2SO4 and stirred.
Method Optimization
Determination of Iodide in Urine Sample
Iodide solution of 1 mL was placed in 10 mL volumetric flask, then added with 0.1 % starch solution, hypochlorite solution, 5 drops of 0.1 M H2SO4 to adjust solution to pH 1, and
then the solution is mixed and diluted to 10 mL and stand for 15 minutes. Then, the absorbance of blue starch-iodine was read at maximum wave length of 618 nm.
RESULTS AND DISCUSSION
Optimization of the Wavelength of Starch-Iodine Complex
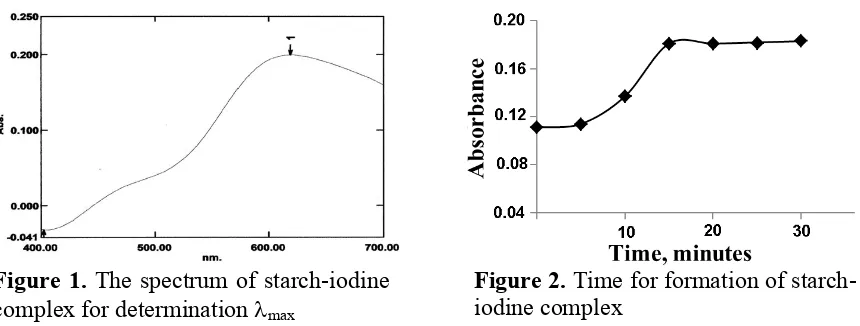
The reaction of iodine with starch solution gave an intense blue-colored product of starch-iodine complex, and the absorption spectra of the blue colored product were monitored at 400-700 nm. Based on the results (Figure 1), the maximum wavelength for the blue starch-iodine complex is 618 nm, and therefore wavelength of 618 nm was selected for the optimal experimental condition and used for further experiment.
Figure 1. The spectrum of starch-iodine complex for determination max
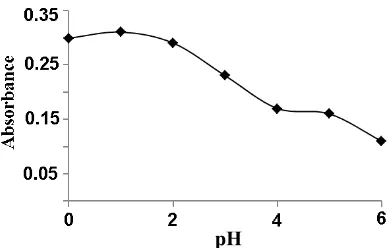
Figure 2. Time for formation of starch-iodine complex
Optimization of Time for the Formation of Starch-Iodine Complex
The time for starch-iodine complex formation was conducted similarly using iodine solution which instantaneously reacted with 0.1 % starch. The absorbance of blue starch-iodine was then monitored from 0-30 minutes (with interval of 5 minutes). The results (Figure 2) showed that the absorbance increase by increasing time with maximum absorbance obtained at 15 minutes and the absorbance was relatively constant by further increasing time up to 30 minutes. Therefore, 15 minutes was chosen as optimum condition for complex formation and used for further experiment.
Optimization of Hypochlorite Concentration
Figure 3. Optimization of hypochlorite concentration
Figure 4. Optimization of pH solution
Optimization of Starch-Iodine Complex Formation
The effect of pH on the absorbance of blue starch-iodine corresponds to iodine species
under solution pH. Most of iodine species is in iodine form under acidic condition (pH ≤2)
resulting in optimum formation of starch–iodine complex. Results of this experiment indicated that under solutions pH of 0-2, the solution exhibited maximum absorbance and the color was stable (Figure 4). However, when the pH of solution was > 2, the blue complex was found unstable shown by decreasing the absorbance. This is because above pH 2 some of iodine hydrolyzed to form hypoiodous (HIO), which perform disproportionation at higher pH to form iodate (IO3-) and iodide (I-) [12]. Thus, the hydrolysis and disproportionation
reactions lower the amount of iodine, and consequently lower the absorbance of starch-iodine. So, in order to achieve high sensitivity for determining iodide, solution pH of 1 was selected as the optimal experimental condition.
Interference Studies
In order to examine the selectivity of the method, the effect of several common ions present together with iodide in real sample, such as chloride (Cl-), bromide (Br-), and thiocyanate (SCN-) were studied. Those three ions have potential reduction standard lower than hypochlorite oxidizing agent used in the experiment. The order of reduction potential standards of those three ions and hypochlorite is as followed: OCl- (E0 = 1.63 V) > Cl- (E0 = 1.36 V) > Br- (E0 = 1.07 V) > SCN- (E0 = 0.77 V) > I- (E0 = 0.54 V). Therefore, the presence of those ions will affect the availability of hypochlorite required for oxidizing iodide to iodine, resulting in the decrease of iodine produced and the absorbance of starch-iodine complex. It is clear from Figure 5 that the determination of iodide with this method was unaffected by Cl- and Br- up to 100 ppm. This is because the potential reduction standards of both ions (chloride and bromide) are close to that of hypochlorite. However, the presence of thiocyanate affected the measurement although only at concentration of 1 ppm, and the absorbance of starch-iodine decreased more significantly at higher concentration. This is because the potential reduction standard of thiocyanate is close to iodide.
Linearity of Measurement
Under the obtained optimum conditions (618 nm, time of measurement of 15 minutes, pH 1, 6 ppm hypochlorite), linear relationship between the absorbance and concentration was
observed at the range concentration of iodide from 0 to 20 ppm. Beer’s law is obeyed and the
concentration in ppm. The correlation coefficient (r2) of the linear calibration is 0.994 and the method exhibited limit detection of 0.20 ppm.
Figure 5. Effect interference ions
Validation Method
Validity of the proposed method was done by analyzing iodide in synthetic and urine samples, and then compared the results to those obtained from the standard spectrophotometry (LCV method). The results obtained were also statistically compared with those from LCV method by applying the student’s t-test. The accuracy of the proposed method is shown by % recovery of iodide, whilst the precision is shown by % coefficient of variants (CV).
Table 1 illustrates a very good agreement between the recoveries of iodide determined by the proposed method and those determined by the standard spectrophotometric method when the proposed method was applied to synthetic samples. The accuracy (shown by % recovery) of hypochlorite method ranges from 95-102 % for synthetic sample, which is close to those obtained from LCV standard method. The proposed method also showed better precision (% CV < 2 %) compared to the LCV standard method (% CV up to 5.55 %).
Table 1. Analysis of synthetic sample
Sample % recovery % CV
Hypochlorite method
LCV method
Hypochlorite method
LCV method
1 102.00 ± 0.1% 94.30 ± 0.10% 1.56 5.55
2 98.50 ± 0.1% 104.25 ± 0.07% 1.27 2.27
3 95.20 ± 0.2% 96.60 ± 0.70% 1.32 1.33
Table 2. Analysis of urine sample
Sample % recovery % CV
Hypochlorite method
LCV method Hypochlorite method
LCV method
1 104.00 ± 0.10% 105.67 ± 0.07% 1.75 3.92
2 101.50 ± 0.17% 104.00 ± 0.01% 2.37 5.89
3 101.00 ± 0.17% 103.40 ± 0.07% 1.93 2.36
variants, CV) of the proposed method (~2.00%) is slightly better than the standard LCV method (up to 5.55%).
Based on the student t-test with 95 % level of confidence, the results obtained from the proposed method when it was applied to synthetic and urine samples gave no significant difference (tcalculated <ttable). Therefore, the proposed method can be used as an alternative
method for determination of iodide in hyperthyroid patient’s urine and other iodide samples
such as food, beverages, and KI tablets which have concentration more than 0.2 ppm.
CONCLUSION
The proposed method provided simple, cheap, accurate, and precise method which can
be used as an alternative method for determination of iodide in hyperthyroid patient’s urine
and other samples containing iodide concentration more than 0.2 ppm.
REFERENCES
[1] Zhang, W., Mnatsakanov, A., Hower, R., Cantor, H., and Wang, Y. Front. Biosci,
2005, 10, 88-93.
[2] Fasli, D., Sumali, A., Gizi dan Kualitas Hidup, 1998, UPI, Jakarta.
[3] Departemen Kesehatan RI, Strategi imobilisasi sosial dalam rangka meningkatkan
Konsumsi Garam Beryodium di Masyarakat, 1997, Dirjen PKM Depkes RI, Jakarta.
[4] Stanbury, J., Pichera, A., Measurement of Iodine Deficiency Disorders, 1996, Oxford University Press, New Delhi.
[5] Zimmermann, M.B., Jooste, P. L., Pandav, C. S., Endocr. Rev., 2009, 30 (4), 376-408. [6] Cavalieri R.R., Iodine Metabolism and Thyroid, 1997, Year Book Medical Publisher,
Chicago.
[7] ICCIDD/UNICEF/WHO, Assessment of Iodine Deficiency Disorders and Monitoring
of Their Elimination: a guide for program managers, Second edition, 2001, Department of Nutrition for Health and Development World Health Organization, Switzerland. [8] Laurberg, P., Cerqueira, C., Ovesen, L., Rasmussen, L. B., Perrild, H., Andersen, S.,
Pedersen, I. & Carlé, A., Best Pract. Res. Clin. Endocrinol. Metab.,2010, 24, 1, 13-27. [9] Jooste, Pieter L., and Emmerentia Strydom., Best Pract. Res. Clin. Endocrinol. Metab.,
2010, 24, 77-88.
[10] Basset, J., Denney, G., Jeffery, H., Mendham, J., Vogel’s Textbook of Macro and Semimicro Qualitative Inorganic Analysis, Fifth Edition, 1978, Longman Scienfic and Technical, London.
[11] American Public Health Association, APHA, Standard Methods for the Examination of Water and Wastewater, 18th, 1999, Washington.