Food Additives and Conta m inan ts
Vol. 27 , No.8 , August 201 0, 1060- 1071
Q
セ@ Taylor &Francis Taylor£..Fra nclsGroupDietary exposure to heterocyclic amines in high-temperature cpoked meat and fish in Malaysia
1 \. ." '" 」L セ@
¥ ?
M.H.A. Jahurul, S. Jinap*, SJ. Ang , A. Abdul-Hamid, P . Hajeb. H.N. Lioet and I.S.M. Zaidul
Cenl er of" Excellence /i)r Food S a/ i' ly Research (C EFS R ) . Fa cultv
0/
Foo d Scien ce and Technology, Universili Putra Malaysia. 43400 U PM , S elango r, Malavsia(R ecci l'cd ]5 janllan ' 20 11!. /il1a l I'crsiun received 2] M arch 20 10 )
The inta ke of hcterocycl ic amin es is influenced by th e am ount and type of mca t and fish inges ted, frequen cy of consumpti o n, cooking method s. cookin g tem pe rature, and du rati on of cooking. In thi s study, the dietary intake o f heterocycli c aminc s in Ma lays ia and th eir main sources were inves ti gated . Fo rt y-two samples of meat and fi sh were anal ysed by hi gh-pe rfo rm a nce liquid chromatograp hy with ph o todi ode array detector to determin e the concent rati o n of th e six predo min a nt heterocycli c amin cs, namely: 2-amino-3-meth ylimidazo[4 ,5-f]q uin ol in e (I Q ). 2-a mi no-3 A-dimet hylimi dazo[4. 5-f lq uino Ii nee 1\1 eI Q). 2-amino- 3,S-dimethylimidazo[4 , 5-flq uin ox alin c (M e l Qx) . 2-amin o-S a LセM エイゥュ ・エ ィ ケ ャゥュゥ、 。コッ { TLUM ヲ@
Jq
uinoxalin e (4,8- DiMeIQx), 2-amino-3 ,7,S-trim eth yl imida w [4. 5-1' Jq uin ox alin e (7 .S- D i Me l Qx). ,1 nd 2·am ino - I -mcth yl-6-phcnylimida zo[4,5-b]pyridinc(PhIP). Di eta ry intak e dat a we re obtain ed lI sing a food-freq uen cy qu es ti o nn a ire wh en interviewing 600 Ma la ys ia n res po ndent s. Th e level of tota l heterocyc lIc a mi ne s in food sam pl es studies ranged fr o m not detected
to 38.7 ng g- I. T he a ve ra ge dail y intak e level of hete ro cycl ic am ine was 553.7 ng pe r capita day- I. The intake of
PhIP was th e hig he st. followed by MeI Qx a nd Ivl eIQ. T he result s revea l tha t fri ed a nd grill ed chicken were the
maj o r di eta ry so urce o f hetewcycl ic am in es ill ivlalaysia . However. the he terocycl ic a mine intake by the' Mala ys ia n po pu lati o n was lo \\'c r tha n th ose repor ted fr olll other reg io ns
Keywords: expos llt'c a,; ses slll cnt: he te rocycli c am in es: co o ked fo od,;
Introduction
Het e rocycli c a mines (HCA s) a re po ss ible human a nd animal carcin oge n s fo nned in cooked m eat an d fi s h during hi g h-te mp e ra ture c ookin g processes (Int e rnation a l A ge ncy for R esea rc h o n Cance r (IARC) 1993). Th e rAR C a lso reported that HCA s such a s R M セ[ ュゥョッ MSL TM、ゥャQャ・エィ ケ ャゥャャャゥ、。 コッ ャT N UM fJquinoline,. (MelQ) , 2-amino-3,8-dime th ylimd azo [4,5-fJquinoxalin e (MeIQx), and 2- a mino-l-meth yl-6-phe-n ylimidazo [4, 5-b) pyridiyl-6-phe-ne (PhIP) are po ss ible huma yl-6-phe-n carcinogens; and 2-am ino-3-me th ylimida zo[4,5-f]-quinoline (IQ) a s a probabl e ca rcinogen. H C A s a lso ca use cancer at a varie ty of multiple sites in lab o ratory a nimal species (EIBa y oum y et al. 1995), Se veral ca se -control studies in various p o pul a tion s h ave repo rted po sitive associati o n s between a highe r intak e of well-coo ked meat and th e risk of co lon cancer (Sinh a e t al. 1999), breast ca nce r (Sinha e t a l. 2000), lun g ca nce r (Sinha 1998) , and gas tric cance r (d e Stefani et a l. 199 8). Hum a n s arc ex p o sed to p o te nti a ll y to x ic s u bstances including natura lly occ urrin g muta geni c and carci n o -ge nic c o mpoun ds . On e's daily di e t lll ay c o nt ai n H C A s a nd polycyclic a romatic hydroca rbon s ( PAH s)
as a
res ult of high-tempe rature processi ng o f m eat a nd fi s h .
Bo t h gro ups a re eas il y found in grill ed and fri ed m eat, p o ultry an d fi s h (Gomaa et al. 199 3; Kaze rouni e t al. 200 I; J iigersta d a nd Skog 20(5), T he present study is foc llsed on H C A s. Fri edman (1996) reported that some H CA s pl ay a n im p o rtant rol e in th e taste, fla vour, a nd eve n s mell o f h ea ted meat. H C A s are form ed by th e pyro lys is of pr o te in a nd amino acids in pro tein-rich food s. Th e ir form a tion depend s on several factor s such a s tempe rature, c ooking method and time, the degree of d o ne ness, th e c oncentration of HCA prec ursors, and th e presence of co mpounds with enhancing or inhib-it o ry e ffects (Felt o n et al. 2000; Busquets et a L 2004) . Th e re has bee n a large variability of estimated intake of di e ta ry H C A s reported from different countries (s uc h as Japan , Singapore , Sweden , Switzerland , Spa in , th e Unit e d Kingdom, a nd the United States). Th e rea so n ma y be due to diffe rent cooking method s, cook in g te mpe rature. duration of cooking, different ques t io nnaire m a ke-up, and th e studied populations . h ッ||G ・ |」セ イL@ fo r th e in ves tigation o f hum a n ca rcino gen s, an a cc ur a te assess m e nt of th e indi vidu a l co ns umption of H eAs is esse nt ia l. U p-t o-dat e . exte nsive research on H CA s has been p e rfo rm ed on th e W es te rn die t (Wakabay a shi et a l. 1992; S kog
199 3;
Kni ze e t al. 1995: Z il11ll1c rli et a l. 2001: Sk og a nd Sol ya kov 2002 ;Jc ッ イイ ・ウセ
ョ、ゥョァ@
a uthor. Emails:jina p @ food.upm.edu .my:sjinap@gmail. co m' Present address : Depa rtm ent of Foo d Science an d T ec hn ology, Bogor Agri c ultura l U niversity, Bogo r, Indo nes ia
ISSN 0265-20 3X pri nt/lSS N 1464- 51 22 o nl ine
ro 10 10 Ta yl or & Francis
DO l: tO I080i]944004 1003801 190
Cantwell et ai. 2004; Llobet et a!. 2006: Domingo et a!.
2007; Marti-Cid et ai. 2007). Fried meat is an
impor-tant source of exposure to HCAs in the Western diet.
Although HCAs are formed at ppb levels (ngg- I),
their intake may be dangerous for human health
because of the total amount of cooked meat or fish
consumed (Busquets et a1. 2004).
This is the first extensive study on HCA exposure in
Malaysia. The analysis of Malaysian foods for the
occurrence of HCAs
is
important because there is
worldwide human exposure to these compounds
according to many reports (Augustsson et a!. 1997:
Byrne et ai. 1998; Kobayashi et ai. 2002; Wong et ai.
2005). The aim of the present study was to determine
the level of major six HCAs - IQ, MeIQ, MelQx, 4,
8-DiMelQx, 7, 8-DiMeIQx and PhIP - in some of the
most commonly consumed foods in Malaysia in order
to estimate the exposure of the Malaysian population
to these toxic compounds. The assessment was
per-formed by combining the content of HCAs in cooked
food samples analysed in the laboratory with
informa-tion on food consumpinforma-tion from the food frequency
questionnaire.
Materials and methods
Study population and questionnaire
A cross-sectional survey was conducted in the central
zone of Peninsular Malaysia covering three locations:
Kuala Lumpur, Putra Jaya, and Selangor state. The
respondents comprised three main races: Malay
(59.5%), Chinese (29.8%), . and Indian (10.2%) , and
other ethl/ie (0.5%), which were almost similar in
proportion to the Malaysian population. A total
sample size of 600 adult respondents aged IS years
and above was selected randomly for the survey. One
adult was chosen to represent the pattern of the whole
household. The sample size was measured by using a
two-staged stratified random sampling method and the
following equation was applied in the sample size
estimation:
1.96
2x P(I -
P)n MMMMセMM
-
de
(I)
where a Z-value of 1.96 for
p=0.05
(95% confidence
level);
Pis the estimated prevalence of the sample equal
to 0.5; and
d
is a margin of error of 0.1 for
±
I 0%.
In the first stage of stratified random sampling, 75
enumeration blocks were selected from living quarters
where each living quarter consists of between 80 and
120 houses. In the second stage of stratified random
sampling, eight households were selected from each
enumeration block. The enumeration blocks and living
quarters for the survey were provided by the
Department of Stati stics Malaysia .
Fo od Additives and Contaminants
1061
Study design and questiollnaire
The questionnaire was divided into three sections:
cooking utensils and cooking methods used at home;
demographic data of the respondent; and dietary
intake. Dietary intake was assessed using a food
frequency questionnaire with a 1-month recall. The
food frequency questionnaire included information on
food items, the frequency of food consumption and the
portion size of food ingested. Before the main survey,
a pilot survey with 60 respondents was performed in
the targeted areas to test question planning in the
qu es tionnaire.
Selection o/food items and samplillg offoods
Food item s were selected based on the literature
publi shed in peer-revievied journals, which included
all type s of piocessed (such as drying and smoking)
and cooked (such a s grilling, roasting and frying) foods
report ed to contain !-leAs . There were in total 42 types
of food item s; three samples were purchased from the
same stall at different times of the day. The selected
meat and fish dishe s for this study were fried fish, fried
chicken (deep-fried), chicken soup , chicken curry,
steamed fi sh. chi cke n cooked with chilli (masak
merah). chicken burger, {ish curry, fried chicken,
keropok kkor , chicken satay. chicken randang, fish
fried in chilli, nu gge t, fish in tamarind (asam pedas
Ikan), paprika chicken, sweet-and-sour fish, sausage,
fish soup , chicken in coconut milk gravy (ayam masak
lemak), fri ed salted fish, fish in coconut milk, chicken
percik
(ayalllpercik), fried beef, beef cooked with
chilli, roasted fish, beef curry, smoke fish, fish in soya
sa uce , beef burger, beef satay, beef rendang, chicken
golek (ayam golek), fish in tauClI sauce, beef soup,
chicken kurma, mutton satay, paprika beef, fish with
three navours , grilled chicken tandoori, mutton curry,
beef in coconut milk gravy (masak lemak daging),
barbecue-grilled chicken, black pepper-grilled chicken,
beef kurilla , and honey-grilled chicken.
Samples of all food items were purchased from
local food stalls in Kuala Lumpur, Selangor, and
Putrajaya. Upon arrival in the laboratory, samples'
bones were removed from the meat and fish , then
samples were homogenized using a Waring blender
(Dawsonville, GA , USA). The homogenized samples
were then pooled and mixed together before being
quarter sampled. The representative samples were
stored at -18
vC until analysis.
Statistical analysis
1062 Af.H.A. Jahllrlll et aJ.
considered to be reliable if Cronbach's alpha was at least 0.7. The descriptive analysis, including the mean, median, mode, standard deviation, and frequency of food taken by respondents, was used to describe the basic features of the data collected from the survey. An independent sample {-test was used to compare the differences between two genders. Analysis of variance (ANOVA) was used to test the differences between different HCAs in different food items. A p
< 0.05 was
considered to be statistically significant.Chemicals
Solvent and chemicals were of both high-performance liquid chromatography (HPLC) and analytical grade. The water was purified in an Elix-MilliQ system (Millipore, Bedford, MA, USA). All solutions were passed through a 0.45-l1m filter before injection into the HPLC system. HCAs standards, i.e . 2-amino-3-methylimidazo[4,5-f]quinoline (lQ), 2-amino-3,4-dimethylimidazo[4,5-f]quinoline (MelQ), 2-amino-3 ,8-dimeth y I imidazo[ 4, 5-f]q uinoxaline (Mel Qx), 2-ami no- 3,4,8- trimethylimidazo[ 4,5-f]quinoxaline (4,8-DiMeIQx), 2-amino-I-methyl-6-phenylimidazo[4,5-b]pyridine (Ph I P), 2-amino- 3, 7 ,8-trimethylimi-dazo[4,5-f]qunoxaline (7,8-DiMeIQx), and 2-a111ino-3,4,7,8-tetramethylimidazo[4,5-f]quinoxaline (4,7,8-TriMelQx) as internal standard, we re purchased from Toronto Research Chemicals (Dowl1sview. ON, Canada). Empty Extrelut-20 extraction cartridges were provided by Merck (Darmstadt, Germany) and Oasis MCX cartridges (3
mli60
mg) by Waters (Milford , MA, USA). MCX cartridges were pre-conditioned with ethyl acetate (2 ml). The solute diatomaceo,us earth refill material was obtained from 1ST (Hengoed, UK).Determination of LOD and LOQ
The limit of detection (LOD) and limit of quantifica-tion (LOQ) were obtained by performing seven deter-minations of the lowest acceptable standard concentration. LOD was calculated as three times the standard of deviation (SD); LOQ was ten times the SD of the average background signal.
RccIJl'er), test
RecO\ery assays were established by spiking known amounts of the matrices (200 and 500 ng g - I sample) of the HCA standard solution to samples. Seven replicates were conducted on each fortified sample. The recovery assays were calculated by comparing the concentration of the fortified samples with those of the unfortified samples.
RCA extraction
The extraction and clean-up of all six HCAs studied was carried out following the modified method of Gross and Griiter (1992) and Messner and Murkovic (2004). Samples
(I
g) spiked with internal standard (4,7,8-TriMcIQx, 250 ppb) were dissolved in 12ml of 1 M NaOH and the suspension was homogenized using magnetic stirring for 3 h with 500 rpm (Heidolph, MR 3001 K). The alkaline solution was mixed with diato-maceolls earth (13 g) , and then transferred into empty Extrelut columas. Ethyl acetate was used as the extraction solvent and elute was passed through the coupled Oasis MCX cartridges. The MCX cartridges were washed with 0.1 M HCI (2 ml) and MeOH (2 ml). The analytes were eluted with 2 ml of MeOH-concentrated ammonia(19/1,
vjv). The sam-ples were evaporated to dryness under a stream of nitrogen and the final extracts were dissolved in 100 pi methanol just before analysis for HCAs. Recovery of HCAs was determined using the standards addition method. The standards mixture (200 and 500 ng g- I sample) was spiked to the chicken, beef, and fish samples before the extraction step. HCAs were sepa-rated using reversed-phase LC and a TSK gel ODS T Mcolumn (25 em x 4.6 mm. 5 11m). The LC systems con-sisted of a Waters LC model 2690 (CA, USA) with a photo-diode array detector (Waters model 2996), equipped with a quaternary solvent delivery system under a Waters Controller model 600, an autosampl er (Waters model 717) , and an on-line vacuum degasser. The mobile phase consisted of solvent A, 0.0 I M triethylamine in water (adjusted to pH 3.3 with acetic acid), and solvent B, acetonitrile (HPLC grade; Merck). Analyses were carried out in a !!radient mode for 33 min. Gradient programming \;as per-formed as follows: at zero to 18 min it was 5% to 23% B in
A,
at 18- 25 min it was 23% B inA,
and at 25--33 min it was 23% to 25% B in A. The flow rate of the mobile phase was I ml min - I.Estimated dai{.v intake
The estimated daily intake levels of HCAs by an adult (ng day - I per capita) were calculated using the average of each meat and fish product, i.e, (Hajeb et a!. 2009):
Daily intake per person per day]
= mean concentration (ngg - I) of HCAs x amount of meat and fish products consumed per day (g per capita)
Results 'and discussion
Table I. Socio-demographi c chara c te ri stics of respondents.
Demographic profil e Frequency %
Gender
Male
303
50.5
Female
297
49.5
Elhniciry
Malay
357
62.5
Chinese
179
29.8
Indian
61
10.2
Othe rs
3
0.5
Age group (rears )
18- 24
130
22.2
25-29
9 1
15.2
30-34
64
10.7
35- 39
64
10.7
40--44
67
11.2
45--49
52
8.7
50- 54
48
855- 59
30
5
6064
233 "
.065- 69
20
3.3
セWP@ II 1.8
Educa r ion /('1'1'/
Uneducated
21
3.5Primar y sc hoo l
74
12.3
Seco nd ary scho ol
280
46.7
College
105
17. 5
Bachelor deg ree
80
13.3
Postgrad uCJt e
14
2.3
Others
20
3.3Carccr categories
Government se r va nt 56
9.3
Pri va te sec to r
185
30.8
Self-employed
78
13
Farm er I
0.2
Student
96
16
Hou sewife
129
21.5
Oth e rs
55
8.3HOl/se/wId income .'
::,,1000
101
16.8
1000- 1999
131
21.8
20002999
140
23.3
3000- 3999
79
13 .2
4000--4999
61
10.2
:::5000
88
14.7
Frequency of" earillg OUI
Everyday
104
17.3
On ce a week
n
13
Two to three times a week 133
22.2
Two to three tim es CJ mont h
10 2
17
Once a month
136
22.7
Others
47
7.8
Cooking urensils
Stov e
592
98.7
Mi c rowa ve
265
44 .2
Oven
22 1
36.8
Grilled-stove
XO
13.3
Grill ed charcoal
64
10.7
Othe rs 23 3.8
( con lil1ued)
Food Additives and Contaminants
1063
Tabl e 1. Continued .
Demographic profil e Frequency %
Cooking merhod
Stir-fried
394
65.7
Dee p-fried
248
41.3
Boiling
204
34
Baking
200
33.3
Grilled
249
41.5
Roasted
255
42.5
Tabl e 2. R eliability summary of food frequency
que stionnaire.
Variabl e
Food consumption frequ e ncy Food consumption portio n size Buy o r coo k th e fo o d s Pla ces of fo od avail a bility
Cronbach's Alpha
0.730
0.634
0.902
0.840
The percent age for ma le respondents was 50.5% ; for
female res pondents it was 49.5%. There were 59.5%
Malay respondent s, 29.8% Chinese, 10.2% Indian,
a nd 0.5°;;, of other ethnic (Table I). Overall, the
cook ing method fa pparatus of respondents was mostly
by stove (98.7 % ), followed by microwave (44.2%) and
oven (36.8 % ). The hi gher usage frequency of stove,
mi crowave a nd o ven was probabl y due to their
con ve llience. A gri lied stove ( 13.3
%)and grilled
charcoal (10.7%) were used less by respondents. On
the other hand , th e mos tly used type of cooking was
stir-fried (65.7 % ) followed by deep-fried (41.3%),
boiling (34 % ) and baking (33.3%). This fact showed
that respondents preferred to consume fried foods
HウエゥセGMヲイゥ・、@
and deep-fried) rather than other types of
food (Table I) . HCAs are toxic compounds formed
during grilling and frying of meat products in oil
(Jagerstad et al. 1998). The gri lli ng/ barbecuing method
of food preparation has been shown to produce
significant level of HCAs (Keating and Bogen 2004).
In the United States, Sinha et al. (1995) reported the
highest level of PhlP in pan-fried or grilled/barbecued
chicken samples. In that study, grilled/ barbecued
chicken contained the highest levels of PhIP ranging
from 27 to 480 ngg - ' and pan-fried chicken contained
PhIP ranging from 12 to 70ngg-
1In other studies in
[image:4.602.96.458.108.737.2]r
1064 M.H.A. Jahuru/
et
al
(A)0.10-,--- -- - -- - - ,
0.08
0.06
:::l <{
0.04
Q
0. 02
1
)
0.00
x
a
xwQ :;;:
'"
(5 セ@ ' 0 <Xl ,
セ@ 」ッ セ@
I'-x
Q
(L
:r
(L
16.00 1800 20.00 22.00 24.00 26.00 28.00 30.00 32.00 34.00
Minutes
( 8 ) 0 . 1 0 . . - - - ,
008
0.06
0.04
Q
'"
セ@
x
'"
a
a.,w
,..: (L1
"
:r (L0.02
000
16.00 18.00 20.00 22.00 24.00 26.00 28.00 30.00 32.00 34.00
Minutes
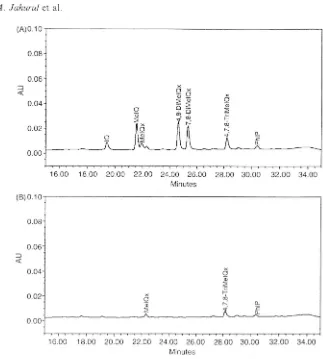
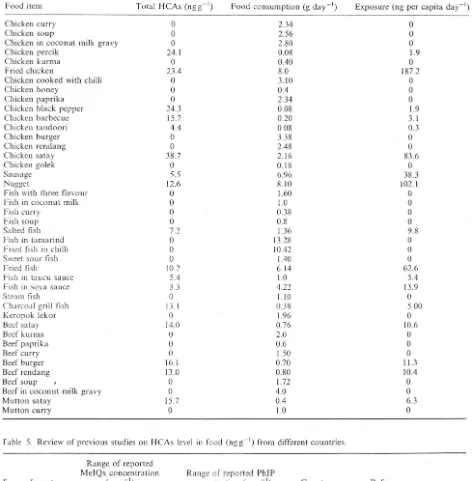
Figure I. Repre sentati ve HPLC · PDA chromatogram ora grilled chick e n salay samp le : (A) spiked and (8) unspiked. Results for
thi s sample were MelQx = 81 ngg··1 and PhlP = 30 .6 ng g -I Peak s were detected at 265 nm.
ReliabiHty was used to measure the internal
consis-tency of the study. It was measured based on the
numerical
coefficient
01'
reliability,
which
was
Cronbach's alpha (Table 2). The results given in Table
2 showed that the highest values of Cronbaeh's alpha
were 0.902 and 0.840 for methods and for places of food
availability, respectively. These were followed by 0.730
and 0.634 for food consumption frequency and portion
size, respectively. In this study , all values ofCronbach's
alpha were
セPNV@where they were all accepted in
exploratory factor analysis and also supported the
reasonable internal consistency of variables. Therefore,
the results yielded satisfactory intcrnal consistency
(coefficient alpha) reliabilities for the related variables.
The results of the food-fr equ ency questionnaire
revealed that the most popular food \\as fried fish
(72.83 %) and deep-fried chicken (68.67%) , followed
by chicken soup (57.67(Yo) and chicken curry (56.50%).
These findings showed that fish and chicken were the
food items of choice for most respondents and that
they may impose a risk of contaminants from
high-temperature cooked foods.
The sample clean-up by tandem SPE using Extrelut
and Oasis MCX was sLlccessful and yielded one
fraction of HCAs, which wa s subjected to further
determination by HPLC. Furthermore, the applied
HPLC method provided a good separation of HCAs
that make the quantification of each HCA clearly
possible. Figure I shows a representative
chromato-gram on the basis of identification and quantification
of individual HCA compounds. The identification of
the HCA compounds found in a sample is based on
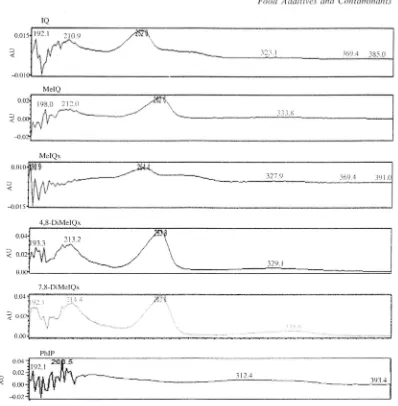
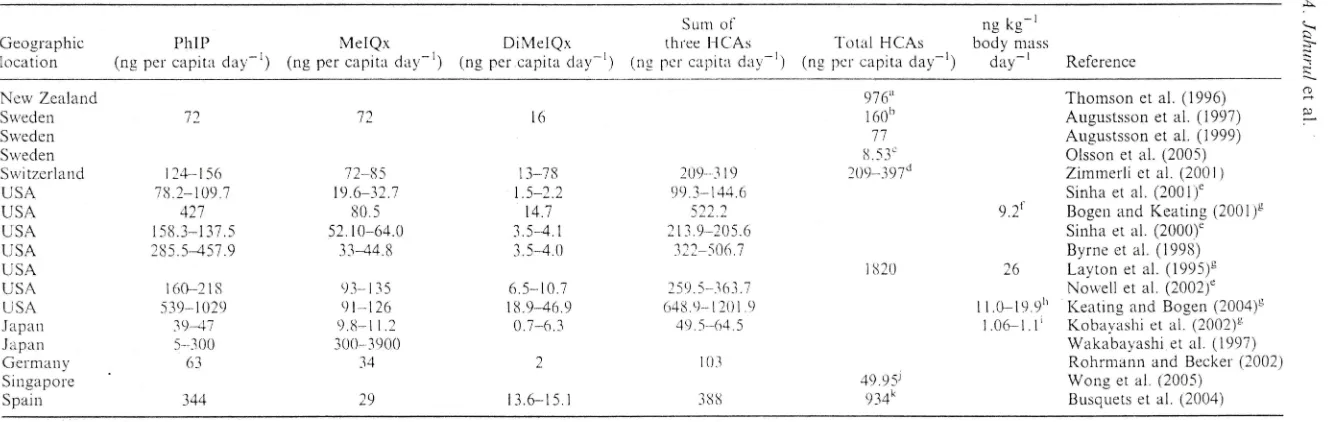
their retention times and UV spectra. Figure 2 shows
the UV spectra of the six authentic HCAs in sample
spiked by FICA standards. All spectra observed in
sampl e analysis were in good concordance with the
spectra of the authentic compounds.
The detection limits of" HCAs were: IQ, 1.5 ngg-
l ; [image:5.597.148.471.77.436.2]Food Additives and Contaminants
1065
IQ
001,1921 2 iOll Lセ L@
セ@ セ@
| セ
Lセセ⦅Z
GセR セ⦅ャ L@
__
セ@
_ _ ...
3..;:.;:69),.;.:..-..4;.;;:J 8:.;;;;5'O....".j-{)Oll,/i-...:... _ _ _ _ _ _ __ _ __ _ _ _ _ _ _ _ _ _ _ _ _ _ _ _ _ _ _ _ _ _ _ - . l
Me lQ
0,02
19iUl 2 :2U
::J
セ@ 0.0
-{l.O " -_ _ _ _ _ _ _ _ _ _ _ _ _ _ _ _ _ _ _ _ _ _ _ _ _ _ _ _ _ _ _ _ ....,.J
-O()15 ... ⦅セ@ _ _ _ _ _ _ _ _ _ _ _ _ _ _ _ _ _ _ _ _ _ _ _ _ _ _ _ セ@ _ _ セ@ _ ___..J
4, 8-DiMe IQ x
329.1
]
7,8-DiMcIQx
PhlP
Figure 2. UV spectra of HCA standard s found in spiked sam ples.
recoveries of spiked samples demon strated the
accu-racy of the method s used in th e study.
Table 3 shows the six HCA s detected in the
analysed food sa mples. There was a significa nt
differ-ence (p
<
0 .05) in the amount of' the six HCA s between
the different food s studied. PhlP was the most
com-monly found HCA (24%1), followed by MeIQx (23%)
and MeIQ (12 %) in the st udi ed food items. Very lo w
level s of 4, 8-DiMclQ x and 7,8-DiMeIQx we re detected
in th e samples. The hi ghes t level of tota l HCAs wa s
found in grilled and fried dishes, i. e. grilled chicken
sa ta y (38.7 ngg - I).
followed
by
grill ed chick en
black pepper (24.3 ng g-I), g rilled chicken perci k
(24.1 ngg- I) and s tir-fried
chicken (23.4ngg- ' ).
The higher levels of HCA s found in grill ed chicken in
thi s st udy may be due to the cooking meth od s,
temperature and cooking tim e, a nd a lso the precursors
s uch as amino acid , sugar , crea tinin e and moisture
content of the chi cke n. The hi gh level of HCAs in
grilled a nd fri ed foods are pro babl y beca use these
fo od s were cooked uSin g high
temperature of
125- 25WC (Busqucts et a1. 2004) and for relatively
long periods of 20-40 min (Keating and Bogen 2004).
Therefor e, a more frequent usage of the stove for
fryin g m ay expose peop le to hi gher concentrations of
HCAs. In th e prese nt s tud y. the food sa mples for
a na lysis were purchased from different restaurant. At a
loca l food sta ll or resta urant th ere could be a
signif-ica nt va riation in cooki ng ti me. as wel l as th e
temper-ature of m ea t and fish products sol d betwee n one
restaura nt and another.
[image:6.595.120.518.82.488.2]1066
M.H.A. lahurul
et a l.Table 3. HCA s concen trations in meat and fi sh sa mpl es (ngg - I).
Food item
Chicken curry Chicken so up Chicke n in milk gravy C hicke n percik Ch icke n kurma Fried ch icken
Chicken cooked with c hilli Ch icke n ho ney
Chicken paprika Chicken bl ack pep pe r Chicken ba rbecue C hi c ke n tandoori Chicken burger C hicke n re ndang Chicken sa ta y Chicken go le k Sausage Nugget
Fi sh with three flavour Fi sh in milk gra vy Fi sh curry Fish so up Salted fi sh F ish in tamarind Fried fish in c hill .i Sweet so ur fi sh Fried fi s h
F ish in tauc u sa u ce Fish ill soya sa uce Steam fi sh Charcoal gr ill fish Keropok Iekor Bee f sa tay Beef kurma Bee f paprika Bee f c urr y Bee f burge r Bee f re ndan g Beef so up
Bee f in coco nut milk Mutt on salay Mutton curry
Noles: n .d .: Not detecte d.
Cook in g method IQ
Boiled n.d.
Boile d !l .d.
Boiled n.d.
Grilled n .d .
Fried cooked n.d .
Stir fried n.d.
Fried /cooked n .d.
Grilled !l .d .
Fried/cooked n .d.
G rilled n.d.
Grilled n.d.
Grilled n.d .
Fried Il.d .
Boiled Il.d.
Grilled n .d .
Boil ed l1.d .
Fried Il.d.
Fri ed n.d.
Boiled n .d .
Bo il ed n .d.
Bo iled Il .d .
Boiled n .d.
Fri ed n.d.
Fried /cooked n .d .
Fried /coo ked n.d .
Fried /coo ked n .d.
Deep fri ed n .d.
F ri ed/coo ked n .d.
F ri ed /cooked n .d.
Steam n .d.
Grilled n .d .
Fried n.d.
Grilled n.d .
Bo il ed n.d.
Bo il ed n .d.
Boiled n .d .
Fri ed n .ci.
Fri ed/cooked n .d.
Boikd n .d.
Boiled n.d .
Grilled n.d .
Boil ed n .d.
MeJQ n.d . n.d . n.d. n.d . n.d. n.d. n.d. n.d. n.d. n. d. n.d. n.d . n.d. n.d . n.d. n.d. n.d. n.d. n.d. n.d. n.d. n.d.
2.4
n.d. n.d. n.d.1.4
3.8 3.3 n.d . 1.6 n.d. n.d. n.d. n.d. n.d. n.d . n.d. n.d. n.d. n.d. n.d.M e lQ x
n.d . n.d . n.d. 14 .5 n.d .
23.4
n.d.n .d .
n.d .
24.3 4.2
n.d.
n. d. n .d . 8. 1 n.d. S.5 n .d. n.d. n.d. n .d. n .d. n.d. n.d. n.d . n.d. 8.8 n.d. n.d . n.d. 1.7 n.d. n.d. n.d. n.d. n.d. n.d. 12.3 n.d. n.d. 1.5 n.d.
4 ,8 -DiM e IQx
n.d. n .d. !l.d. n.d. n .d. n.d . n.d. n.d. n.d. n .d. n. d. n.d. n.d. n.d . n.d . n.d. n. d. n.d. n.d. n .d. !l.d . n. d. n.d . n.d . n.d . n.d. n.d . !I .d. !I.d . n.d. 0.5 n.d . 0 .7 n .d. n.d . !I .d. !l .d. 0.7 n .d. !l .d. n.d . n.d. 7,8 -DiMeIQx
!I .d . n.d . !l.d. n.d. n.d. n.d. n.d . !I .d. n.d. n.d. 1. 6 n .d. n.d . n.d. !I .d. n.d. n.d. 1.5 !I .d. !l .d. !I .d . n .d. n .d .
n.d. n.d . n.d . n .d. 1. 6 n.d. n.d. 0.9 n.d. n.d . n.d. !l .d. n .d. 1.0 n .d. n.d .
n .d . !l .d. n .d. P hlP n.d . !I.d. n .d. 9.6 n.d. n.d . n.d .
n .d . n .d. n .d. 9.9
4.4
n.d. n.d. 30.6 n.d. n .d 11 . 1n.d. n.d. n.d. n.d. 4.8 n.d. n .d. n.d. n.d . n .d. n.d . n .d. セ a@ n .d. 13.3 n .d .
n.d. n.d. 15. 1 n.d. n.d . n.d. 14. 2 !I .d. Total n.d . !I.d . n.d. 24.1 n .d. 23.4 n.d. n.d. !l .d. 24.3 15.7
4.4
n .d. !l .d. 38.7 n.d. S.5 12.6 n .d. n .d. Il .d. n.d. 7.2 n .d. n.d. Il .d. 10.2SA
3.3 n .d. 13.1 n.d .14.0
n.d. n .d. Il.d .16. 1
13.0 n.d. n.d. 15.7 n.d.Valu es belo w the limit of detection (LOD) a re calcula ted as Ongg-1 LODs of: IQ = 1.5ngg- ' ; M eIQ = 0.5ngg-l ;
M e lQx =0 .3 ngg-l ; 4 ,8 -DiMeJQx = 0.5 n gg- I; 7,8-Ditvle IQx = 0.9 ng g-l ; and PhlP = 1.5 ng g- I.
middle-aged (18- 34) or olde r (more th a n 55) genera ll y consume more meat a nd fi sh compa red with other groups of res pondents. On average, Malaysians con-sum ed 104.16 g of meat and fi sh di shes per da y. W o ng et al. (2005) reported th e ave rage d a il y intake of 108 .7 g da yl for a ll meat t y pes in Sin ga pore. Oth er popula tionba se d surveys ha ve re ported the dail y cons u mp -tion of meat from 80 to 160 g da y-l in the Un ited Sta tes , Swed en, New Zea la nd , and J a p a n (Allgllstsson et al. 1997; By rn e e ( al. 1998 ; K o ba yas hi e t a l. 2002; Ferguson 2002). Data fr o m th e present stu dy sh ow tha t food s contributing t o th e in take of
HCA s in Malaysia are simi la r to those found in Western countries.
[image:7.600.85.540.111.537.2]r
Food Additives and Contaminants
1067
Table 4. Mcan daily intake of HCAs from meat and fish (ng per capita day-I) in Selangor, Malaysia.
Food item Total HCAs (ngg - I) Food consumption (g day-I)
Chicken curry Chicken soup
Chicken in coconut milk gravy Chicken percik
Chicken k urma Fried chicken
Chicken cooked with chilli Chicken honey
Chicken paprika Chicken black pepper Chicken ba rbecue Chicken tandoori Chicken burger Chicken rendang Chicken salay Chicken golek Sausage
Nugget
Fish with three flavour Fish in coconut milk Fish curry
Fish soup Salted fish Fish in tamarind Fri ed fish in chilli Sweet sour fi s h Fried fish
Fish in tauCll sauce Fish in so ya sauce St ealll fi s h Charcoal grill fish Keropok lekor Beef satay Beef kurma Beef paprika Beef curry Beef burger Beef rendang Beef soup
Beef in coconut milk gravy Mutton satay
Mutton curry
o
o
o
24.1o
23.4o
o
o
24.3 15 .7 4Ao
o
38.7o
5.5 12.6o
o
o
o
7.2o
o
o
10.2 5.4 3.3o
13 . 1
o
14 .0o
o
o
16.1 13.0o
o
15.7o
2.34 2.56 2.80 0.08 0.40 8.0 3.10 0.4 2.34 0.08 0.20 0.08 3.38 2A8 2.16 0.18 6.96 8.10 1.60 1.0 0.38 0.8136
13.28 10.42 1.40 6. 14 1.0 4.22 1.10 0.38 1.96 0.76 2.0 0.6 1.50 0.70 0.80 1.72 4.0 OA 1.0fable 5. Review of previous studies on HCAs level in food (ngg-I) from different countries.
Range of reported
MeIQx concentration Range of reported
PhIP
(ngg-I) concentration (ng g-I) Country
rypes of meat
3eef 0- 1.5 0 -6 Switzerland
073 032 USA
0.2-1 .3 0 .8-2.0 USA
0.72.9 0.64. 8 Spain
0- 7.1 0 - 30 USA
01.9 019 USA
: hicken 0- 1.8 0- 327.6 USA
00.3 2.346.9 Spain
0-9 6- 41\0 USA
0 0 -2 .5 Switzerland
0--0 .6 0.0210 Sweden
'i s h < 1- 5 0- 73 Switzerland
0--0 .5 0-4.9 Switzerland
0- 0.9 < 001-22 Swed e n
Exposure (ng per capita day-I)
o
o
o
1.9o
187.2o
o
o
1.9 3.1 0.3o
o
83.6o
38.3 102.1o
o
o
o
9.8o
o
o
62.6 5.4 13.9o
5.00o
10.6o
o
o
11.3 lOAo
Referenceo
6.3o
Zimmcrli ct al. (2001) Knize et al. (1994) Keating and Bogen (2004) Busquets et al. (2004) Sinha et al. (199R) Felton et al. (2004) Keating and Bogen (2004) Bu squets et al. (2004) Sinha et al. (1995) Zimmerli ct al. (2001)
Skog et al. (1997)
[image:8.602.75.547.118.599.2]Table 6 . Estim a ted mea n da il y in take of so me H CAs in var io ll s countries
Sum of
Geogra ph ic p h[p MelQx DiMelQx three H CAs
location (ng pC I' capi ta day-I) (ng per capi ta day-I) (ng per.capita day - I) (ng pC I' capita day- I)
New Zealand
Swe d en 72 72 [ 6
S\vedcn Sweden
Switzerland 12+- 1 S6 72 --·85 13-73 RuYᄋセ@ 19
USA 7iU-I09.7 19.6- 32.7 lS-2.2 993-144()
USA 427
80.5
14.7 522.2USA 158 .3-137 .5 52 .1 0-640 35-4 1 2139 - 2056
USA 285.5-457 .9 D-44.8 3.5-4.0 322-50G.7
USA
USA i60-2 1S lJ3-US 6.5- 10.7 RUYNUセj VjNW@
USA 539- 1029 l) 1 - 126 18.9-469 (,48.9-120 I C)
J apan WA7 98-1 1. 2 07-03 495--64.S
Japan S .. .100 30()-3900
Germany 63 34 2 10 .1
Singapore
Spain 344 29 13.6-I S. 1 3SS
Notes: "I nta ke '01' [Q, Me IQ , M elQx , DiMelQx, PhIP , AaC, MeAac:. T rp- P- l and Trp-P-2.
bl n lakc of rQ, MclQ, McIQx, D iM e lQx an d Ph iI' . cI Qx, MelQx a nd p h[p.
dS um of I Q, 7,8-DiMelQx, MeJQ , 4,8- D ilvleI Qx, MelQx, and PhIP . "Mean values for co nt ro l su bjec ts anc! colon ca nce r cases.
[Total H CAs include [Q, Mc[ Qx, D iMclQx, P hIl' and Aac:. gBasec! o n a 70 kg bod y we igh t.
hSUt11 o f P hIl' , MelQx, D iMclQx, AaC an d IQ. 'Total HCAs include Trp-P-l a nd MeIQ.
IMean intake of IQ, Mc IQ , Me IQx, 4,S- D iMe IQx, 7,8 -D iMe IQx, phI P and I FP.
ng kg- I
To tal HCAs body mass
(ng pCI' cap ita day-I) day- I R eference
976" T homso n et al. (1996)
16010 A ugu stsso n et a l. ( 1997)
77 A ugustsso n ct a!. ( 1999)
N.5Jc O lsson e( al. (2005)
20l)-·397d Zimme r! i et a!. (200 I )
Sinha e( al. (200 I
r
9.i
Boge n anc! Keatin g (200 1)£Si nha et a!. (2 000)" Byrne et a !. (1998)
IS20
26
Layton e( a l. ( 1995)£Nowe ll et a !. (2002)e
I I. O .. 19.9b Keating a nd Bogen (2004)£
1.06-1. 1' Kobayashi el a!. (2002)£
Wakabayash i el aL (1997) Rohrma n n a nd Becke r (2002)
49.95J Wong et al. (2005)
934k Busquets et al. (2004)
kS1ll11 of DMIP, Glll-P-2 , IQ, Mc1Qx. McIQ, Gl u-P - [ , 7,8 -Di M eIQx , 4,8 -D iMcIQx. Norh armJn, Ha rman, Trp-P- 2, Trp-P-l , P hIP , AaC, McAac:.
o
セ@
ClC
'>
:-"
::r:;
:J:..
<..., ;::,
Ef
...,
セ@
セ@
[image:9.842.103.773.141.352.2]from me a t and fL sh were lowe r th a n th ose reported in the United States in 1995. where the value was 1820 ng pe r ca pita day- I (Layton e t al. 1995). H owever, o u; estimates of dail y intake a re in ag reem e nt with the studies of Keating and Boge n (2004) ( 1393 n g per capita da y- I) in the United States, and Busquets et al. (2004) (934ng pe r capita day-I ) in Spain. H oweve r. a lower average intake of HCAs wa s al so reported in differe nt studie s from Swede n, Switzerland, and Jap a n , wh e re 160 ng per capita day -I (Au gus tss o n et a l. 199 7 ), 397 ng per capita day - I (Zimmerli et al. 2001) , and 77 ng per cap it il day - I (Kobayashi et al. 20(2) we re est imated . respecti vel y. Table 6 s how s th e est imat ed mea n dail y intakes of so me HCAs in va ri o u s co un t ri es. Due to difference s in stud y d es ign, intake frequency . cook in g method , and th e duration o f cook in g . it is difficult to mak e a n accura te co mpari son o f th e dai ly int a kes of HCAs between thi s st ud y and other repo rt ed data from other studies. N eve rth eless, in viell of the more fried and grilled meat products and th e va ri ety of cooking methods for meat and fish, th e estim a ted inta kes of H C As in the prese nt study were almo st similar to tho se reported by other studies (Table 6).
This eva luation of HCA exposure showed lh al fried a nd grill ed mea t see m to be the largest so urces of HCA s in the di et in Selangor, and chicken wa s the grea tes t so urce of HCAs a mon g diffe rent typ es of meal. From our sur vey, the ratio of tota l chi cken intake per da y was found to be hi g he r tha n all the o the r meat inta kes. Moreove r, the concentration s or HCA s in chicken we re relatively high e r than any ot her meal. Th e m os t importai1t contribution o f these tindin gs is the identification of th e m aj o r contributors of HCAs in th e Malaysian diet. In this study , amo ng the 42 food ite ms analysed, only ten samples accounted for more (han 90% of the total dietary ex pos ure to HCA s in the Mala ys ia n population. It is also noted that minor changes of food choice can ha ve a large impact on exposure to HCAs. There was n o t mu c h differc nce in the intake of HCAs observed between men and women; the reason is presumabl y because the prefe rence for meat was almost similar be tween them.
Conclusion
This study has concluded that barbecuing and frying produce relat ive ly high levels of HCAs in protein-ri c h food products in Malaysia. The key findin g was tha t fri ed and grill ed c hi cke n a re m a lo r dietary so urces of the total int ake of H CAs am o ng Mala ys ian s. On the other hand, th e cons umption of bo iled or fried cooked foods co ntri b utes ve ry little to HCA intake. Further stu dies 011 the estimated di e tar y int a ke of HCAs should be ca rri ed out to clarify th e rela tion ship be tween th e intake of HCAs and the ri sk of cancer amon g Malaysians.
Food Additives and Contaminants 1069
Acknowledgement
The authors are g rateful to th e Na ti o n al Cancer C ou ncil (MAKNA) of Malaysia fo r its finan cia l support which allowed th em to carr y out the s tu dy .
References
Augustsson K. Skog K, J agers tad M, Steineck G. 1997. Assessment of th e hum a n expos ure to he terocycli c amincs. Carc in oge nesis . 18:1931 - 1935.
.-\u gustsso n K , Skog K, J iige rs tad M , Di ck man PW, Stc in cc k G. 1999. Di e tar y heterocyc lic amines and cancer
of th e colon, rectum. bladder, and kidney: a
population-based st udy. Lancet. 553:703 - 707 .
Bogen KT, Keat in g GA. 200 1. US dietary exposures to
he terocycl ic aminc s. J Expo Anal E n viron Epidemio.
111 55- 168.
fl usCJucts R . Bordas i\.1. Toribio F. Puignou L. Galecran MT.
セHIPT N@ Occurren ce or heLerocycl ic amines in several
h ome-co o ked mea t di she s o r the Span ish diet.
J C hr o m :ltogr B . g02:79- 86.
Byrne C, Sinha R. Platz EA, Giovilnnucci E , Colditz GA,
Hunte r OJ. Speizer F E. Willett W e. 1998. Predictors o f
dreta ry heterocyc li c amine intake in three prospec tive coho rts . Ca nce r Epidcm iol Biomarkers Prevo 7:523 --5 29.
C.lIllllell M. fll ill l fl, C ur tin J, Ca rroll R. Po ti schm:ln N.
Capor"so N, Sin h a R. 2004 . Relative val idity o f a food
fr eque ncy quesLionnaire w ith a mea t -cooking and hetero-L' vcl ic aillin e modu le. Cancer Epictemiol Biomarkers Pre vo
IU())- 2n
de Std"anr E. BolTella P, Mendilaharsu M , Carzogl io J , I) c nco-Pcllcg rrnr I-I . 1998. Dietary ni tros amin e, heterocy-clrc amines. an d ri sk of gastric ca ncer: a case co ntro l stud y in U ruguay. Nutr Cancer. 30: 158 162 .
D o min go JL. Bocio A, M a rt i-C id R, Liobet JM. 2007.
Benefits a nd risk s o f fi sh co n sumption part II.
RIBEPEIX. a computer program to optimi ze thc balance betwee n the intake of o m ega -3 faLt y acids and chemical con tamin ant s . T o.\ ico logy. 230:227 ·233.
EI · Ba yo um y K, C ha e YH, Upadhyaya P , Ri vc nso n A , Kurtzke e. e t al. 199 5. Comparative tumorigenicity of benzo[a]pyrcnc , I -n itropyre ne an d 2-amino-l-methyl·6-phenylimidaw[4,5 -b] py ridine administered by gavage to
fe m ale CD rats. Carcinogenesis. 16:431 4 34.
Felto n JS, Ligast ad M , Knize MG, Skog K, Wakaba shi K.
2000. Co ntent s 111 fo od. beverage a nd t obacco .
In : Nagao M. Sugil1lura T, ed itors. F ood h o rne
carcino-gens: Het erocyc li c ami nes. Chi c hester (UK): Wiley.
p. 37-72.
Fel ton JS. Kni ze MG. Bennett LM . l'vl a lfatti MA.
Colvin ME. K ulp KS. 2004 . Im pact o f environmental exposures on th e lllu tagenic it y/ca rcinogen iciLy of hetero-cycl ic amines . T o .\icol o gy. In : 13 5- 145.
Fergu son LR. 2002 . i'd ea l consumption. cancer risk a nd
. populat ion g rou ps within New Zealand. Muta t Res. 506- 507:215- 224.
Fri edman M. 1996 . Fo o d b rowning and its prevention:
an overvicw. J Agric Food Chcm. 44:631 - 653.
1070
M.H.A. lahurul
et al.
prod ucts and commercial liquid Food Addit Contam. 10:503-·521.
Gross GA. Gr[iter A . 1992.
smoke flavourings.
Quantitation of
mutagenic/carcinogenic heterocyclic aromatic amines In food products. J Chromatogr. 592:271 - 278.
Hajcb P. Jinap S. Ismail A, Fatimah AB . Jamilah B,
Abdul Rahim M. 2009. Assessment of mercury level III
commonly consumed marine fishe s in Malaysia.
Food Control 20:7984.
Inte rnational Agency for Research on Cancer (lARC) . 1993. Some natural occurring and synthetic food components, furocoumarins and ultraviolet radiation. Monograph s of th e Evaluation of lhe Carcinogenic Risk of C hemi ca ls to Human s. 56:165- 19 5.
Jage rsta d M, Skog K. 2005. Genotoxicity of heat-processed foods. Mutat Res. 574: 156-- 172 .
Jagers tad M , Skog K. Arvidsson P, Solyakov A. 1998. Chemistry: form a tion and occurrence of genotoxic hetero-cyclic amines id en tifi ed in model systems and cooked fo ods. Z Lebens m Unters. 207:419--427.
Kazerouni N. Sinha R, H su CH , Greenberg A, Rothman N. 200 I Analysis of 200 food items for benzo(ajpyrene and es timation of its intake in an ep idem iologic st udy. Food Chem Toxicol. 39:42JA36 .
Keating GA, Bogen K T. 2004. Estimates of heterocycl ic
amine intak e 111 the US population. J Chromatogr B.
802: 12713 3.
Knize MG. Dolbea re FA, Carroll KL, Moore DH, Felton JS . 1994. Effect o f cooki n g time and tempera ture
on th e he terocyc li c amine content of fri ed beef patties. Food Chem Toxico!. 32:595-603.
Knize MG, Salmon CP, Hopm ans EC, Felton J S. 1997. Analysis of foods for heterocyclic aromatic amine carcin-ogens by solid-p hase extraction a nd high-pe rfo rm a nce liquid chroma tog raphy . J Chromatogr A. 763:179- 185. Kni ze MG, Sinha R. Rothman N, Brown ED , Salmon CP,
Leva nd e r OA. C unningham PL , Felton JS. 1995.
Heterocyclic amine content in fa st-food meat product s. Food Che'm Toxicol 33:545 -551.
Koba yas hi M , Hanaoka
T.
Nishioka S, Kataoka H.T suganc S. :2002. Estimation of dietary HCA intakes in a la rge-scale population-based pro spective study in Japan . Mutat Res. 506- 507:233- 241.
La y ton OW. Bogen KT, Knize MG, Hatch FT,
J o han so n YM, Felton JS. 1995 . Cancer risk of hete roc ycl ic amincs in cooked foods: an analysis and implicat ion s for re sea rch. Carcinogenesis. 16:39- 52.
L10hc t 1M. Falco G, Bocio A, Domin go JL. 2006. Expc>surc
to polycyclic aromatic hydrocarbons through consumption
of edible marin e spec ies in Catalonia, Spain. 1 Food Prot.
69:24932499.
!'vlarti-Cid R , Bacia A, Liobet 1M, Domingo JL. 2007. The
intake of chemical contaminants through fi sh and seafood cons umpti on by c hildren of Catalonia, Spain: heal th ri sks. Food Chem T oxico!. 45: 1968- 1974 .
Me ss ner C, Murk ovic M. 2004. Evaluation of a new model sys tem for stud ying th e form a tion of heterocyclic amines.
J Chromatogr 13. 802: 19- 26.
Nowell S, Coles B, Sinha R, MacLeod S, Ratnasinghe DL. Stotts C, Kadlubar FF. Arnbrosone CB . Lan g NP. 2002.
A nalysis of tota l meat intake a nd expos ure to individual he teroc ycl ic amines in a case-co ntro l stud y of co lo rectal ca ncer: co ntributi o n of m etabolic variation to ri sk. Mutat Res. 506507 175185.
Olsson Y, Skog K , Lundstrom K. Jiigersta d M . 2005. Color photographs for estimation of he terocyclic amine intake from fried pork chops o f different RN genotypes indi cate large varia tion s . Food Qual Prefer. 16:91 - 101. Rohrrn a nn S, Becker N . 2002. D eve lopment of a s hort
questionnaire to assess the dietary intake of he terocyclic aromatic amines . Publ Hlth Nutr. 5:699-75.
Sinha R , Chow WH , Kulldorff M . Dcnobilc .I , Butler J,
Garcia-Closas M. \Vei l R. Ho ove r RN, Rothman N. 1999 . Well-done gr ill ed red meat increases the ri sk o f colorectal adenomas. Cancer Res . 59:43204324.
Sinha R. Gustafson DR, KulldorfT M , Wen WQ , Cerhen JR, Zheng W. 2000. 2-Am in o- I-m e th yl-6-phe nyl imid azo [4 ,5-bjpyridine , a carcinogen in hi gh tempera ture-coo ked meat and breast can ce r ri s k. J Natl Cancer Imt. 92:1352- 1354. Sinha R, Kulldorfr tv\. Cho\\ WH , Denobile J. Rothman N. 200 1. Di e tary intake o f hc terocvc li c amines , meat-de ri ved mutagenic activit y. and th e risk of colorcctal adenomas. Cance r Ep id cmi ol Biomarkers Prevo 10:559- 562.
Sinha R, Kulldorff M , Curtin '/ , Brow n Cc, Alavanja MC, Swanson CA 199X. Fri ed well -don e red meat and risk of lun g cancer in wome n (United S tates). Cancer Causes Control. 9:621630.
Sinha R, Kulldorfr M , Swan so n CA. C urtin J.
Brown so n RC. Alavanja MCR . 2000. Dietary heterocycl ic amines and th e ri sk of lung cancer among Mi sso uri wo men. Cancer Re s. 60:3753 - 3756.
Sinh a R, Rothman N, Brown ED, Salmon CP, Kni ze MG, Swanson CA. Ro ss i SC, Mark SO. Levander OA, Felt on JS. 1995. Hi gh concen t ra tion s o f th e carcin ogen 2-a mi no-I-mel hy 1-6-phcn ylim idazo- [ 4, 5-bi pyridi nc (Phi P) occ ur in chicken but are dependent o n the cooking me th od. Ca nce r Res. 55:4516--4519 .
Sinha R, Rothman N. Salmon CP, Knize MG, Brown ED,
Swanson CA Rhodes D , Rossi S. Felton 1S,
Levander OA. 1998. Heterocyc li c amine content in beef
cooked by different me thods to varying degrees of
done-ness and gravy made from meat drippings. Food Chem Toxicol 36:279287.
Skog K. 199 3. Cooking procedure and food mutagens: a literature review. Food Chem Toxicol. 31:655675.
Skog K , Augustsson K. Steineck G, Stenberg M ,
Jiigerstad M. 1997. P olar and non-polar heterocyclic amines in cooked fi sh and mea t produc ts and their
co rresponding pan residues . Food Chem Toxi co l.
35555-565.
Skog K , Solyakov A. 2002. H e te rocycl ic amines in poultry
products: a literature rev iew. Food Chem Toxicol.
40 1213-1221.
Thomson BM. Lake RJ, Cressey PJ , Knize MG. 1996. Est imat ed cancer risk from he te rocycl ic amines in coo ked meat :- a New Zealand perspective. Proc Nulr Soc NZ. 21: I 06115.
Wakaba yas hi K. Nagao M , Esumi 1-1 , Sugimura T. 1992.
Wakabayas hi K. T o tsuka Y, Fukuto me K . Oguri A,
Ush iyama H , Sugimura T. 1997. Human exposure to
muta-genic/carcinogenic hete rocyclic a mines and co-mutagenic fJ-carbolines. Muta t Res. 376:253259.
Wakabayashi K . U shi ya ma H , Takahashi M , Nukaya H ,
Kim S-B , Hiro se M . Ochiai M , Sugimura T , Nagao M . 1993. Exposure to hete rocycl ic a mines. Environ Hlth Perspect. 99:129- 133.
Food Additives and Contaminan ts
1071Wong KY, Su J , Kni ze MG , Koh WP , Seow A . 2005. Dieta[y exposure to heterocyclic am in es in a Chinese pop ulation . NutI' Cancer. 52(2) :147- 155.
Z irnm erli B. Rhyn P, Zolle[ O . Schlatter J. 200 I . Occurrence