2011 3rd Conference on Data Mining and Optimization (DMO) 28-29 June 2011, Selangor, Malaysia
Modeling Forest Fires Risk using Spatial Decision
Tree
Razali Yaakob, Norwati Mustapha
Faculty of Computer Science and Information Technology, Universiti Putra
Malaysia, 43400 Serdang Selangor, Malaysia
[email protected], [email protected]
Ahmad Ainuddin B Nuruddin
2Faculty of Forestry, Universiti Putra Malaysia, 43400 Serdang Selangor,
Malaysia
Imas Sukaesih Sitanggang
Computer Science Department, Bogor Agricultural University, Indonesia
Abstract— Forest fires have long been annual events in many parts of Sumatra Indonesia during the dry season. Riau Province is one of the regions in Sumatra where forest fires seriously occur every year mostly because of human factors both on purposes and accidently. Forest fire models have been developed for certain area using the weightage and criterion of variables that involve the subjective and qualitative judging for variables. Determining the weights for each criterion is based on expert knowledge or the previous experienced of the developers that may result too subjective models. In addition, criteria evaluation and weighting method are most applied to evaluate the small problem containing few criteria. This paper presents our initial work in developing a spatial decision tree using the spatial ID3 algorithm and Spatial Join Index applied in the SCART (Spatial Classification and Regression Trees) algorithm. The algorithm is applied on historic forest fires data for a district in Riau namely Rokan Hilir to develop a model for forest fires risk. The modeling forest fire risk includes variables related to physical as well as social and economic. The result is a spatial decision tree containing 138 leaves with distance to nearest river as the first test attribute.
Keywords- forest fires risk; spatial decision tree; ID3 algorithm;
I. INTRODUCTION
Forest fire in Indonesia seems to be yearly tradition especially in dry season and is considered as a regional and global disaster. This phenomenon causes many negative effects in various aspects of life such as natural environment, economic, and health. Fire prevention has an important role in minimizing the damage due to forest fire. Early warning system as one of the activities in fire prevention needs to be developed in order to assess forest fire risks. Nowadays computer-based technologies including remote sensing and geographical information systems (GISs) have been widely applied in forest fires information systems. Forest fires managers use GISs for fuel mapping, weather condition mapping and fire danger rating in order to make decisions in forest fires.
Many works have been conducted in the creating a wildfire risks model by integrating GISs and remote sensing. Spatial
operations in GISs have widely applied to analyze causes of fires and their relationships and then to produce the fire risk maps. A model of forest fire hazard in East Kalimantan, Indonesia using the remote sensing technique integrated with the GIS has been developed in [1]. Variables used in [1] include vegetation fuel type derived from land use/cover map, terrain, road, and bare soil. The wildfire risk model for the area of Sasamba, East Kalimantan Indonesia was created using the GIS-based method of Complete Mapping Analysis (CMA) [2]. This study [2] was carried out based on physical-environmental factors consisting of average daily minimum temperatures, the total daily rainfall, the average daily 1300 relative humidity, agro-climatic zone, and slope, as well as human activity factors including the village center, road network, vegetation and land cover types. Other works have been conducted in developing forest fires risk models for some regions in Indonesia [3, 4]. In [3] and [4], GISs and remote sensing were used to analyze forest fire data. In addition, the method Complete Mapping Analysis (CMA) in [3], and Multi-criteria Analysis (MCA) in [4] are also applied to understand the causes of fire risk factors and interactions between them. Determining the weights for each criterion in the method such as MCA are based on expert knowledge or the previous experienced of the developers that may result too subjective models. Besides, criteria evaluation and weighting method are most applied to evaluate the small problem containing few criteria.
Spatial decision trees differ from conventional decision trees by taking account implicit spatial relationships in addition to other object attributes [6]. A spatial decision is a model representing classification rules induced from spatial dataset containing attributes of objects and attributes of neighboring objects. Decision tree algorithms designed for spatial databases have been discussed in [7, 8]. Other spatial decision tree algorithms are the SCART (Spatial Classification and Regression Trees) in [9] as the extension of the CART (Classification and Regression Trees) method and the spatial ID3 algorithm in [10].
This paper presents our initial results in developing a spatial decision tree from the forest fires data based on the spatial ID3 algorithm as in [10]. Some works will be conducted to improve the algorithm so that the model based on the spatial decision tree has higher accuracy than those using the non-data mining technique. This paper is structured as follows; Section 1 is an introduction, Section 2 describes research methodology. Spatial decision tree algorithms are briefly explained in Section 3. In section 4 discusses modeling forest fires risk using spatial decision tree. Finally, conclusion and some future works are summarized in Section 5.
II. RESEARCH METHODOLOGY
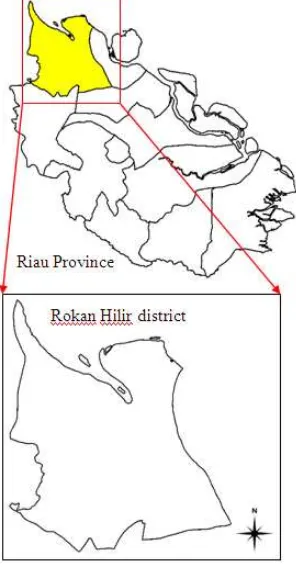
The study area is Rokan Hilir district, Riau Province, Indonesia (Fig. 1). The total area of Rokan Hilir is 896,142.93 ha. or approximately 10 % of the total area of the Riau Province (8,915,015.09 ha). It is situated in area between 100° 17' - 101° 21' East Longitude and 1° 14' - 2° 45' North Latitude.
Figure 1. Area of study.
A forest fires risk model will be created in several steps in Knowledge Discovery from Data (KDD):
a) Data preprocessing. This step prepares the data for analysis by conducting some data preprocessing tasks. The following data preprocessing tasks may be performed on the dataset: a) Data cleaning to remove noise and inconsistent data, b) Data integration, c) Data reduction and feature selection, d) Data transformation e) Computing spatial join index tables which contain the spatial relationships between objects of two thematic layers as in [9].
b) Data Mining. The spatial decision tree algorithm developed based on the work of [9, 10, 11] will be applied to historic forest fires data for all villages in Rokan Hilir district to develop a model for forest fires risk. The tree can be pruned to overcome the problem of overfitting the data because of noise or outliers.
c) Pattern evaluation. Based on the 10 folds cross-validation approach, accuracy of the classifier will be computed on testing set to evaluate the ability of classifier to correctly predict the class label of new data. A confusion matrix will be used to provide the information needed to determine how well a classifier performs.
d) Knowledge representation. Classification rules will be extracted from the spatial decision tree that describes the forest fire occurrences in Rokan Hilir district. The rules are represented in form of classification IF-THEN rules. One rule is created form each path from the root to a leaf node.
III. SPATIAL DECISION TREE ALGORITHM
Our proposed work aims to develop a forest fires risk model using the spatial decision tree algorithm without involving subjective and qualitative judging for variables. The algorithm will be applied to spatial and non-spatial historic forest fires data in Rokan Hilir district, Riau Province, Indonesia. The data are arranged in a set of layers representing discrete features including points (e.g. hotspot locations), lines (e.g. rivers) and polygons (e.g. land cover types). This study applied two types of spatial relationship: topological and metric to relate spatial objects.
This drawback may also happen in constructing spatial decision trees using the SCART because growing the tree in the SCART is based on the CART.
Another spatial decision tree algorithm was developed as in [10] based on the ID3 algorithm. The study in [10] is the extension of the ID3 algorithm in [11] such that the algorithm can create a spatial decision tree from the spatial dataset in which the algorithm considers not only spatial objects itself but also their relationship to its neighbor objects. The algorithm generates a tree by selecting the best layer to separate dataset into smaller partitions as pure as possible meaning that all tuples in partitions belong to the same class. As in the ID3 algorithm, the spatial decision tree algorithm uses the information gain for spatial data, namely spatial information gain, to choose a layer as a splitting layer. Instead of using number of tuples in a partition, spatial information gain is calculated using spatial measures such as area and distance [10].
Spatial objects in forest fires data may have many distinct values that will become outcomes of the test attributes. For example land cover may be classified into some categories such as natural forest, dryland forest, mangrove, plantation, settlement, swamp, paddy field, shrubs, bare land, and water body. These categories merged with spatial relations form two branches from the node in a binary tree. The left branch contains objects related to one of these categories, for example natural forest, while objects in the right branch are associated to other categories. Characteristics of objects in the right branch may not be specific because this node is related to nine other land cover categories rather than a single category. In this case the right branch may be extended in the next levels of the tree. This process may construct a less interpretable and complex spatial decision tree because multiple splits on the same test attributes may occur at more than one level. For that our work applied the spatial ID3 algorithm as in [10] that provides multi-way splits instead of the CART algorithm [9] that apply binary splits in constructing the tree.
In our works, we extend spatial measure definition for the spatial features represented in points, lines and polygons rather than only for polygons as in [10]. Spatial features are stored in a set of layers in a spatial database. This set contains some explanatory layers and one target layer that hold class labels for tuples in the dataset. Spatial measures including Count and Distance are resulted from two spatial relationships Topological (In) and Metric (distance) between two spatial features. We calculate count of point features in polygon features and distance from point features to line features in the formula of Entropy for a layer. We adopted the Spatial Join Index (SJI) as in [9] to relate two spatial objects and to store the spatial relationships between two objects.
As the tree growing, the best layer is selected based on the value of spatial information gain to separate the dataset into smaller partitions. Spatial information gain for a particular layer L is subtraction of entropy for the target layer after the dataset is partitioned using the layer L from the entropy for the target layer before splitting. After the algorithm finds the best layer that will be assigned to the root or internal nodes, the
algorithm will split the samples (dataset) into the smaller partitions based on the distinct values in the best layer. Each smaller partition is associated to a new layer that will be used to create a subtree. The tree will stop growing if for a node N in the tree, there is only one explanatory layer left in the set of layers or all objects in the dataset have the same class namely C. For the first case, we assign a majority class in the dataset as a label of N whereas for the second case we assign the class C as a label of N.
IV. MODELING FOREST FIRES RISK USING SPATIAL DECISION
TREE
A forest fire risk model will be constructed from a dataset containing spread and coordinates of hotspots in 2008, physical, social and economic data. Hotspot and physical data are obtained from Ministry of Environment Indonesia and National Land Agency (BPN) Riau Province respectively. Social and economic data are collected from Statistics-Indonesia (BPS). The first task we did was preprocessing for physical, social and economic data. Data preprocessing is important to improve the quality of the data, thereby it can improve the accuracy of the resulted model as well as efficiency of data mining process.
A. Data preprocessing
There are two categories of data, spatial and non-spatial. Non spatial data consist social and economy data for villages in Rokan Hilir represented in DBF format. The data include inhabitant’s population and inhabitant’s income source. For mining purpose using the spatial decision tree algorithm, these non spatial data in DBF format are converted to spatial data in shp format using the shpfiles for administrative borders for village, subdistrict and district in Riau. We assign the spatial reference system UTM 47N and datum WGS84 to all objects. All objects are represented in vector format.
For mining purposes using classification algorithms, a dataset should contain some explanatory attributes and one target attribute. Therefore we conduct two main tasks in constructing a forest fire dataset: 1) creating target attribute and populating its value from the target object, and 2) creating explanatory attributes from neighbor objects related to the target object. In our study target objects are true and false alarm data. True alarm data (positive examples) are 744 hotspots that spread in Rokan Hilir District, Riau in 2008. False alarm data (negative examples) are randomly generated and they are located within the area at least 1 km away from any true alarm data. For this purpose we create 1 km buffer from positive examples and extract all randomly generated points outside the buffer to be negative examples.
have been conducted will be briefly explained in the following subsections. All steps were performed using open source tools: PostgreSQL 8.4 as the spatial database management system, PostGIS 1.4 for spatial data analysis, and Quantum GIS 1.0.2 for spatial data analysis and visualization. Distance between two objects is represented in meters.
Physical Data
a) Calculate distance from target objects to nearest road and river. We define relations between target objects and spatial objects: road and river by calculating distance of target objects to nearest road and river. For this purpose we applied the PostGIS operation ST_Distance to compute distance from each target to all river and road networks then identify its minimum value as distance from a target to nearest objects.
b) Land cover. We determine types of land cover for the area where the target objects are located. For this purpose we applied the topological operation ST_Within in PostGIS to identify target objects inside an area and its type of land cover. There are several types of land cover, that are bare land, dryland forest, natural forest, mangrove, mix garden, paddy field, plantation, unirrigated agricultural field, shrubs, swamp, settlement, and water body.
Social and Economic Data
The social and economic data include population density of the villages and inhabitant’s income source. The income source consists of agriculture (in mix garden, paddy field, agriculture, unirrigated agricultural field), forestry, other agriculture, plantation, trading and restaurant, other income sources (transportation, warehousing, communication, gas, electricity, banking, etc), and no data (non-village area). Three tasks performed in social and economic data preprocessing are as follows:
a) Identifier matching. The digital map for village border is for the year 2007 while the social and economic data are selected from village potential data for the year 2008. There are 2 villages in social and economic data that have different identifiers with those in the village border map. To overcome this inconsistency between social and economic data in 2008 and the village border map in 2007 we replaced identifiers in the map based on information from Statictics-Indonesia (BPS).
b) Handling null values. There are 2 polygons in the village layer with no data for all social and economic attributes. Two of these objects are located in forest and the other is a village (non-forest). We assigned value 0 for attributes population and income source in forest area and non-zero new values for the village (non-forest) based on its neighbors. The topological operation ST_Touches in PostGIS was applied to find all neighbors that meet the village (non-forest). Income source is estimated by values of neighbor polygons. Population and number of schools are estimated by value of these attributes in nearest villages that have the same area.
c) Modifying categorical values for income source.
Most of villages in Riau Provinces have income source Agriculture. The purpose of income source modification is to make detail the income source Agriculture by identifying type of land covers for all villages that have income source Agriculture. A type of land cover which has largest area will be selected to modify the values for attribute income source. A selected type will combine with income source Agriculture to create a new value for income source. Topological operation ST_Intersection in PostGIS was applied to define all intersection areas between land cover layer and income source layer.
B. Forest Fires Risk
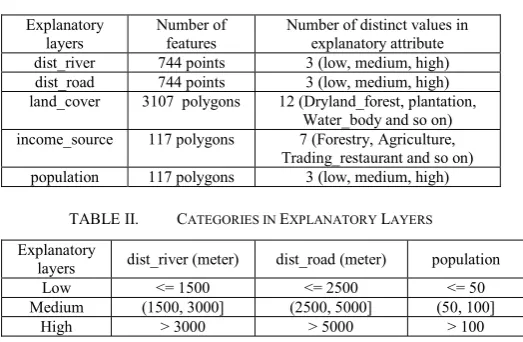
We run the spatial decision tree algorithm as in [10] on a set of layers containing 5 explanatory layers and one target layers. The explanatory layers are distance to nearest river (dist_river), distance to nearest road (dist_road), land cover, income source and population. Table I provides a summary for explanatory layers. We transform minimum distance from numerical to categorical attribute because the algorithm requires categorical data for target and predictive attributes. Categories for attributes in explanatory layers are given in Table II. We extend spatial measure definition as in [10] such that it can handle the geometry type points, lines and polygons rather than only for polygons in [10].
TABLE I. SUMMARY FOR EXPLANATORY LAYERS Explanatory
layers
Number of features
Number of distinct values in explanatory attribute dist_river 744 points 3 (low, medium, high) dist_road 744 points 3 (low, medium, high) land_cover 3107 polygons 12 (Dryland_forest, plantation,
Water_body and so on) income_source 117 polygons 7 (Forestry, Agriculture,
Trading_restaurant and so on) population 117 polygons 3 (low, medium, high)
TABLE II. CATEGORIES IN EXPLANATORY LAYERS Explanatory
layers dist_river (meter) dist_road (meter) population Low <= 1500 <= 2500 <= 50 Medium (1500, 3000] (2500, 5000] (50, 100]
High > 3000 > 5000 > 100
Spatial information gain is calculated based on the Spatial Join Index (SJI) [9]. Table III gives the SJI for relation between the dist_river layer and target layer.
TABLE III. SJI FOR DIST_RIVER AND TARGET target_id Spatial Relation (Distance) in meter river_id
The decision tree contains 138 leaves with the first test attribute is distance to nearest river (dist_river). Below are some rules extracted from the tree:
1. IF dist_river = high AND income_source = Plantation AND population = medium AND land_cover = Dryland_forest THEN hotspot occurrence = T
2. IF dist_river = high AND income_source = Agriculture AND land_cover = Mix_garden AND population = low THEN hotspot occurrence = T
3. IF dist_river = high AND income_source = Agriculture AND land_cover = Plantation AND dist_road = medium THEN hotspot occurrence = T
4. IF dist_river = medium AND income_source = Forestry AND population = medium THEN hotspot occurrence = T
5. IF dist_river = medium AND income_source = Trading_restaurant THEN hotspot occurrence = F
6. IF dist_river = low AND land_cover = Mix_garden AND income_source = Agriculture AND population = high THEN hotspot occurrence = F
7. IF dist_river = low AND land_cover = Bare_land AND income_source = Plantation AND population = low THEN hotspot occurrence = T
V. CONCLUSION AND FUTURE WORKS
This paper outlines our initial results in developing a forest fires risk model using the spatial ID3 algorithm from forest fires dataset. The dataset consists of spread and coordinates of hotspots in 2008, physical, social and economic data. Relations between two spatial objects are represented in spatial join index tables by applying two spatial relationships: topological and metric. In this work we extend spatial measure definition for the geometry type points, lines and polygons rather to calculate spatial information gain. The result is a decision tree containing 138 leaves with the first test attribute is distance to nearest river.
In future works we will include weather data such as maximum daily temperature, daily rainfall, and speed of wind and evaluate the model using the real burn data.
ACKNOWLEDGMENT
This work is supported by the Indonesia Directorate General of Higher Education (IDGHE), Ministry of National
Education, Indonesia (Contract No. 1724.2/D4.4/2008) and partially supported by Southeast Asian Regional Center for Graduate Study and Research in Agriculture (SEARCA) .
REFERENCES
[1] M. Darmawan, M. Aniya and S. Tsuyuki, “Forest Fire Hazard Model Using Remote Sensing and Geographic Information Systems: Toward Understanding of Land and Forest Degradation on Lowland Areas of East Kalimantan Indonesia,” In the 22nd Asian Conference on Remote Sensing, 5-9 November 2001, Singapore.
[2] J. Boonyanuphap, “GIS-Based Method in Developing Wildfire Risk Model. A Case Study in Sasamba, East Kalimantan, Indonesia,” unpublished. Thesis. Graduate Program, Bogor Agricultural University, Indonesia, 2001.
[3] M. Hadi, “Pemodelan Spasial Kerawanan Kebakaran di Lahan Gambut: Studi Kasus Kabupaten Bengkalis, Provinsi Riau,” unpublished. Master Thesis. Graduate School, Bogor Agricultural University, 2006 (in Bahasa).
[4] P. H. Danan, “A RS/GIS–based multi-criteria approaches to assess forest fire hazard in Indonesia (Case Study: West Kutai District, East Kalimantan Province),” Master Thesis, Bogor Agricultural University, Indonesia, 2008
[5] D. Stojanova,, P. Panov, A. Kobler, S. Džeroski and K. Taškova, “Learning to predict forest fires with different data mining techniques,” In Conference on Data Mining and Data Warehouses, Ljubljana, Slovenia, 2006.
[6] K. Zeitouni and N. Chelghoum. “Spatial decision tree – application to traffic risk analysis,” In Proceedings of ACS/IEEE International Conference on Computer Systems and Applications (AICCSA'01), Beirut, Lebanon, June 26-29, 2001, pp. 0203-0212.
[7] M. Ester, H. Kriegel and J. Sander, “Algorithms and applications for spatial data mining,” Published in Geographic Data Mining and Knowledge Discovery, Research Monographs in GIS, Taylor and Francis, 2001.
[8] K. Koperski, J. Han and N. Stefanovic, “An efficient two-step method for classification of spatial data,” In Symposium on Spatial Data Handling, 1998.
[9] N. Chelghoum, K. Zeitouni and A. Boulmakoul, “A decision tree for multi-layered spatial data,” In Symposium on Geospatial Theory, Processing and Applications, Ottawa, 2002
[10] S. Rinzivillo and T. Franco, “Classification in Geographical Information Systems,” Springer-Verlag Berlin Heidelberg. PKDD 2004, LNAI 3202, 2004, pp. 374–385.
[11] J. R. Quinlan, “Induction of decision trees,” Machine Learning 1. Kluwer Academic Publishers, Boston, 1986, pp. 81-106.