Procedia - Social and Behavioral Sciences 186 ( 2015 ) 982 – 989
1877-0428 © 2015 The Authors. Published by Elsevier Ltd. This is an open access article under the CC BY-NC-ND license (http://creativecommons.org/licenses/by-nc-nd/4.0/).
Peer-review under responsibility of Academic World Education and Research Center doi: 10.1016/j.sbspro.2015.04.184
ScienceDirect
5th World Conference on Learning, Teaching and Educational Leadership, WCLTA 2014
The Development of Science Process Skills in Physics Education
Martina Hodosyová
a*, Jana Útla
a,
MonikaVanyová
a, Petra Vnuková
a, Viera Lapitková
aaComenius University,Faculty of Mathematics, Physics and Informatics, Bratislava 842 48, Slovakia
Abstract
Ongoing reform of education in Slovakia had affected the teaching of physics by these main changes: inquiry – based teaching, the definition of science process skills in curriculum and focus on their importance before content standard. In this study we aimed to observe the development of these three types of science process skills: hypothesizing, interpretation of results and making conclusions. Total of nine test tasks (selected from external Science test) were presented to the group of 120 pupils from lower secondary school. The worst results were noticed for the hypothesizing (33%). We are aware of the limits in testing and distortion of gathered information. Therefore, we proposed model situation or real experiment related to six tests tasks. There is a form of feedback to get the correct answer which develops self assessment.
© 2015 The Authors. Published by Elsevier Ltd.
Peer-review under responsibility of Academic World Education and Research Center.
Keywords: assessment; science process skills; hypothesizing
1. Introduction
Ongoing school reform in Slovakia has started in 2009 with new state curriculum for all levels. In this paper we are concerned about main changes of physics education at lower secondary school: inquiry – based teaching, the definition of science process skills in curriculum and focus on their importance before content standard. New inquiry-based textbooks had been developed in five years. Nowadays the most discussed issue of science education is assessment of science process skills. As Harlen (2013) points out “Unless these (science process skills) are
included in the assessment there is a real danger that they are neglected in teaching” (p.48).
* Martina Hodosyová. Tel.+421910995984
E-mail address: [email protected]
© 2015 The Authors. Published by Elsevier Ltd. This is an open access article under the CC BY-NC-ND license (http://creativecommons.org/licenses/by-nc-nd/4.0/).
At the beginning of this paper we introduce the understanding of science process skills in current standard (SPU, 2009) and previous standard (SPU, 2002). We also discuss scientific experiment (the focus is on hypothesizing) in context of the interdisciplinary relations in separately taught science subjects (physics, chemistry, biology and geography). In the main part we were focused on examination of external test tasks. We were interested in two aims:
x To compare results for three types of tasks –planning experiment (hypothesizing), interpretation of results and making conclusions.
x To identify the benefits of the real experiment or model situation as the form of feedback. Tasks results were compared with observed student´s performance – how they design the experiment, control the variables and discuss.
2. Science process skills
Science process skills have always been part of curriculum for lower secondary school. There are listed these skills in standards (created in 2002): to observe, to measure, to experiment and to process data. The difference is in importance – in previous standards the focus was on knowledge and the skills only complemented them. The goal of experiment was to form physics concepts and explain phenomena. There are over 460 exemplified tasks which illustrated the expected knowledge and skills in mentioned standard. They determined acceptable range and difficulty. Approximately 6 % of exemplified tasks were related to experiment and only in 2 % of tasks students were required to design experiment. (SPU, 2002)
In current standards there is a primary aim the development of science process skills, the content standard is
mentioned as the way of their application. The requirements for student´s work as to discover, to verify, to investigate are common and prove the scientific approach. Other skills like state hypothesize or control variables
haven´t been part of previous standards.
The development of science process skills is interdisciplinary matter. Topics of all science subjects overlap each other in common science concepts which are energy, properties of matter, particle structure of matter, motion, change and living systems. These concepts associate subjects thematically and they are the source of creation and development of interdisciplinary relations. The National Curriculum of Slovakia does not support related topics in science too much. In primary and secondary education in Slovakia the interdisciplinary relations in science are realized by coordination or integration of curriculum at the level of individual topics. Integrated science teaching takes place only in primary education. However, at the secondary level science subjects are taught separately. A similar system can be found for example in the Czech Republic, Poland, Romania, Cyprus and Estonia. Integrated teaching at primary and secondary level of education is used mainly abroad, for example in Germany, France,
Belgium, UK and USA (Škoda, 2005). Using teaching procedures that partially integrate knowledge and empirical
methods of more science subjects it is possible to develop scientific thinking and understanding of nature as a whole for students. For the present conditions of the education system in Slovakia it is easier to apply a coordinated approach in science where the implementation of interdisciplinary relations depends mainly on the teacher's overview, experience and cooperation with teachers of other subjects.
3. Methodology
We consider the tasks from SAT Science test (NFER, 2009a,b,c) appropriate for our aims for these reasons:
x Content – factual, conceptual and also procedural knowledge
x Context – real life situations, phenomena or investigation is related to some child – Hanna, Sara
x Form – many short open constructed-response items
x Background – booklet with mark scheme for test papers. It includes the marks available for each part of the question, the expected answer and acceptable answers. The additional guidance column shows which answers are insufficient or not acceptable.
a. Set of participants
There were 120 students participating in our study from three different secondary lower schools.The teachers of these five classes voluntarily respond to our offer of educational activity and came to our laboratories at Faculty of Mathematics, Physics and Informatics.
b. Process steps and data collection
Each class was divided into thirds (the maximum number of students in the group was 10) with their own activity program, place and animator (PhD student). The activity lasted 60 minutes and consisted of 10 minutes taking test tasks and the rest of lesson was aimed to the experiment itself. The discussion moderated by animator was enclosed during the whole lesson.
We used these identifiers:
x A-E - each for one of five classes (main groups),
x A1 – A3 - after dividing the class to three groups (the same for B-E)
x N.1,N.2,…, N.9 – we used the same number of main task, as they have been marked in original test (We used one task which was only in paper level 5-7, so we marked it as N.2.9).
x 2a, 3ai, 3aii – we used the same identifier for individual items as they have been marked in original tests.
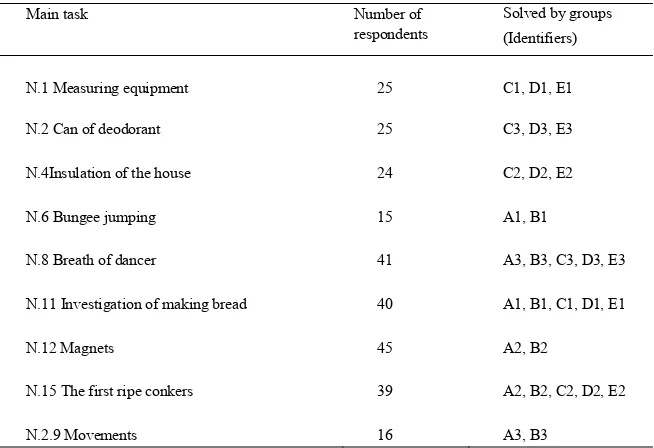
Table 1. The list of main tasks
Main task Number of respondents
Solved by groups (Identifiers)
N.1 Measuring equipment 25 C1, D1, E1
N.2 Can of deodorant 25 C3, D3, E3
N.4Insulation of the house 24 C2, D2, E2
N.6 Bungee jumping 15 A1, B1
N.8 Breath of dancer 41 A3, B3, C3, D3, E3
N.11 Investigation of making bread 40 A1, B1, C1, D1, E1
N.12 Magnets 45 A2, B2
N.15 The first ripe conkers 39 A2, B2, C2, D2, E2
Two test tasks were given to each group; the one marked bold was connected with real experiment. For example the group B2 answered tasks N.12 and N.15, and they made experiment related to task N.12 (marked bold, table N.1).
We evaluated the success rate of items. When the task was aimed to test science process skill, we tried to prepare the same or very similar experiment which was described in task – for example the task n.11 or n.2.9.
The last item from main task n.11 was to suggest the way of testing the prediction – the yeast in dough influences the volume of dough. In discussion the students divided a cube of yeast for each pairs – 1/2, 1/4, 1/8, 1/16 and 1/32 of cube (one cube for the whole group, so they always cut in half).Then each pairs prepared a dough by the same receipt – the same amount of flour, water, sugar, but variable amount of yeast. Then they put their dough into measuring cylinder. We had prepared one bigger dose with warm water bath and we put all cylinders into bath at the same time. Then student observed and measured the volume of dough in regular intervals – each pairs observed only their own measuring cylinder. Then we discuss the results together.
For task N.2.9 we used Velanova´s activity (2014). Students analyse graph created in Coach 6 programme and then they attempt to move by the prepared distance-time graph. Their movement was sensed by the ultrasonic sensor and measured values were drawn in distance-time graph. Also first prepared graph was displayed in one picture to allow their comparison. Then they worked in pairs where one prepares graph and the second one attempts to follow that graph (they had time to repeat their attempts).
If the tasks were aimed to factual and procedural knowledge, we also prepared experiment to practise science process skills (n.12).
4. Findings
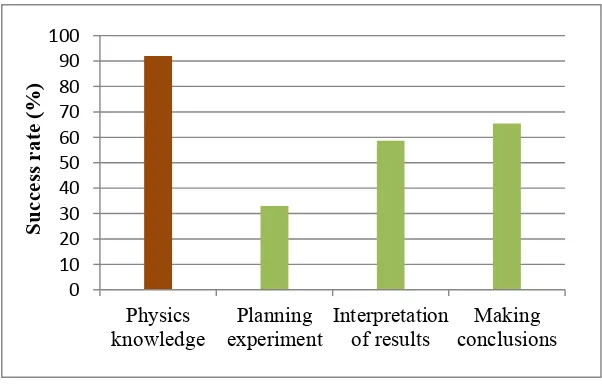
We compared the average percentage of correctly answered items related to three presented types of process skills. The worst results were noticed for planning experiment (33%) as is shown in figure below. The success rate for physics factual and conceptual knowledge was high, 92 %.
Fig 1 - the graph of success rate for science process skills
a. Planning experiment
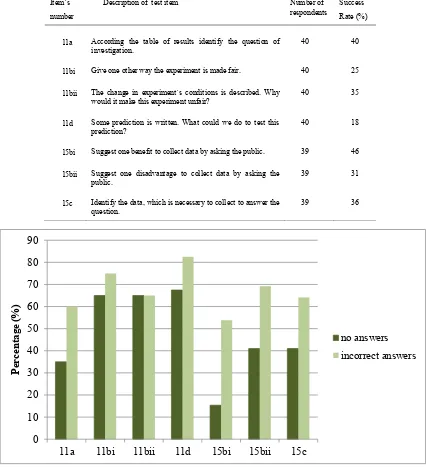
For each of seven items aimed to planning experiment is success rate lower than 50 %. It is illustrated in the figure below. We also evaluate the percentage of no answer (“I don´t know”).
Table 2.Items related to planning experiment
Item´s
number
Description of test item Number of respondents
Success Rate (%)
11a According the table of results identify the question of investigation.
40 40
11bi Give one other way the experiment is made fair. 40 25
11bii The change in experiment´s conditions is described. Why
would it make this experiment unfair?
40 35
11d Some prediction is written. What could we do to test this prediction?
40 18
15bi Suggest one benefit to collect data by asking the public. 39 46
15bii Suggest one disadvantage to collect data by asking the public.
39 31
15c Identify the data, which is necessary to collect to answer the question.
39 36
Fig.2 –Percentage for incorrect tasks items (“no answered” items as a type of incorrect tasks)
High percentage of “no answered” tasks assume that students have difficulty with this tasks on level of understanding (as a cognitive operation). We observed the same difficulties during the discussion with all of four groups (approximately 10 students in each). They did not show any interest for control variables. For example one pair ate a part of their yeast, other one forgot to add sugar. They considered the results of this at the end, when
0
11a
11bi
11bii
11d
15bi
15bii
15c
P
ercentage (%
)
no answers
their results did not match the pattern of behaviour of others. The students usually predicted, that more yeast means increased volume of dough. They did not expect any limitation although they can observe it in previous test task –
the temperature – volume graph has a maximum – so it does not match that if we increase temperature, the volume of dough should grow nevertheless.
When students failed to solve the tasks aimed to hypothesizing related to no special physical content, then it showed preposition for not completing tasks, which are also based on physical factual and conceptual knowledge.
b. Interpretation of results
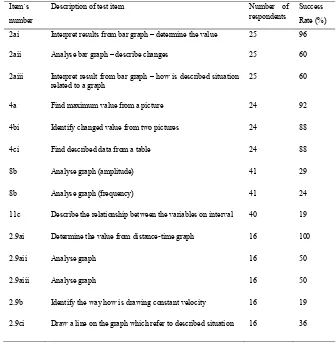
The results correspond to our expectations. We noticed higher success rate when (table 3):
x simple cognitive operation was required in tasks. (2ai, 4a, 4bi, 4ci, 2.9ai)
x we described change pattern in bar chart rather than line graph (2aii than 8b)
Table 3.Items related to interpretation of results
Item´s
number
Description of test item Number of respondents
Success Rate (%) 2ai Interpret results from bar graph – determine the value 25 96
2aii Analyse bar graph – describe changes 25 60
2aiii Interpret result from bar graph – how is described situation related to a graph
25 60
4a Find maximum value from a picture 24 92
4bi Identify changed value from two pictures 24 88
4ci Find described data from a table 24 88
8b Analyse graph (amplitude) 41 29
8b Analyse graph (frequency) 41 24
11c Describe the relationship between the variables on interval 40 19
2.9ai Determine the value from distance-time graph 16 100
2.9aii Analyse graph 16 50
2.9aiii Analyse graph 16 50
2.9b Identify the way how is drawing constant velocity 16 19
The success rate of task 2.9b was only 19 % - the worst result from all 32 item tasks. Students were able to solve it only particularly – they described the change of line but they did not describe changes qualitatively.
c. Making conclusions
There are five tasks evaluated in conclusions. Their success rate is illustrated by the figure below. We noticed lower success rate for these three – 4cii, 4ciii and 12a - which required also some physics factual and conceptual knowledge.
Fig.3 – Tasks items evaluated in conclusions.
5. Conclusion
We realize importance of summative assessment of science process skills. There has been ongoing national project of external online testing for all educational areas, including science education in Slovakia. In this study students fail the tasks related to design experiment. Also Harlen (2006) consider the skill to design experiment (including state hypothesizes) as one of the most important but also as one of the most challenging.
Demkanin (2012) points to necessity to discuss with teachers the benefits of students design experiments, because they consider this time not effectively spent. We described the activity which consists of taking few test tasks and related experiment to verify answers. We consider it very useful for development of science process skills, especially hypothesizing, controlling variables, planning experiment. We observe these benefits of taking test tasks first. For student – it helps him to determine what is important, suggest him some scheme, he can follow on his own experiment (analogy) and it is way how he realise what he does not know, what he needs to improve. For teacher is
first evidence of level of student´s performance –for what to aim to and discuss with them. Related experiment eliminates deficiencies of test tasks – if fail only for other cognitive skills (writing skills).We observed that this activity engaged students to design their own experiment to investigate something. Indeed we can mark it as formative assessment and we realise that there is a lot to research.
Acknowledgements
This paper was elaborated with support of project VEGA1/0509/13 and grant UK 573/2014.
0
10
20
30
40
50
60
70
80
90
100
4bii
4cii
4ciii
12a
15a
Success rat
e
(%
References
Demkanin P., Bartošovič L., &Velanová M. (2012). Simple multiplication as a form of presenting experience with introducing data loggers to
physics teachers who do not have any experience with usage of such tools in education. In EDULEARN 12Proceedings, Barcelona, Spain, 2 – 4 July (pp.2993-3002). IATED.
Harlen, W. (2006). Teaching, learning and assessing science 5-12. London: SAGE Publications Ltd.
Harlen, W. (2013). Assessment & Inquiry - Based Science Education: Issues in Policy and Practice. Trieste: The Global Network of Science Academies Science Education Programme.
NFER (National Foundation for Educational Research) (2009a). Mark scheme, Key stage 3. Retrieved from http://goo.gl/9wwhZ2
NFER (National Foundation for Educational Research) (2009b). Science test, Paper 2, Key stage 3, Tier 3-6. Retrieved from http://goo.gl/ojizSA NFER (National Foundation for Educational Research) (2009b). Science test, Paper 2, Key stage 3, Tier 5-7. Retrieved from http://goo.gl/o864Pq
Škoda, J. (2005). Současné trendy v přírodovědnémvzdělávání. Ústí nad Labem :Univerzita J. E. Purkyně v Ústí nad Labem.
SPU (Štátny pedagogický ústav) (2002). Standards for physics education. Retrieved from http://goo.gl/60nptt
SPU (Štátny pedagogický ústav) (2009). The National Curriculum of Slovakia for physics education. Retrieved from http://goo.gl/Q8WhDS
Velanová, M., Demkanin P., &Gergeľová, B. (2014). The experienced physics teacher and her first experience with data-logger. In: