Water Resources Assessment for City Area
M. Yanuar J. Purwanto and Sutoyo
Department of Civil and Environmental Engineering Bogor Agricultural University
Abstract— Many cities face problem scarcity of fresh and clean water now. However, our ability to correctly assess and predict city water availability, use and balance is still quite limited. City-water model is developed and used to assess water resources using system dynamics approach. It has shown that: (a) For economic growth scenarios, there is a strong relationship between the water resources and future industrial growth, and (b) In the existing condition of industries in Indonesia, cities the water pollution is the most important future water issue on the global level. Solutions for water problems are at the city level and the regional presented in this paper. City and regional characteristics of the water resources considerable increase in the complexity of the model. First results indicate that City-water model has a potential to identify water-related issues of domestic priority and assist policy makers in evaluating various sustainable solutions for sustainable water resources management.
Keywords- water demand, city, regional, assessment, water resources
I. INTRODUCTION
The water-use categories covered in general include: public water supply, domestic, commercial, industrial, mining, irrigation, livestock and animal specialties, thermoelectric power, and hydroelectric power. This paper only for the domestic or residential sector, in with the relative water use by this sector has also change over time. Population and class of income will affect to the total water demand in residential area (Pawitan et al, 1994).
In USA, residential water use includes water used for household purposes such as drinking, food preparation, bathing, washing clothes and dishes, flushing toilets, car washing, and watering lawns and gardens. Households include single and multi-family dwellings, such as apartments, condominiums, and small mobile home parks. Residential use is separated into inside household uses (bathing, flushing toilets, laundry, cleaning, and cooking) and outside household uses (lawn and garden watering, car washing, and pools). Inside uses tend to be consistent year round while outside uses tend to increase during specific seasons, usually summer, depending on the type of climate.
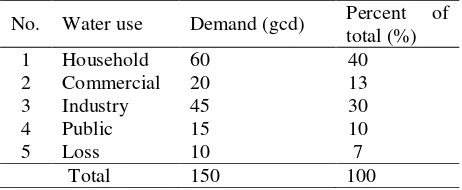
City water demand is equal with a total amount of water uses among city uses for total population per capita, and others consumptions in the city. Based on the standard water demand by Gupta (1989) it was determined that for residential area is required as much as 60 gallon per capita day (Table 1). White et al., (1972) reported water demand using common public outlet is about 15 – 90 liter/person/day
[image:2.612.324.555.224.319.2]and water demand using individual outlet is about 30 – 300 liter/person/day. From these number of water demands, there is evidence that within population in the residential area, at least three different classes of income which consume water differently from each class to the others.
Table 1. Daily water demand per capita
No. Water use Demand (gcd) Percent of
total (%)
1 Household 60 40
2 Commercial 20 13
3 Industry 45 30
4 Public 15 10
5 Loss 10 7
Total 150 100
Source : Gupta (1989), gcd= galon capita/day
Water use can be determined either for site-specific facilities or for categories of water use for a given area. Determining site-specific water use involves water withdrawal, delivery, release, and return-flow data. Area estimates are based on coefficients relating water use to another characteristic, such as number of employees, and applying it to an inventory of site-specific users or by measuring a statistical sample of the user population.
Winrock (1992), Directorate General of Public Work Cipta Karya set for domestic water needs of the rural community is 45 lcd (liter capita / day) and for the city of 60 lcd. Main factors that determine the amount of water the city needs is the number of population and the accuracy of the projected population will be very important to predict the water needs in the future (Pawitan et al, 1994).
The amount of water needs for each industry is not the same to the domestic. It depends on several factors, among the number of employees, work units, the length of working hours, and others. To determine the needs for industrial water supply in urban areas can be categorized into three types based on the number of usage, big industry around 151 - 350 m3/hari, medium industry are around 51 - 150 m3/hari, and small industries ranging from 5 to 50 m3 / day (Purwanto, 1995).
The objective of this study is to develop water assessment model especially water demand analysis of city for basin area.
template provides authors with most of the formatting specifications needed for preparing electronic versions of
their papers. All standard paper components have been specified for three reasons: (1) ease of use when formatting individual papers, (2) automatic compliance to electronic requirements that facilitate the concurrent or later production of electronic products, and (3) conformity of style throughout a conference proceedings. Margins, column widths, line spacing, and type styles are built-in; examples of the type styles are provided throughout this document and are identified in italic type, within parentheses, following the example. PLEASE DO NOT RE-ADJUST THESE MARGINS. Some components, such as multi-leveled equations, graphics, and tables are not prescribed, although the various table text styles are provided. The formatter will need to create these components, incorporating the applicable criteria that follow.
II. THE METHOD
Methods of estimating water use vary widely. The use of consistent methods, estimation techniques, terminology, and definitions for water-use data acquisition help ensure that the water-use estimates will meet certain requirements. For residential area, water demand was derived from the formula of evapotranspiration by Penman Method as follows:
Kc
ETo
ETc
(mm/day) ………. (1)Kc
ETo
ETc
0
.
116
(l/sec/ha) ……. (2)where :
ETc = Actual evapotranspiration of crop,
mm/day
ETo = Potential Evapotranpiration by Penman, mm/day
Kc = Crop coefficient
By the same common sense that population in the citty area have their specific water demand as crops population, water demaqnd for people can be formulated as follows:
CP
KaP
P
pP
y
Person
(
)
and
ETc
Ha
0
.
116
ETo
Kc
.where :
ETc for crop y for person
Crop Area (Ha) Residential Area (pP x P) Consumtive Use (Eto) Individual Use (KaP) Crop Coefficient (Kc) Coefficient of Income class (CP)
Then, water demand in the residential area with total population (P), standard individual use (KaP), percentage of class income covers m class incomes (pP), the water demand is:
m i i iPerson
p
P
P
KaP
C
P
y
1
(3)
This water demand is an area estimates based on coefficients relating water use to another characteristic of
person’s income CiP and applying it to an inventory of site -specific users and by measuring a statistical sample of the
user population. Coefficients are most reliable when they are applied to uniform groups of users from which the coefficients were developed, such as the same income groups identified by the Indonesian governmental statistics book. With the same assumption, water demand for industry can be calculated using the above formula by replacing population as unit of industry, and also adopting the class of industry as
for person’s income parameter..
Data and Location of Study.
Cilegon city is selected for this study. Inventories of all users were collected at the KTI costumers. KTI is a local clean water company for residential and industrial uses. To have accurate data, inventory of reported data was investigated. Secondary data acquisition involves compilation evaluation and analysis of measured data reported to the KTI headquarters at Cilegon. Surveyed data were collected in response to a specific need for the data in 1999 to 2000.
Residential and industry water uses are determined primarily through the use of coefficients of use per unit of water demand. Reasonable per capita (or unit o\industry) value were determined as 30 liter/person/day base on White et al., (1972). Coefficient values were evaluated by reviewing recorded KTI reports. The actual measurements are done by reading existing meters and using time totalizes to record flowing duration. Possible criteria for developing stratified subsets include the number of households in the unit or size of lot. Residents may be surveyed to determine other important criteria, such as income distribution and income class.
Stratified-random sampling is one form of sampling that offers considerable efficiency in water-use estimation and involves separating sites with similar water-use characteristics into groups or strata. Stratified-random sampling can increase the reliability of estimates on the basis of sample "means." The technique is used when there are known groups with particular water-use characteristics (Stratification divides the population into internally similar groups).
Water Demand Model
Mathematical equation model for water demand built on summation of water demand for each user. Model for the water demand of domestic population consists of several parameters, the percentage of social level population, the number of population, the water needs of the average population and the constant of the respective social level. Model of the water demand of industry consists of several parameters, the percentage of type of industry, the number of industries, the water needs of the industry average and the constant of each type of industry. Development of the community not only related to population growth but must also be followed by the adequate of employment. Increasing of employment is subject to the availability of water storage. Water is needed to operate the sector of employment and meet the needs of domestic water in the area. The success of
337
the development community on region occurred when the water for domestic and employment available, so that the predicted water demand become important in the development of the regional planning. Model built with the framework that are mathematically related of the needs of water and then simulated so that the output form of the water demand for years to come.
III. RESULT AND DISCUSSION
Water uses for residential area using waterflow meter compiled at the KTI Headquarter office were use for calibration proses by trial and error. The water demand parameter for 1999 are as follows: a) Total Population in 1999 = 278 462 person, b) Total Actual water demand in 1999 = 8 127 800 liter, c) Standard Water demand is 30 liter/person/day, and d) Population Percentage base on income classification are 16.15%, 50.26% and 33.59% for P1P, P2P and P3P respectively. Base on those condition, CiP for The three income classes are 2.58, 1.47,0.51 for C1P, C2P and C3P respectively. As the result, total water demand in 1999 was found as about 8 207 500 liter. Validation of the model was done by using set data of 2000 and 2001 as shown in Table 2.
Table 2. Validation Model residential Water Demand of Cilegon District in 2000 and 2001
Year C1P C2P C3P Water Demand
Model
Water Demand
Actual R
2
2000 2.58 1.47 0.51 9 619 100 9 483 100 0.9857
2001 2.58 1.47 0.51 11 344 400 10 110 000 0.8849
Note: Unit for the water demand is liter/day.
By using the same method, water user for industry in Cilegon city were calculated by considering: a) Number total industry in 1999= 58 units, b) Total actual industry water demand = 89 211 476.92 liter, c) Standard water demand is 100 liter/unit/day with coeff demand for each type of industry are: 2.5, 1.0, and 0.25 for large, medium and small industries respectively, and d) percentages of population of industry are 39.35%, 8.2% and 52.45% for large, medium and small industries respectively. And the total water demand for industrial sector in 1999 is 121676940 liter.
For industrial water demand, validation of the model reach correlation value more than 0.8 for two years validation processes (2000 and 2001).
Model Aplication
The established model was used for predicting the amount of water demand in the future. Based on the annual population in 1999 to 2001, population growth in Cilegon district was predicted as the following equatiuons, y = 21 048 ln(x) + 278 970. The prediction of population water demand annually in 2020 is 16958971 liter and for industri is 608384700 liter. This amount of water reflect number
population with highest income reach 50% of population. This number is almost three times than of 1999. It is means that, water availability give significant contribution in increasing number of highest income people in the city.
IV. Conclusions
As conclussion of this study, the model of water demand for residential area in Cilegon Districts was established. The model consists of three water demand classes based on their income levels. Actual water allocations for residential area in Cilegon district, Banten Province, were used for the model calibration process. The model can be operated for the future water demand prediction using population growth and the income classification. The established model was used for predicting the amount of water demand in the future with the advantage as for guiding the local government in providing water for the residential area in relation with the effort to increase individual income level of the citizen. For example in 2020, number of the highest income in the city will increase almost three time when industrial water sector in available almost 6 times than water demand in 1999.
REFERENCES
[1] Cilegon Statistic Bureau. 2002. Cilegon in Figure 2002. Cilegon [2] Gupta, R., 1989. Hydrologi and Hydraulic System. Prentice Hall Inc.
New York.
[3] Linsley, R.K., M.A Kohler and J.J.H Paulus. 1982. Hydrology for Engineers. McGraw Hill Inc. New York.
[4] Martin, L. A. 1997. First Step, MIT System Dynamics in Education Project. Massachusetts Institute of Technology. Massachusetts. USA [5] Pawitan, H. 1995. Analysis method to predict erosion and
sedimentation on watershed. Puslitbang Pengairan, Bandung. [6] Purwanto, M.Y.J. 1995. Water Demand for Industry, Village, and
City. Seminar on Water Demand and Developing Country. Tokyo . Japan.
[7] Sugawara, M. 1961. On the Analysis of Runoff Structure about Several Japanese. River. Japanese Journal of Geophysic. Vol 4 No.2 March 1961. The Science Council of Japan. Japan.
.
338