INVESTIGATING RUTTING PERFORMANCE OF FOAMED COLD-MIX ASPHALT UNDER SIMULATED TRAFFICKING
Sri Sunarjono
Department of Civil Engineering, Muhammadiyah University of Surakarta Jl. A. Yani Tromol Pos I Pabelan Kartasura Surakarta 57102 Phone 0271-717417 ext 221
E-mail: [email protected]
ABSTRACT
A trial section of a foamed cold mix asphalt (FCMA) pavement was constructed and investigated under simulated trafficking in the Pavement Test Facility (PTF). A combination of crushed limestone and reclaimed asphalt pavement (RAP) aggregates with selected binder was used to simulate recycled construction. Trafficking was carried out at an approximate velocity of 3 km/hr for various applied single wheel load applications. The results have provided preliminary indication of rutting resistance characteristics of foamed asphalt material. The rutting performance depends on the mixture proportion, binder type and the presence of cement. It was found that foamed bitumen bound mixtures that contained a higher proportion of RAP and a softer binder exhibited greater deformation. The effect of mix proportions and penetration grade of the binder on rutting was more pronounced during early life and at low loads, but when the mixture was subjected to higher loads, this effect was less significant. It was also well observed that the use of small amount of cement can accelerate the curing process and significantly reduced the measured rutting.
Keywords:Foamed asphalt, rutting, reclaimed asphalt pavement, cement, simulated trafficking.
INTRODUCTION
Foamed cold-mix asphalt (FCMA) has been successfully implemented in many roads across the world especially in recycling projects. The use of this mixture can potentially conserves fresh aggregates and bitumen, minimises waste, saves energy and fuel consumption and reduces greenhouse gas emission. Discussion of this material can be found in Widyatmoko and Sunarjono (2007) in terms of considerations to implement this technology for road construction in Indonesia.
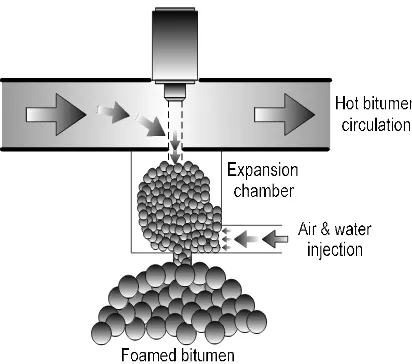
FCMA can be generated by mixing of sprayed foamed bitumen and wet cold aggregate. Foamed bitumen enables the coating of wet aggregates at ambient temperature to form foamed asphalt for road pavement material, whereas foamed bitumen can be produced by injecting a small amount of air and cold water into hot bitumen.
The use of foamed bitumen in road construction using a cold system can be achieved
either by ‘in-plant (ex-situ)’ or ‘in-place (in-situ)’
technology. In neither system is it necessary to heat the aggregate materials (either recycled or fresh aggregates) prior to mixing with foamed bitumen. In-plant mixing enables control of input materials and mixing quality and also the material produced can be stored for later use, whereas in-place treatment offers a cost effective and rapid form of road rehabilitation with relatively lower quality than in-plant mixing method.
Not all aggregate particles are coated by binder. The sprayed foamed bitumen enables coating of wet aggregates and is seen on fine particles only. If the predetermined aggregate moisture is incorrect and the quantity of fine particles is insufficient, the resulting mixture becomes unworkable (see Brennen et al, 1983). Moreover, if both moisture and fines have been prepared correctly, but this is not accompanied by proper design of selected foamed bitumen characteristics (see also Muthen, 1999) and suitable mixing (see also Long et al, 2004); the resultant mixture will be inconsistent and hence its performance will be unpredictable.
This paper presents a pilot scale experiment of foamed asphalt mixture in the Pavement Testing Facility. The purpose of this pilot scale trial was to simulate trafficking and to understand the rutting resistance of FCMA materials.
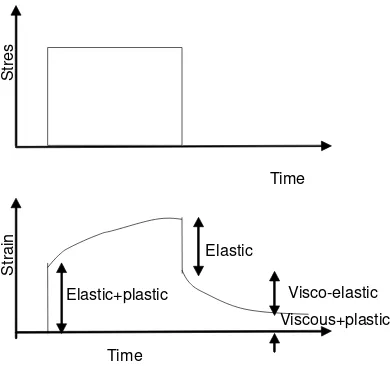
manifests as rutting in the pavement. This phenomenon is illustrated in Figure 1. Rutting may be the result of permanent deformation from various layers, and is often divided into structural rutting (granular and base layers) and non-structural rutting (surfacing). It is well understood that rutting is influenced by mixture properties i.e volumetric composition and material properties.
Figure 1. Idealised response of a bituminous mixture
Two major mechanisms of rutting are densification (compaction) due to the repeated loading and plastic shear deformation due to the repeated action of shear and tensile stress. If a pavement has been well compacted during construction, further densification during rutting is unlikely, and permanent deformation is principally due to shear flow (Eisenmann and Hilmer, 1987).
PAVEMENT TEST PROGRAM Pavement Test Facility (PTF)
The PTF is housed in the laboratory of the Nottingham Transportation Engineering Centre (NTEC), UK. The movement of the wheel is controlled by a hydraulic motor which pulls a steel rope (attached to both sides of the carriage housing the wheel) in both directions. Figure 2 represents the PTF with a pit area of 2.4m x 4.8m. The maximum load and speed that can be applied are 15 kN and 8 km/hr respectively.
Figure 2. The PTF housed in NTEC
Mixture Combination
The PTF pit area was divided into 6 sections of which 4 sections were FCMA pavement composed of various mixture proportions and binder types (Mix 1 to Mix 4); the other 2 sections did not form part of this research. The 4 combinations of FCMA mixture were:
Mix 1: 75%RAP aggregate and bit Pen. 50/70, Mix 2: 75%RAP aggregate and bit Pen. 70/100, Mix 3: 50%RAP aggregate and bit Pen. 70/100, Mix 4: 50%RAP aggregate and bit Pen. 70/100 +
1.5% cement. [Note: RAP= Reclaimed Asphalt Pavement, bit = bitumen]
Mixture design tests were carried out to optimise the properties and/or content of binder for each mixture type. The mixtures were subsequently mixed and compacted at optimum binder contents.
Trial Pavement Layer
The thickness of the trial pavement was purposely designed to ensure that the pavement would suffer some degradation within a reasonable number of load applications. It was decided to construct the pavement as thinly as practically possible. Thus, the trial pavement layer thickness was selected at 80 mm.
The trial layer was paved onto an existing PTF foundation which consisted of a 450mm crushed limestone sub-base sitting on top of a Keuper Marl clay subgrade (see Figure 3). It was found that the CBR values of all sections were less than 1%. This value is less than the minimum CBR requirement for a foundation platform for UK roads up to 5 msa, i.e. 2% (TRL 611, Merrill et al 2004) and may therefore cause excessive rutting under heavy traffic load. Whereas strength of the foundation (subbase and subgrade layer) was found to be 60 MPa measured using a Light falling weight deflectometer.
S
tr
e
s
S
tr
a
in
Elastic
Visco-elastic Viscous+plastic Elastic+plastic
Time
Once constructed and cured for a fixed duration, the trial sections were trafficked using a single loaded wheel. The performance of the pavement was assessed at frequent intervals by monitoring the magnitude of accumulated permanent surface deformations (rutting) in the wheel path during trafficking.
Figure 3. The trial pavement layer laid on top of the existing PTF foundation
MATERIALS Aggregate
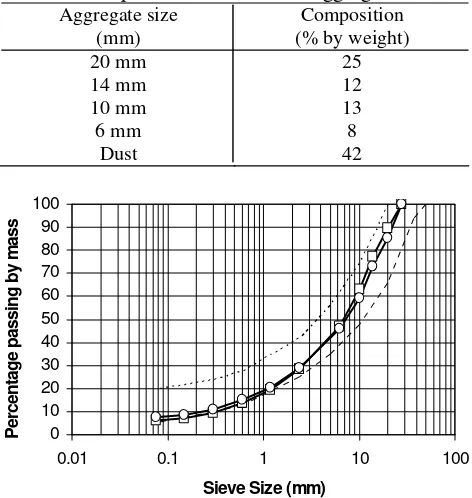
The reclaimed Asphalt Pavement (RAP) material was collected from an asphalt producer with an in-plant asphalt recycling facility. This material was originally milled from various asphalt roads and brought together into one stockpile. The gradation of RAP can be seen in Table 1. Whereas the virgin crushed limestone aggregate was collected and stored separately in six stockpiles according to the following size fractions: 20 mm, 14 mm, 10 mm, 6 mm, fines and filler and was composed to meet a combination as seen in Table 2. Aggregate and RAP were blended together and 5% of filler by weight of dry aggregate (i.e. RAP + limestone) was added to adjust the gradation curves of the mixtures to meet the recommended ideal grading envelope for foamed asphalt (Akeroyd and Hicks, 1988). Figure 4 shows the gradation curves of these mixtures.
Table 1. Gradation of RAP
Cumulative Passing (%) Size
RAP RAP’sAggregate
20 mm 93.7 99.1
14 mm 80.6 87.9
10 mm 64.8 74.4
6.3 mm 44.8 60.5
2.36 mm 24.6 44.3
1.18 mm 14.3 35.2
0.600 mm 8.4 28.7
0.300 mm 3.5 20.0
0.150 mm 1.1 13.2
0.075 mm 0.4 9.7
Table 2. Composition of limestone aggregate Aggregate size
(mm)
Composition (% by weight)
20 mm 25
14 mm 12
10 mm 13
6 mm 8
Dust 42 0 10 20 30 40 50 60 70 80 90 100
0.01 0.1 1 10 100
Sieve Size (mm)
P e rc e n ta g e p a s s in g b y m a s s
Recommended range 75%RAP 50%RAP
Figure 4. Gradation of the studied blends
Foamed bitumen (FB)
FB was generated using the Wirtgen WLB-10 laboratory foaming plant. The FB production that combination of hot bitumen, air and water is illustrated in Figure 5. Two penetration grade bitumens, Pen 50/70 and Pen 70/100, were selected for the production of foamed bitumen. FB is commonly characterised in terms of its Expansion ratio (ER) and Half-life (HL). During the bitumen foaming process, the foamed bitumen would expand to a maximum volume and then the bubbles would collapse rapidly. ER is defined as the ratio between maximum volume achieved and the volume of original bitumen. HL is the time that the foam takes to collapse to half of its maximum volume. Based on the intensive investigation, a temperature of 160◦C and a water content of 2.0% by mass of bitumen were selected to create the most stable foam for both bitumens. The corresponding maximum ER and HL values were 15 times and 9 seconds for Pen 50/70, and 17.5 times and 16.5 seconds for Pen 70/100 respectively. 8 0 4 5 0
Dimension in Millimeter (NOT TO SCALE) Crushed Limestone subbase
Keuper Marl clay Subgrade F
o u n d at io n Embedment strain
Figure 5. Foamed bitumen production
Mixture design
In order to optimise the end product performance the laboratory mixture design tests were carried out and the results can be seen in Table 3.
Table 3. The results of mixture design RAP proportion Parameters
50% 75%
Maximum dry density (MDD) (Mg/m3)
OMC (% by weight of aggregate)
Foamed bitumen content (% by weight of agg.) Strength at 20oC
2.200
2.7
2.7
375kPa (ITS)
2.020
2.5
2.5
1250MPa (ITSM)
Water was added to all mixtures at 72% OMC and mixed using the Hobart mixer for one minute before and after foam spraying. All mixtures were compacted using the Marshall Hammer with 2x75 blows. All specimens were oven cured at 40oC for 3 days prior to the Indirect Tensile Strength (ITS) and Indirect Tensile Stiffness Modulus (ITSM) test, in order to determine the optimum foamed bitumen content for both mixture proportions.
CONSTRUCTION PROCESS
The foamed asphalt materials were mixed in a Hobart mixer at the optimum moisture and binder contents based on the mix design results. The mixtures were stored in sealed containers at room temperature for approximately 15 days. For the foamed bitumen plus cement mixture, the RAP and aggregate were treated with foamed bitumen first and
the product was then stored. On the day of compaction, cement and an additional quantity of water were then mixed with the foamed bitumen treated material using a concrete mixer. The materials were then placed into the PTF pit, spread and compacted. A plate compactor was used to compact the materials in a single layer. The time required to lay and compact all the sections in the trial pavement was such that most sections would have been left to cure in the compacted state for at least 13 days before trafficking commenced. The exception was the section that was composed of foamed bitumen plus cement as the binder, which was cured for only 8 days before trafficking.
TRAFFICKING
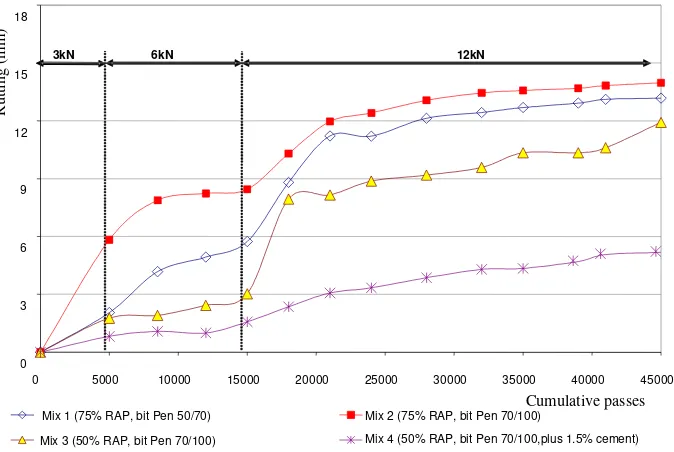
Trafficking was carried out at an approximate velocity of 3 km/hr. The magnitude of the first applied wheel load was selected at 3kN for the first 5000 passes, the next 10,000 passes were at a wheel load of 6kN, and the remaining passes were at a wheel load of 12kN. Trafficking was terminated when the cumulative number of passes was equal to 45,000 passes per lane.
INVESTIGATION Visual inspection
The pavement surface was visually inspected at every 3000 to 4000 wheel passes. The sections with no cement additive started to rut as soon as the first load was applied (i.e. 3 kN). Rutting occurred only in the wheel path. It was also observed that, on every occasion that the magnitude of wheel load was increased, there was a significant immediate rise in rut magnitude. At each load level, the rutting rate was found to gradually decrease with increasing number of wheel passes. After the wheel load was increased to 12 kN, i.e. the maximum load selected in this investigation, and when no more significant increase in rut depth was noticed, it was decided to terminate the test. Trafficking was thus terminated after 45,000 wheel passes per lane.
height of the shoulder of the rutting, generate longitudinal cracking.
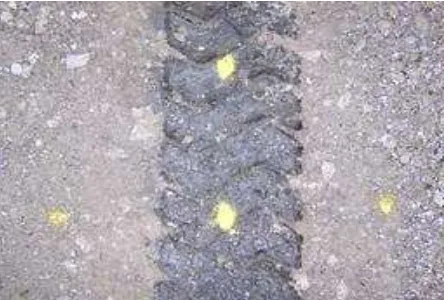
The excessive rutting at the wheel path was accompanied by bleeding, i.e. excess binder on the surface, as shown in Figure 7. At high load pressure, the uncoated coarse aggregates probably separate from the foam mastic, hence the coarse aggregates go down while the binder goes up.
Figure 6. Appearance of longitudinal cracks observed at both sides of the wheel path (coloured black)
Figure 7. Appearance of the excessive rutting at the wheel path with formation of bleeding
Rutting (permanent deformation) measurement The surface rutting of each section was measured using a straight edge at 7 points at equal intervals along the wheel path. It was found that the initial surface profile along the wheel path was not flat. However, the calculated average pavement thickness along the wheel path was close to 80mm.
The average surface rutting along the wheel path of the trial sections is shown as a function of load applications in Figure 8. Rutting was developed to varying degrees in all sections. In terms of the
amount of rutting, the mixtures can be ranked as presented in Table 4.
Table 4. Ranking of rutting (1= best and 4= worst)
Mixture type Ranking
Mix 4: 50%RAP, Pen70/100 + cement 1
Mix 3: 50%RAP, Pen70/100 2
Mix 1: 75%RAP, Pen50/70 3
Mix 2: 75%RAP, Pen70/100 4
The differences in the rut depth values between different mixtures indicate that the rutting potential of recycled mixtures depends on the binder type, mixture proportion and the presence of cement. In general, FCMA that contained a higher proportion of RAP and a softer binder exhibited greater deformation. A mixture using a higher RAP proportion implies a higher total binder (old and new) content due to the presence of old binder in the RAP. This will give less resistance deformation since the binder film around the aggregate particles becomes thicker.
The effect of mix proportions on rutting was more pronounced during early life and at low loads, but when the mixture was subjected to higher loads, this effect was less significant. The mixture using a higher RAP proportion had lower compactability (at the same aggregate gradation it gave a lower maximum dry density) and hence probably resulted in higher void content which allowed greater deformation in the form of compaction by traffic.
The penetration grade of the binder also affected the rutting during the early life and at low load. The harder penetration grade bitumen produces a foam that improves the mixture resistance to permanent deformation. However, when the mixture is subjected to higher loads, a harder penetration grade bitumen makes little difference compared to a softer grade bitumen. This implies that at a higher load, the mixture resistance to permanent deformation is mainly affected by the aggregate interlock rather than bitumen properties.
binder. On the other hand, at high loads, the binder contribution to the mix behaviour was less evident and the deformation behaviour of the mixtures was
primarily governed by the aggregate interlock regardless of the binder grade.
Figure 8. Average surface rutting for each mixture type
The effect of adding a small amount of cement is clearly observed from the performance of Mix 4. The magnitude and rate of deformation of Mix 4 was clearly smaller than that of all the other mixtures. When the test was terminated at 45,000 load applications, all three foamed bitumen bound sections with no added cement developed significant surface deformation with an average rut depth greater than 12mm. On the other hand, the foamed bitumen bound section containing 1.5% cement deformed on average by only 5mm. This 60% decrease in rutting indicates a significant increase in permanent deformation resistance caused by the inclusion of cement as an additive. A small amount of cement can effectively work to accelerate the moisture loss and hence the mixture strength gains faster at early age, reducing the measured rutting.
CONCLUSIONS
Following the work described in this paper, it can be deduced that, in general, the rutting potential of foamed asphalt mixtures depends on the mixture proportion, binder type and the presence of cement. It was found that foamed bitumen bound mixtures that contained a higher proportion of RAP and a softer binder exhibited greater deformation, whereas the use of cement can accelerate the curing process,
enhance the strength of the material at early age and significantly reduced the measured rutting.
The evidence of rutting in foamed asphalt mixture is mainly due to densification and the weakness of cohesive strength within the mix during early life. The effect of mix proportions and penetration grade of the binder on rutting was more pronounced during early life and at low loads, but when the mixture was subjected to higher loads, this effect was less significant. At high loads, the binder contribution to the mix behaviour was less evident and the deformation behaviour of the mixtures was primarily governed by the aggregate interlock regardless of the binder grade.
ACKNOWLEDGEMENTS
The author is very grateful for the assistance and advice of Dr. N.H. Thom and Dr. S.E. Zoorob, and for many helpful discussions with Dr. P. Jetareekul and Dr. M.H. Sutanto. This work was carried out with the financial support of TPSDP program SPMU-UMS unit Civil Engineering.
REFFERENCES
Airey, G.D., 2002a. Permanent deformation. Residential course on bituminous pavements,
0 3 6 9 12 15 18
0 5000 10000 15000 20000 25000 30000 35000 40000 45000
Cumulative passes
R
u
tt
in
g
(
m
m
)
Mix 1 (75% RAP, bit Pen 50/70) Mix 2 (75% RAP, bit Pen 70/100)
Mix 3 (50% RAP, bit Pen 70/100) Mix 4 (50% RAP, bit Pen 70/100,plus 1.5% cement)
materials, design and evaluation, Lecture notes, University of Nottingham, School of Civil Engineering, 8th-10th April 2002.
Akeroyd, F.M.L. & Hicks, B.J., 1988. Foamed Bitumen Road Recycling. Highways, Volume 56, Number 1933, pp 42, 43, 45.
Brennen, M., Tia, M., Altschaeffl, A.G. & Wood, L.E., 1983. Laboratory Investigation of The Use of Foamed Asphalt for Recycled Bituminous Pavements. In: Asphalt materials, mixtures, construction, moisture effects and sulfur. Washington, DC: Transportation Research Board. (Transportation Research Record; 911), pp 80-87. Brown, S. F., 2000. Introduction to Pavement
Design. In the Residential Course on Bituminuous Pavements, Materials, Design and Evaluation. Lecture Notes, University of Nottingham, School of Civil Engineering. 3rd-7th April 2000.
Eisenmann, J. and Hilmer, A., 1987. Influence of Wheel Load and Inflation Pressure on The Rutting Effect at Theoretical Investigations. Proc. 6th Int. Conf. on the Structural Design of Asphalt Pavements, Ann Arbor, Michigan, USA.
Long, F.M., Theyse, H.L. and Ventura, D.F.C., 2004. Characterisation of Foamed Bitumen Treated Material from HVS Test Section. CSIR Transportek, PO Box 395, Pretoria, 0001, South Africa.
Merrill, D., Nunn, M. and Carswell, I., 2004. A Guide to The Use and Specification of Cold Recycled Materials for The Maintenance of Road Pavements. TRL Report TRL 611. First published 2004, ISSN 0968-4107, Copyright TRL Limited 2004.
Muthen,K.M., 1999. Foamed Asphalt Mixes, Mix Design Procedure Contract Report CR-98/077, June 1999. CSIR Transportek, South Africa. Widyatmoko, I. and Sunarjono, S., 2007. Some
considerations to implement foamed bitumen technology for road construction in Indonesia. The 1st International Conference of European Asian Civil Engineering Forum (EACEF) at Universitas Pelita Harapan, 26 - 27 September 2007.