“ANALYSIS OF THE EFFECT OF INFLATION RATE,
INTEREST
RATE AND EXCHANGE RATE ON STOCK RETURN OF CONSUMER
GOODS AND PROPERTY AND REAL ESTATE SECTOR IN
INDONESIA STOCK EXCHANGE (IDX) 2006-2010
”
Submitted by:
Ariningtyas Widyasnia Agustina Student ID:107081101584
INTERNATIONAL UNDERGRADUATE PROGRAM MANAGEMENT DEPARTMENT
FACULTY OF ECONOMICS AND BUSINESS UIN SYARIF HIDAYATULLAH JAKARTA
i ACKNOWLEDGEMENT
My greatest gratitude to Allah SWT, the Grandest and Almighty, the Most Gracious and the Most Merciful, for giving me the chance and ability to complete this thesis,and for all the miracles He has granted to my life. May the talent You have bestowed upon me will not got to waste. My greatest ggratitude to Prophet Muhammad SAW for the teachings and love he has spread to all the creatures in this whole universe. May we all always under his guidance.
First and foremost, I would like to thank to my thesis supervisors; Prof. Dr. Ahmad Rodhoni, MM and Mr. Tirmidzi Taridi,MBA for their help, time, contribution and effort in providing guidance and constructive suggestion to perform this study, and for the understanding and support they had given.
I would also like to thank to the head of International Program, Faculty of Economics and Business, UIN Syarif Hidayatullah Jakarta, Mr. Arief Mufraini, Lc. M.Si, and his deputies Mr. Ahmad Dumiyati. Also, thanks to Kak Sugih, for his patients in accomodating all of my administrative needs. Thank you.
This thesis will never be completed without the continous support and prays from my friends, collagues, and people around me. Thank you for the people in my current internship place, Bank Indonesia, the place where this thesis born. I would also like to thank to my bestfriends in International Program Batch 4; Sukria, Andrea Ardilla, Wike Vidya, Pramayassya, Fitra, Weldan, Muhammad Kharisma and all,
whose name can’t be mentioned one by one. Individually, thank you to Aprima Arta for his continous support and understanding during my hardest time in making this thesis.
ii ABSTRAK
Penelitian ini bertujuan untuk menganalisis pengaruh suku bunga, inflasi, dan nilai tukar terhadap tingkat pengembalian saham pada sektor properti dan real estate serta sektor industry barang konsumsi periode 2006-2010. Penelitian ini menggunakan model regresi linear berganda. Berdasarkan hasil penelitian, secara parsial suku bunga berpengaruh signifikan negatif terhadap tingkat pengembalian saham property dan real estate dan tingkat pengembalian saham barang konsumsi .Inflasi tidak berpengaruh terhadap tingkat pengembalian saham property dan real estate serta saham barang konsumsi. Nilai tukar berpengaruh signifikan negatif terhadap tingkat pengembalian saham property dan real estate serta saham barang konsumsi. Hasil penelitian juga menunjukkan bahwa suku bunga, inflasi, dan nilai tukar berpengaruh lebih besar terhadap tingkat pengembalian saham property dan real estate daripada saham barang konsumsi.
iii ABSTRACT
This research shows the effect of inflation rate, interest rate, and exchange rate on stock return of property and real estate and consumer goods sector in period 2006-2010. A multiple regression model is applied to test the significance of influence between the independent variable and the dependent variable. Based on the result, partially interest rate has a negative effect to stock return of property and real estate sector and consumer goods sector. Inflation has no effect to stock return of property and real estate and consumer goods sector, while exchange rate has negative effect to stock return of property and real estate sector. The result shows that the inflation rate, exchange rate, and interest rate have a bigger effect on stock return of property and real estate sector than consumer goods sector.
iv LIST OF CONTENTS
CHAPTER 1: INTRODUCTION __________________________________________ 1
A. Background ________________________________________________________ 1 B. Problem Formulation ________________________________________________ 6 C. Research Objectives _________________________________________________ 8 D. Usefullness of the Research ___________________________________________ 8
CHAPTER 2: LITERATURE REVIEW ____________________________________ 13
v
CHAPTER 3: RESEARCH METHODOLOGY ______________________________ 40
A. Data Collection ____________________________________________________ 40 1. Unit of Analysis and Research Sampling _______________________________ 40 2. Types of Data ____________________________________________________ 41 B. Research Models ___________________________________________________ 41 3.3 Operational Variable _______________________________________________ 42
3.3.1 Stock’s Rate of Return __________________________________________ 42 3.3.2 Inflation Rate __________________________________________________ 43 3.3.2 Exchange Rate _________________________________________________ 44 3.3.2 Interest Rate ___________________________________________________ 45 3.4 Data Analysis Technique ____________________________________________ 45 3.4.1 Normality Test _________________________________________________ 46 3.4.1.1 Jarque-Bera Test of Normality _________________________________ 47 3.4.2 Classical Assumption Test _______________________________________ 48 3.4.2.1 Heteroscedastic Test _________________________________________ 50 3.4.2.2 Autocorrelation Test _________________________________________ 53 3.4.2.3 Multi-Collinearity Test _______________________________________ 54 3.4.3 Hypothesis Test ________________________________________________ 55 3.4.3.1 T Test ____________________________________________________ 55 3.4.3.2 F Test ____________________________________________________ 55 3.4.3.3 R Square (R2) Test __________________________________________ 56 3.4.4.4 Adjusted R Squared Test _____________________________________ 56 3.5 Research Design __________________________________________________ 57
CHAPTER 4: RESEARCH FINDINGS AND ANALYSIS _____________________ 58
vi 4.2 Descriptive Statistic ________________________________________________ 59 4.3 Normality Test ____________________________________________________ 60 4.4 Classical Assumption Test ___________________________________________ 62 4.4.1 Heteroscedasticity Test __________________________________________ 62 4.4.2 Auto-Correlation Test ___________________________________________ 64 4.4.3 Multi-Collinearity Test __________________________________________ 65 4.5 Multiple Linear Regression Model ____________________________________ 66 4.6 Hypothesis Testing ________________________________________________ 67 4.6.1 T-Test _______________________________________________________ 67 4.6.2 f Test ________________________________________________________ 81 4.6.3 R-Squared (R2) ________________________________________________ 81 4.6.4 Adjusted R-Squared ____________________________________________ 82 4.7 The comparison between macroeconomic factors’ influences towards the
stock’s return on consumer goods and property and real estate sector _________ 83
CHAPTER 5: CONCLUSION AND IMPLICATIONS ________________________ 84
5.1 Conclusion ______________________________________________________ 84 5.2 Implication of Study _______________________________________________ 85 5.2.1 For the Investor ________________________________________________ 85 5.2.1 For the Researcher ______________________________________________ 85 5.3 Limitation _______________________________________________________ 86
REFERENCES
APPENDIX I
vii LIST OF FIGURES
viii LIST OF TABLES
ix LIST OF FORMULAS
“In the name of Allah, the Most Gracious, the Most Merciful....
All praise be to God alone, the Lord of all the world, the All-Merciful, the Ever Mercy-giving,
and the Master of the Day of Judgement.
You alone we worship, and You alone we ask for help.
Guide us on the right path,
The path of whom You have blessed, not of those who incur You anger, nor of those who go
astray...”
Data of Inflation Rate
Year Month Inflation Change in Inflation 2005 December -0.04
2007 January 1.04 -0.140495868
February 0.62 -0.403846154
2008 January 1.77 0.609090909
August 0.51 -0.627737226
2010 January 0.84 1.545454545
EVIEWS 5 OUTPUT (Consumer Goods Sector)
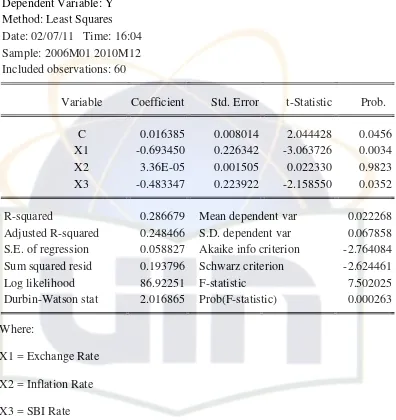
MULTIPLE REGRESSION Dependent Variable: Y Method: Least Squares Date: 02/07/11 Time: 16:04 Sample: 2006M01 2010M12 Included observations: 60
Variable Coefficient Std. Error t-Statistic Prob.
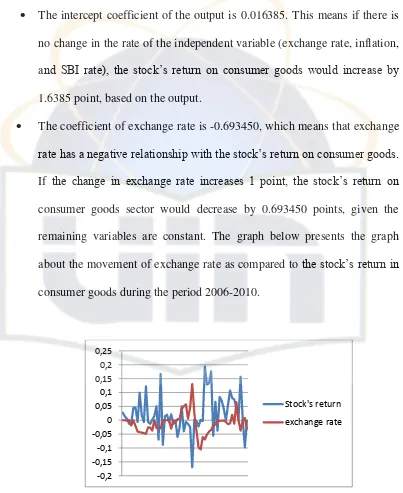
C 0.016385 0.008014 2.044428 0.0456
X1 -0.693450 0.226342 -3.063726 0.0034
X2 3.36E-05 0.001505 0.022330 0.9823
X3 -0.483347 0.223922 -2.158550 0.0352
R-squared 0.286679 Mean dependent var 0.022268
Adjusted R-squared 0.248466 S.D. dependent var 0.067858 S.E. of regression 0.058827 Akaike info criterion -2.764084 Sum squared resid 0.193796 Schwarz criterion -2.624461
Log likelihood 86.92251 F-statistic 7.502025
Durbin-Watson stat 2.016865 Prob(F-statistic) 0.000263
AUTO CORRELATION TEST
Breusch-Godfrey Serial Correlation LM Test:
F-statistic 0.150862 Probability 0.860328
White Heteroskedasticity Test:
F-statistic 1.985143 Probability 0.084204
Obs*R-squared 11.00974 Probability 0.088076
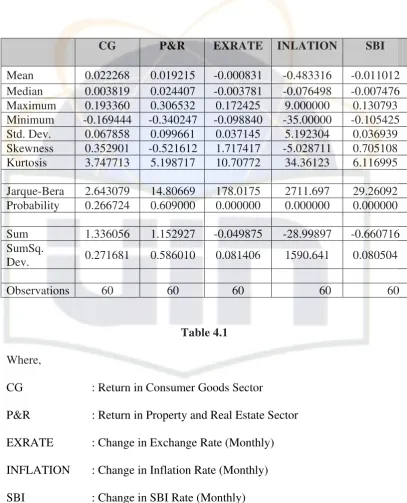
DESCRIPTIVE STATISTICS
Y C X1 X2 X3
Mean 0.022268 1.000000 -0.000831 -0.483316 -0.011012 Median 0.003819 1.000000 -0.003781 -0.076498 -0.007476 Maximum 0.193360 1.000000 0.172425 9.000000 0.130793 Minimum -0.169444 1.000000 -0.098840 -35.00000 -0.105425 Std. Dev. 0.067858 0.000000 0.037145 5.192304 0.036939
Variable Coefficient Std. Error t-Statistic Prob.
X2 0.001321 0.000863 1.530626 0.1314
X3 0.373475 0.121341 3.077900 0.0032
R-squared 0.170209 Mean dependent var -0.000831 Adjusted R-squared 0.141094 S.D. dependent var 0.037145 S.E. of regression 0.034425 Akaike info criterion -3.851354 Sum squared resid 0.067550 Schwarz criterion -3.746637 Log likelihood 118.5406 F-statistic 5.846004 Durbin-Watson stat 1.836991 Prob(F-statistic) 0.004905
Dependent Variable: X2 Method: Least Squares Date: 02/07/11 Time: 16:09 Sample: 2006M01 2010M12 Included observations: 60
Variable Coefficient Std. Error t-Statistic Prob.
C -0.601305 0.700757 -0.858079 0.3944
X1 29.87945 19.52107 1.530626 0.1314
X3 -12.97014 19.63019 -0.660724 0.5115
R-squared 0.039652 Mean dependent var -0.483316 Adjusted R-squared 0.005956 S.D. dependent var 5.192304 S.E. of regression 5.176819 Akaike info criterion 6.174965 Sum squared resid 1527.569 Schwarz criterion 6.279683 Log likelihood -182.2490 F-statistic 1.176746 Durbin-Watson stat 1.268507 Prob(F-statistic) 0.315656
Included observations: 60
Variable Coefficient Std. Error t-Statistic Prob.
C -0.010978 0.004512 -2.432994 0.0181
X1 0.381592 0.123978 3.077900 0.0032
X2 -0.000586 0.000887 -0.660724 0.5115
R-squared 0.142669 Mean dependent var -0.011012 Adjusted R-squared 0.112587 S.D. dependent var 0.036939 S.E. of regression 0.034797 Akaike info criterion -3.829852 Sum squared resid 0.069018 Schwarz criterion -3.725135
Log likelihood 117.8956 F-statistic 4.742714
Durbin-Watson stat 0.862207 Prob(F-statistic) 0.012437
EVIEWS 5 OUTPUT (Property and Real Estate Sector)
MULTIPLE REGRESSION
Dependent Variable: Y Method: Least Squares Date: 02/07/11 Time: 10:59 Sample: 2006M01 2010M12 Included observations: 60
Variable Coefficient Std. Error t-Statistic Prob.
C 0.008209 0.011062 0.742136 0.4611
X1 -1.065215 0.312405 -3.409723 0.0012
X2 -0.000461 0.002077 -0.221818 0.8253
X3 -0.898840 0.309064 -2.908261 0.0052
R-squared 0.369993 Mean dependent var 0.019215 Adjusted R-squared 0.336243 S.D. dependent var 0.099661 S.E. of regression 0.081195 Akaike info criterion -2.119578 Sum squared resid 0.369190 Schwarz criterion -1.979955
Log likelihood 67.58735 F-statistic 10.96265
Durbin-Watson stat 1.908693 Prob(F-statistic) 0.000009
AUTO CORRELATION TEST
Breusch-Godfrey Serial Correlation LM Test:
F-statistic 0.587759 Probability 0.559086
Obs*R-squared 1.278303 Probability 0.527740
Test Equation:
Date: 02/07/11 Time: 10:57
Presample missing value lagged residuals set to zero.
Variable Coefficient Std. Error t-Statistic Prob.
C 0.000104 0.011158 0.009328 0.9926
X1 0.009653 0.322981 0.029888 0.9763
X2 -0.000342 0.002124 -0.161050 0.8727
X3 0.030717 0.315445 0.097378 0.9228
RESID(-1) 0.039112 0.138929 0.281525 0.7794 RESID(-2) 0.141898 0.137328 1.033283 0.3061 R-squared 0.021305 Mean dependent var 6.94E-19 Adjusted R-squared -0.069315 S.D. dependent var 0.079104 S.E. of regression 0.081800 Akaike info criterion -2.074447 Sum squared resid 0.361324 Schwarz criterion -1.865012
Log likelihood 68.23341 F-statistic 0.235103
Durbin-Watson stat 2.037779 Prob(F-statistic) 0.945374
White Heteroskedasticity Test:
F-statistic 0.538939 Probability 0.776195
Obs*R-squared 3.450216 Probability 0.750581
MULTI-COLLINEARITY TEST Dependent Variable: X1
Method: Least Squares Date: 02/07/11 Time: 11:01 Sample: 2006M01 2010M12 Included observations: 60
C 0.003920 0.004661 0.841008 0.4039
X2 0.001321 0.000863 1.530626 0.1314
X3 0.373475 0.121341 3.077900 0.0032
R-squared 0.170209 Mean dependent var -0.000831 Adjusted R-squared 0.141094 S.D. dependent var 0.037145 S.E. of regression 0.034425 Akaike info criterion -3.851354 Sum squared resid 0.067550 Schwarz criterion -3.746637
Log likelihood 118.5406 F-statistic 5.846004
Durbin-Watson stat 1.836991 Prob(F-statistic) 0.004905
Dependent Variable: X2 Method: Least Squares Date: 02/07/11 Time: 11:02 Sample: 2006M01 2010M12 Included observations: 60
Variable Coefficient Std. Error t-Statistic Prob.
C -0.601305 0.700757 -0.858079 0.3944
X1 29.87945 19.52107 1.530626 0.1314
X3 -12.97014 19.63019 -0.660724 0.5115
R-squared 0.039652 Mean dependent var -0.483316 Adjusted R-squared 0.005956 S.D. dependent var 5.192304 S.E. of regression 5.176819 Akaike info criterion 6.174965 Sum squared resid 1527.569 Schwarz criterion 6.279683
Log likelihood -182.2490 F-statistic 1.176746
Durbin-Watson stat 1.268507 Prob(F-statistic) 0.315656
Included observations: 60
Variable Coefficient Std. Error t-Statistic Prob.
C -0.010978 0.004512 -2.432994 0.0181
X1 0.381592 0.123978 3.077900 0.0032
X2 -0.000586 0.000887 -0.660724 0.5115
R-squared 0.142669 Mean dependent var -0.011012
Adjusted R-squared 0.112587 S.D. dependent var 0.036939 S.E. of regression 0.034797 Akaike info criterion -3.829852 Sum squared resid 0.069018 Schwarz criterion -3.725135
Log likelihood 117.8956 F-statistic 4.742714
Durbin-Watson stat 0.862207 Prob(F-statistic) 0.012437
Descriptive Statistics
Y X1 X2 X3
Mean 0.019215 -0.000831 -0.483316 -0.011012
Median 0.024407 -0.003781 -0.076498 -0.007476
Maximum 0.306532 0.172425 9.000000 0.130793
Minimum -0.340247 -0.098840 -35.00000 -0.105425
Std. Dev. 0.099661 0.037145 5.192304 0.036939 Skewness -0.521612 1.717417 -5.028711 0.705108 Kurtosis 5.198717 10.70772 34.36123 6.116995
Jarque-Bera 14.80669 178.0175 2711.697 29.26092 Probability 0.000609 0.000000 0.000000 0.000000
Sum 1.152927 -0.049875 -28.99897 -0.660716
Sum Sq. Dev. 0.586010 0.081406 1590.641 0.080504
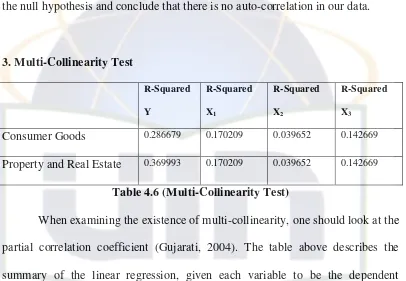
Normality Test
0 2 4 6 8 10 12 14
-0.1 -0.0 0.1 0.2
Series: Residuals
Sample 2006M01 2010M12 Observations 60
Mean 6.94e-19 Median 0.001880 Maximum 0.238803 Minimum -0.167392 Std. Dev. 0.079104 Skewness 0.363828 Kurtosis 3.382237
1
CHAPTER 1
INTRODUCTION
A. Background
Investment is the commitment of money or capital to the purchase of financial instruments or other assets so as to gain profitable returns in the form of interest, income (dividends), or appreciation (capital gains) of the value of the instrument (Sullivan,2003). It is related to saving or deferring consumption. Investment is involved in many areas of the economy, such as business management and finance no matter for households, firms, or governments.
Investment comes with the risk of the loss of the principal sum. The investment that has not been thoroughly analyzed can be highly risky with respect to the investment owner because the possibility of losing money is not within the owner's control. The fundamental principle of investment‟s risk is the more risks
possible, the higher return we receive. The level of risk, especially in Indonesian Capital Market is mainly affected by economics and political factors. Therefore, to make an investment decision, investors need to be carefully analyzing the investment‟s instrument they are most likely to choose. This analysis aims to
minimize the risk of the investment.
2
their money; systematic and unsystematic risk. Interest rates, recession and wars all represent sources of systematic risk because they affect the entire market and cannot be avoided through diversification. While unsystematic risk is company or industry specific risk that is inherent in each investment. Systematic risk can be mitigated only by being hedged, while unsystematic risk can be reduced through appropriate diversification.
Analyses of the financial markets are broadly divided between two schools of thought; fundamental and technical analysis (Graham, et al: 1999). Fundamental analysis is a method of evaluating the intrinsic value of a company, and hence the share price, by researching and examining the corporate financial statements, the business itself, industry outlook and so on. Conventional wisdom dictates that the price of a stock that is trading for less than its intrinsic value should rise and the price of a stock that is trading for higher than its intrinsic value should fall (Chong, 2006). On the other hand, Technical analysis is a method of evaluating future price of a stock based on statistical analysis of past behaviors of the stock. Behaviors of stock include trading volume, moving averages, price trends and other types of charts. Technical analysis assumes that the price chart frequently anticipates news and other fundamental events before they become public knowledge. It is used by market analysts to identify the beginning of an uptrend, entry point, beginning of a downtrend and the exit point.
3
investor prefers investing in the form of deposit rather than in stock market. Inflation also rose and thus makes the exchange rate of Indonesian Rupiah to US dollar dropped. On the article publish by daily news agency Reuters1, this condition is likely to be happened again in 2008. This crisis is the effect resulted from subprime mortgage case in US in 2007. The immediate cause or trigger of the crisis was the Fed policy to decrease the interest rate which peaked in approximately 2005–2006 (Lahart, 2007). Already-rising default rates on "subprime" and adjustable rate mortgages (ARM) began to increase quickly thereafter. As banks began to increasingly give out more loans to potential home owners, the housing price also began to rise. In the optimistic terms the banks would encourage the home owners to take on considerably high loans in the belief they would be able to pay it back more quickly overlooking the interest rates. Once the interest rates began to rise in mid 2007 the housing price started to drop significantly in 2006 leading into 2007. In many states like California refinancing became more difficult. As a result the number of foreclosed homes began to rise as well.
The Global Financial Crisis brings a negative impact of other countries, and Indonesia is one that is affected also. Based on the report publish by Bank Indonesia, during this crisis, the exchange rates of Indonesian Rupiah to US dollar
1 Three top economists agree 2009 worst financial crisis since great depression;
4
decline significantly to Rp 12,000/ US$. On October 9-10 2008, many stocks in Jakarta Stock Exchange are being suspended because of market‟s overreaction. It
seems like the Financial Global Crisis will harm the economic conditions of a country, as well as its stock market.
The unstable macroeconomic conditions could affect the stock price in a stock market. According to Bodi, Kane, and Marcus (2007 P.226) in their books “Investment” the macroeconomic factors that affect the stock price are; interest
rate, inflation, and exchange rate. The stock price that is influenced by the cyclical factors such as stock on property and real estate industries will be affected more than the stock price on the other industries that is not influenced by cyclical factors, such as consumption goods industries.
5
makes the performance of the property and real estate sector declining. Fundamentally, the decreasing performance of a company will lead to the decreasing of its stock price in the stock market.
Inflation, as an unpredictable macroeconomic indicator also influences the performance of the stock in the market. Inflation is the raise of overall goods and services in an economy over period of time (Mankiw, 2007). The raise of overall goods and services will create the declining demand of secondary and tertiary product, such as property and real estate, because the people will try to fulfill their basic needs first. This makes the stock price on property and real estate sector will be more affected than the stock price on consumption goods, theoretically.
The exchange rate of Indonesian Rupiah to US Dollar depreciated when the crisis occurred. This condition caused a huge damage to major industries in Indonesia, especially for those who finance their company by borrowing fund from foreign country. They have to pay more for their debt and this will make the performance of their company weaken and thus make their stock prices decrease. Exchange rate also influences the foreign investor‟s decision to invest their money in
Indonesian stock market. Foreign investors are allowed to invest their money in certain limitation. When the exchange rates change, foreign investor must rethink their decision to invest carefully and this will influence the stock price as a whole.
6
stock which less influenced by cyclical factors. This research aims to help investor to make the best decision regarding the choice of stocks when the economic condition is unstable.
B. Problem Formulation
A country‟s capital market plays a significant role in determining the
growth of that particular country. There are many research conducted in various countries, using various types of data to prove that theory, which later will be explored on the next part of this research. But so far the result of this study is still inconclusive. Every market is different and dynamic and that makes some researches resulted in the opposite way of theory. The choice of method analysis also influences the result of the research. Therefore, the writer desires to prove the negative effect of macroeconomic factors, such as interest rate, inflation, and exchange rate to the stock return in Indonesia‟s capital market.
This research chooses the property and real estate sector and consumer goods sector as the object of research. The reason behind this choice is because both sectors differ in terms of the level of cyclical factors‟ influence. Consumer goods
7
Based on the consideration above, this research aims to answer these following questions:
1. How the interest rate, inflation, and exchange rate are influences the performance of a stock on consumption goods and property and real estate sector in Indonesia stock exchange?
2. How much the influence of interest rate, inflation, and exchange rate affected the performance of stock on consumption goods and property and real estate sector in Indonesia stock exchange?
C. Research Objectives
The objectives of this research are:
1. To identify the influence of interest rate, inflation, and exchange rate to the performance of stock on consumption goods sector and property and real estate sector in Indonesia stock exchange.
2. To determine the extent to which interest rate, inflation and exchange rate influence the performance of stock on consumption goods sector and property and real estate sector in Indonesia stock exchange.
D. Usefullness of the Research
In general, this research is expected to provide the significant contribution to
8 perfect time to invest in the capital market given a current macroeconomic
circumstances. This eventually will help investor in obtaining their investments‟ risks
manageable, which eventually will help in the improvement of the social economics
circumstances. Specifically, the benefits of research is diveded into three scope of
areas, which are:
1. For the Author
As for the author, this research is expected to enrich the author‟s knowledge about investment in capital market, as well as macroeconomic knowledges. This reserach is also expected to become a medium to implement lessons learned during the author‟s study in the university. 2. For the Investor
As for the investor, this research attempts to help investor in increasing their knowledge about macroeconomic condition before they choose to invest in the capital market. By examining the condition, investors could forecast their return in capital market. Thus, this is expected to help investor minimize the risk of their investmrnt.
3. For academic purposes
9
CHAPTER 2
LITERATURE REVIEW
A. Fundamental of Capital Market
1. History of Indonesian Capital Market
The capital market in Indonesia has actually existed long before the Independence of Indonesia. The first stock exchange in Indonesia was established on 1912 in Batavia during the Dutch colonial era. At that time, the exchange was established for the interest of the Dutch East Indies (VOC).
During that era, the capital market grew gradually, and even became inactive for a period of time due to various conditions, such as the World War I and II, power transition from the Dutch government to Indonesian government, etc.
Indonesian government reactivated its capital market in 1977, and it grew rapidly ever since, along with the support of incentives and regulations issued by the government.
The milestone of Indonesian capital market occurred in 2007, where Surabaya Stock Exchange merged with Jakarta Stock Exchange and thus change the name to become Indonesia Stock Exchange (IDX). This merger is expected to boost the performance of Indonesian capital market in the future2.
2
10
2. Capital Market Definition
The Capital Market is a market for several long-term investment instruments which can be traded, whether in the form of debt or self-own capital (equity) (Darmadji and Hendy, 2001). Capital market enables corporations to issue the security in the form of certificate of indebtedness (bond) or the certificate of ownership (stock). Through the existence of capital market, this would be possible for the parties who has surplus of fund (lender) to move their fund to another parties who are deficit in fund (borrower). The parties who have the surplus of fund can invest their money to the parties who are deficit with the expectation to get the return, while the issuer (in this case the corporate) can utilize the fund for its interest to make its business growth without depending on the operational activity of the corporate.
Capital market has many advantages which can be categorized as economic advantage and financial advantage. On the economic side, capital market is expected to boost economic activity because capital market is becoming a funding alternative for the corporations so that the corporations can operate in the higher scale which eventually can increase its revenue and prosperity of the society. While in the financial side, capital market is expected to become the source of financing (long term) for the corporations and enable investor to diversify its investment.
3. Capital Market Instrument
11
Indonesia Stock Exchange (IDX) are classified into three types; stocks, bonds, and rights3.
a) Stock
The capital stock of a business entity represents the original capital paid into or invested in the business by its founders. Stock typically takes the form of shares of either common stock or preferred stock. As a unit of ownership, common stock typically carries voting rights that can be exercised in corporate decisions. They include the right to receive dividend payments typically from earnings, if authorized by the board of directors and the power to sell the stock (liquidity rights) and realize capital gains on public trading markets or in private transactions. On the other hand, preferred stock differs from common stock in that it typically does not carry voting rights but is legally entitled to receive a certain level of dividend payments before any dividends can be issued to other shareholders.
b) Rights
Rights are the right given to the old shareholder to buy new additional shares issued by a particular company.
3
12
c) Bond
Bond is a debt security, in which the authorized issuer owes the holders a debt and, depending on the terms of the bonds, is obliged to pay interest (the coupon) and/or repay the principal at later date, termed maturity. A bond is a formal contract to repay borrowed money with interest at fixed intervals.
B. Investment
Investment is putting money into something with the hope of profit. More specifically, investment is the commitment of money or capital to the purchase of financial instruments or other assets so as to gain profitable returns in the form of interest, income (dividends), or capital gain appreciation of the value of the instrument (Sullivan, 2003). It is related to saving or deferring consumption. Investment is involved in many areas of the economy, such as business management and finance no matter for households, firms, or governments. An investment involves the choice by an individual or an organization, such as a pension fund, after some analysis or thought, to place or lend money in a vehicle, instrument or asset, such as property, commodity, stock, bond, financial derivatives (e.g. futures or options), or the foreign asset denominated in foreign currency, that has certain level of risk and provides the possibility of generating returns over a period of time (Graham et al., 1991).
13
investor. There are many factors that make investment‟s return somehow
unpredictable. Because of these factors, investor needs to make a comprehensive analysis before they make an investment decision to minimize the risks. The analysis could be a fundamental analysis or technical analysis.
Generally, there are two different styles and types of investors that exist in the stock market; investors use the stock market to build their investment portfolio so that they can see a long term profit that takes place over a long period of time, and investor who just using the stock market to make money quickly for a short period of time, which is called a "trader". The first type of investor has a short term orientation while the second type has a long term orientation.
Investor in capital market must analyze the factors that could influence the change of stock price. Stock prices definitely change over the course of time. Some can increase rapidly and make investors a fortune, whereas others can lose a lot of value quickly and bankrupt investors. Stock prices change because of the economics of market forces, and the supply and demand for the stock (Coleman, 2006). This is all based on personal perception. If people think that a company will do better in the future, this will raise the demand and price of the stock, and if they think a company will do worse, this will lower the demand and price of the stock.
14
most influencing factors of stock prices (Bodie, 2007). News or information also affects the change in stock price. Positive news about a company can increase buying interest in the market while a negative press release can ruin the prospect of a stock. Nevertheless, investor could not only rely on the news when attempting to predict stock price. It is the overall performance of the company that matters more than news. It is always wise to take a wait and watch policy in a volatile market or when there is mixed reaction about a particular stock.
In capital market, there is term named „market efficiency concept‟ which
mentions the degree to which stock prices reflect all available and relevant information. In 1900, Louis Bachelier made an important contribution to the formalism of classical economics with a theory that says trading strategies based only on observed price changes cannot succeed. Markets are moved by news and since, by definition, news cannot be predicted (or it would not be news), price movement cannot be anticipated. Consequently, price data are not linked and price series follow a geometric Brownian random walk, whereby market prices are log-normal distributed, i.e. the differences of the logarithms of prices are Gaussian distributed.
There are three categories of market efficiency concept (Elton, et al: 2007)
15
2. Semi-Strong Form Efficiency: In this form of market efficiency, no investor can earn excess returns from using trading rules based on any publicly available information.
3. Strong Form Efficiency: In this form of efficiency, no investor can earn excess returns using any information whether publicly available or not. As every casual follower of financial news knows, stock prices rise and fall in response to earnings and revenues (Yee, 2001). Positive information regarding expected Earnings per Share (EPS) will boost the stock price and vice versa.
C. Stock Rate of Return
Capital Market Theory explains the behavior of investor in making an investment decision. Investor will consider two most important factors when making an investment decision; risk and return. A stock‟s rate of return is gained from the dividend paid annually or capital gain or margin from the purchase-sell activity.
Chris Brooks (2002 p.154) in his book, Introductory of Econometrics for Finance explain two methods in calculating return gained from capital gain margin; simple return and continuously compounded returns. The formula of each method is as follows:
Simple returns:
�
16
Continuously compounded return
(2.2)
Where,
Rt = Simple returns on t period
rt = Continuously compoundedreturns on t period Pt = Stock Price on t period
Pt-1 = Stock Price on t-1 period
Investor will make an investment decision to buy a particular stock if a stock‟s
rate of return forecasted to be increased in the future. In this condition, investor will gained more return than they‟re required rate of return. When a stock‟s return
is predicted to up, it will increase the demand from investor to that particular stock and automatically increase the stock price. On the other hand, when a stock‟s
return is predicted to decrease, it will also decrease the demand from investor to that particular stock and resulted in the decrease of stock price as well. Investor will tend to sell the stocks which not meet their required rate of return. Here we can see a linear correlation between a stock‟s rate of return and stock‟s price.
D. Risks
Despite considering a stock‟s return, investor who wishes to invest their
17
present problems that must be immediately addressed (Hubbard, 2009). While others said that risk is the uncertainty about rate of return in the future (Bodie et al: 2007). Risks that faced by investors are strongly related to the fluctuation of stock price. According to Yan Yee Chong (2006, p. 75) in his books Investment Risk Management, risks are classified into several types:
a. Business Risk
Business risk is the potential for loss of value through competition, mismanagement, and financial insolvency. There are a number of industries that are predisposed to higher levels of business risk (airlines, railroads, steel, etc).
b. Credit and Country Risk
Credit risk is the risk that firm unable to deal with its obligations, and therefore the asset will become unprofitable. Country risk refers to the risk that a country will change the rules under which its financial system operates in some way that affects that country‟s native financial instrument
and assets; country risk is also known as political risk. c. Interest
The raise of interest rate will decrease the demand of stocks investment because people will prefer to invest in the form of deposits. This resulted in the decreasing of stock price.
d. Market Risk
18
are likely to fluctuate greatly in stock price, whereas assets with low volatility are more immune to fast, large price changes. Volatility is important in the stock world for a variety of reasons. The more volatile a stock, the more potential for profit there may exist (which is why some investors focus on identifying growth stocks, which have the capability for explosive growth), but at the same time, there is also the possibility of dramatic loss. The less volatile the investment, the less on average the return will be to that investment.
e. Liquidity Risk
The final type of risk associated with stock market transactions is liquidity risk. Liquidity risk refers to risk that the stock will not be able to be traded fast enough to avoid or loss or capitalize on a potential profit. Liquidity risk can be avoided by making sure the daily volume of share trading is above a certain level.
Generally, risk is calculated by the deviation of the actual return from the required rate of return (expected return) as a result of success/failure of an investment. Risk of a stock can be measured by its variance or standard deviation. With the risk of uncertainty, investors not only need to calculate the return of a stock but also the risks associated with it.
19
industry specific risk that is inherent in each investment. Systematic risk can be mitigated only by being hedged, while the amount of unsystematic risk can be reduced through appropriate diversification.
E. Inflation
In economics, inflation is a rise in the general level of prices of goods and services in an economy over a period of time (Blanchard, 2000). The rise of general prices of goods and services does not merely caused inflation if it is only happen in a moment of time. Therefore, inflation is at least measured by monthly basis. If in one month the rise of general price of goods and services are continuously, a country can be claimed to have an increase in inflation rate. Inflation rate is the percentage change in the price index from the preceding period (Mankiw, 2007). Another longer period to measure inflation is by yearly, or quarter-yearly basis. Still According to Mankiw in his books, Theory of Macroeconomic, there are several macroeconomic indicators that can be used to measure an inflation rate within a period;
a. Consumer Price Index (CPI)
The consumer price index is a measure of the overall costs of the goods and services brought by a typical consumer. Inflation rate can be measured by applying the following formula:
� � � �
20
If consumer price index measure inflation rate from the perspective of the consumers, wholesale price index measure inflation rate from the perspective of the producers. Wholesale price index measures the cost of a basket of goods and services. Inflation rate can be measured by applying the following formula:
�
(2.4)
c. GDP Deflator
21
� � � �
(2.5) Theoretically, inflation has a negative relationship with the stock return. This phenomenon is caused by:
a. Cost-push inflation
When the cost of production increases, a company‟s ability to fulfill the
demand from the customer is decrease. This will cause an aggregate supply. Aggregate supply is the total volume of goods and services produced by an economy at a given price level. When there is a decrease in the aggregate supply of goods and services stemming from an increase in the cost of production, cost-push inflation occurred. Cost-push inflation basically means that prices have been “pushed up” by increases in costs of
any of the four factors of production (labor, capital, land or entrepreneurship) when companies are already running at full production capacity. With higher production costs and productivity maximized, companies cannot maintain profit margins by producing the same amounts of goods and services. As a result, the increased costs are passed on to consumers, causing a rise in the general price level (inflation).
b. Demand-pull inflation
22
sectors concurrently want to purchase more output than the economy can produce, they compete to purchase limited amounts of goods and services.
1. Relationship between inflation and stock return
Inflation influences the purchasing power of the individuals in some extend. Brealey and Meyer (2000) exposes that inflation has a negative inlfluences to the stock performance in capital market. When inflation rate increase, the price of overall goods and services increase as well. Thus will make individuals loose their ability to invest in capital market. They prefer to fulfill their basic needs first before making an investment. The capital matket will suffer because of this condition. The price of overall stocks in the capital market will decrease and thus make the return of the stock decrease as well.
F. Interest Rate
23
rate minus the inflation rate. It is the rate of interest an investor expects to receive after subtracting inflation.
The relationship between real and nominal interest rates can be described in the equation (Brealey and Meyer, 2000)
�
(2.6)
Where r is the real interest rate, i is the inflation rate, and R is the nominal interest rate.
1. Relationship between interest rate and stock return
Interest rate are important variables in for macroeconomic to understand because they link the economy of the present and the economy of the future through their effects on saving and investment (Mankiw, 2007 p.369). Keynes reanalyzed about the effect of interest rate on investment decision. The increase of interest rate could increase the exchange rate, but this can make the price of stock decrease. Keynes also stated the negative relationship between interest rate and stock price. This happen because if the interest rate increases, people tend to invest their money in the form of deposit, and thus make investment in capital market weakened.
24
interest rate increase, the cost of investment will increase and thus make company‟s profit decrease. A decrease in profit will make a dividend for the
stockholder decrease too, which affected the stock price to be decreasing as well.
2. SBI (Bank Indonesia Certificate) Rate
In the past two centuries, interest rates have been variously set either by national governments or central banks. In Indonesia, the interest rate is set by the Central Bank of Indonesia, namely BI rate. The SBI Rate is announced by the Board of Governors of Bank Indonesia in each monthly Board of Governors Meeting. It is implemented in the Bank Indonesia monetary operations conducted by means of liquidity management on the money market through SBI Rate to achieve the monetary policy operational target.
The monetary policy operational target is reflected in movement in the Interbank Overnight (O/N) Rate. It is then expected that bank deposit rates will track the movement in interbank rates, with bank lending rates following suit.
While other factors in the economy are also taken into account, Bank Indonesia will normally raise the BI Rate if future inflation is forecasted ahead of the established inflation target. Conversely, Bank Indonesia will lower the BI Rate if future inflation is predicted below the inflation target.
25
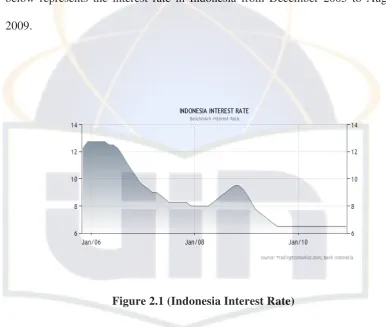
central banks lend or discount eligible paper for deposit money banks, typically shown on an end-of-period basis. From 2005 until 2010, Indonesia's average interest rate was 8.76 percent reaching an historical high of 12.75 percent in December of 2005 and a record low of 6.50 percent in August of 2009. The graph below represents the interest rate in Indonesia from December 2005 to August 2009.
Figure 2.1 (Indonesia Interest Rate)
G. Exchange Rate
According to Jeff Madura (2007, p.78), exchange rate between two countries specifies how much one currency is worth in terms of the other. It is the value of a foreign nation‟s currency in terms of the home nation‟s currency.
26
since a decrease in stock prices reduces domestic wealth, which leads to lower domestic money demand and interest rates (Aydemir and Demirhan, 2009). Also, the decrease in domestic stock prices leads foreign investors to lower demand for domestic assets and domestic currency. These shifts in demand and supply of currencies cause capital outflows and the depreciation of domestic currency. On the other hand, when stock prices rise, foreign investors become willing to invest in a country‟s equity securities. Thus, they will get benefit from international
diversification. This situation will lead to capital inflows and a currency appreciation (Granger et al. 2000;Pan et al. 2007).
Exchange rates can affect stock prices not only for multinational and export oriented firms but also for domestic firms. For a multinational company, changes in exchange rates will result in both an immediate change in value of its foreign operations and a continuing change in the profitability of its foreign operations reflected in successive income statements. Therefore, the changes in economic value of firm‟s foreign operations may influence stock prices. Domestic firms can
also be influenced by changes in exchange rates since they may import a part of their inputs and export their outputs. For example, a devaluation of its currency makes imported inputs more expensive and exported outputs cheaper for a firm. Thus, devaluation will make positive effect for export firms (Aggarwal, 1981) and increase the income of these firms, consequently, boosting the average level of stock prices (Wu, 2000).
27
Stock return will get effected by the fluctuation of exchange rate in a country (Wu, 2000). When the exchange rate fluctuates, foreign investor will get atrratcted to invest their money in capital market. Thus will make the price of stock corrected.
H. Previous Research
In 2004, Maysami, et al. made a research about relationship between selected macroeconomic variables and the Singapore Stock Market Index (STI), as well as with various Singapore Exchange Sector Indices-the finance index, the property index, and the hotel index. This research used VCEM model proposed by Johansen(1990) which allows for testing cointegration in a whole system of equations in one stop, without requiring a specific variable to be normalized. The research‟s data is the monthly time-series which is obtained from the
PublicAccess Time-Series system, an online service by the Singapore Department of Statistics. And the SES All-S Equities indicies figures are obtained from the Singapore Statistics published by the Singapore Department of Statistics. The study concludes that the Singapore‟s stock market and the property index form
cointegrating relationship with changes in the short and long-term interest rates, industrial production, price levels, exchange rate and money supply (macroeconomics variables).
28
moving-averages at the one-month MA(1), three-month MA(3), six-month MA(6), and twelve-month MA(12) for the lagged dependent of stock market price and the two intervening variables of exchange rate and oil price. Available monthly data for stock market price index, exchange rate, and oil price between 1999:03 to 2006:06 for Brazil, Russia, India, and China from the Organization for Economic Cooperation and Development (OECD) is used in this study, which will provide 90 observations per variable for each BRIC for a total of 1,080 observations. This study concludes that no significant relationship was found between respective exchange rate and oil price (Macroeconomic variables) on the stock market index prices of either BRIC country, this may be due to the influence other domestic and international macroeconomic factors on stock market returns, warranting further research. Also, there was no significant relationship found between present and past stock market returns, suggesting the markets of Brazil, Russia, India, and China exhibit the weak-form of market efficiency.
29
Australia. As for short run relationship, all countries except for Hong Kong and Thailand show some interactions. The Hong Kong shows relationship only between exchange rate and stock price while the Thailand reports significant interaction only between output and stock prices. An accurate estimation of these relationships enables investors to make effective investment decisions. At the same time, it helps policy makers in designing policies to encourage more capital inflows into the respective countries‟ capital market.
Pakistani scholar, Ahmad et al. (2010) performed a study that examines the relationship between stock return, interest rate and exchange rates in Pakistani economy. For this, the data of short term interest rate, exchange rate (Rs/US $) and stock market returns (KSE-100) over the period of 1998-2009 is collected. A multiple regression model is applied to test the significance of change in interest rate and exchange on stock returns. The results show that both the change in interest rate and change in exchange rate has a significant impact on stock returns over the sample period.
30
portfolio construction, four criteria are used: market equity, the book-to-market equity, the earnings-to-price equity and the leverage ratio. A multiple regression model is designed to test the relationship between the stock portfolio returns and seven macroeconomic factors. Empirical findings reveal that exchange rate, interest rate and world market return seem to affect all of the portfolio returns, while inflation rate is significant for only three of the twelve portfolios. On the other hand, industrial production, money supply and oil prices do not appear to have any significant affect on stock returns.
31
Another research conducted by Softameiono (2007) proposed there is relationship between macroeconomics variable; inflation, interest rate, and exchange rate, and stock return in banking sector. The data is gathered from Jakarta Stock Exchange which are the stock returns in Banking sector listed in two effects from January 2002 to February 2004. The method used to analyze the data is regression of panel data with random effect. Besides, the T test, F test, and Determination test is also employed. The result is macroeconomic variables (interest rate, inflation and exchange rate) give significance influence to the stocks return in Indonesia Stock Exchange. The most significant variable is exchange rate.
I. Research Framework and Hypotheses
a. Inflation and Stock’s Return
Theoretically, inflation and a stock‟s rate of return have a negative relationship. If
an inflation rate increased, a stock‟s rate of return will decrease and vice versa.
Based on the theories and previous studies, we formulate hypothesis as follow:
H0 : There is no relationship between inflation rate and stock‟s rate of return
H1: There is a negative relationship between inflation rate and stock‟s rate
b. Interest Rate and Stock’s Return
32
vice versa. Based on the theories and previous studies, we formulate hypothesis as follow:
H0 : There is no relationship between interest rate and stock‟s rate of return.
H1 : There is a negative relationship between interest rate and stock‟s rate of return.
c. Exchange Rate and Stock’s Return
Theoretically, exchange rate and a stock‟s rate of return have a negative
relationship. If an exchange rate increased, a stock‟s rate of return will decrease and vice versa. Based on the theories and previous studies, we formulate hypothesis as follow:
H0 : There is no relationship between exchange rate and stock‟s rate of return.
H1 : There is a negative relationship between exchange rate and stock‟s rate of return.
Based on the previous study, there is no fixed explanation about what macroeconomic factors that influence the stock‟s rate of return. Therefore, this
33
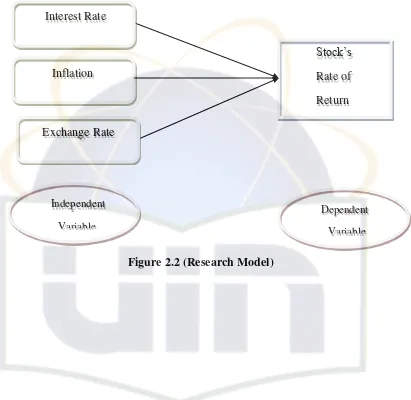
Figure 2.2 (Research Model) Interest Rate
Stock‟s
Rate of Return Inflation
Exchange Rate
Dependent
Variable Independent
34
CHAPTER 3
RESEARCH METHODOLOGY
A. Data Collection
1. Unit of Analysis and Research Sampling
The unit of analysis refers to the level of aggregation of the data collected during the subsequent data analysis stage (Cooper et al., 2006). This research focusing on the influence of selected macroeconomic variables on stock‟s rate of
return. The unit of analysis for this study is the market sector indices listed in Indonesia Stock Exchange (IDX). The market sector indices in Indonesia Stock Exchange (IDX) is divided into 10 sectors; mining, agricultural, consumer goods, miscellaneous industry, manufacturing, infrastructure and transportation, finance, trade investment and services, chemical basic industry and property and real estate
35
2. Types of Data
This research uses a secondary type of data, which is obtained from certain sources. The independent variable data, which are inflation rate and exchange rate of Indonesian Rupiah to US Dollar is obtained from Indonesia‟s Economic
and Financial Statistic published by Bank of Indonesia while the data of inflation rate is gathered from National Statistical Bureau (BPS).
B. Research Models
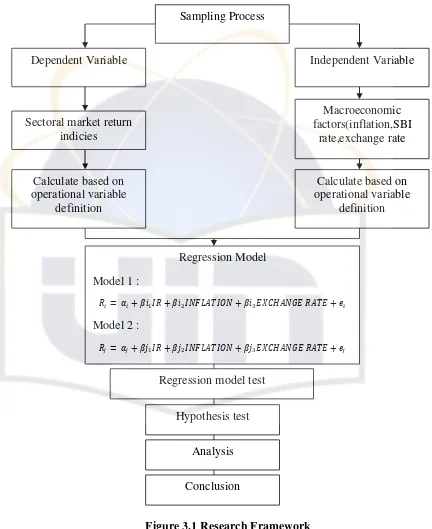
This research uses multiple linear regression models as follow: Model 1
� � ��� �� � ��� �
(3.1) Model 2
� � ��� �� � ��� �
(3.2) where,
Ri = Stock return of property and real estate sector Rj = Stock return of consumer goods sector
α = Intercept
β = Regression coefficient
IR = the Indonesia Interest Rate (SBI) change
36
EXCHANGE RATE = the change in exchange rate of Indonesian Rupiah to US Dollar
C. Operational Variable
Operational variable is a statement of the specific dimensions and elements through which a concept will become measurable (Sekaran, 2006).There are two kinds of variable, which are independent variable and dependent variable, which we turn into certain dimension and definition.
The operational definition of each variable is as follow:
1. Stock’s Rate of Return
In calculating a stock‟s rate of return, the writer uses continuous
compounding method as follow:
[ ]
(3.3) Where,
rt = Continuously compoundedreturns on t period Pt = Stock Price on t period
Pt-1 = Stock Price on t-1 period
From the formula above, we can see that a stock‟s rate of return can be
37
2. Inflation Rate
The inflation rate data used in this research calculated from change in monthly inflation rate based on Consumer Price Index (CPI). Inflation per month can be calculated as follows:
� � � �
(3.4)
After we calculate the monthly inflation rate, then to measure the change in inflation rate we can use this following formula:
���
(3.5)
Where,
INFLATIONt = Change in inflation rate during t period INFt = Inflation on t period
INFt-1 = Inflation on t-1 period
3. Exchange Rate
38
���� � � �
(3.6)
Where,
EXRATEt = Change in exchange rate of Indonesian Rupiah to US Dollar in a t period
ERt = Exchange rate of Indonesian Rupiah to US Dollar in t period
ERt-1 = Exchange rate of Indonesian Rupiah to US Dollar in t-1 period
This data is gained from the exchange rate of Indonesian Rupiah to US Dollar in monthly basis during December 2005-December 2010 published by Bank of Indonesia.
4. Interest Rate
In this research, interest rate refers to Bank Indonesia Certificate (SBI) Rate on monthly basis. The operational definition used in this research is the change in SBI rate. Change in Indonesia Interest Rate is defined as follows:
��� � � �
(3.7)
Where,
39
IRt = Interest rate (SBI rate) on t period IRt-1 = Interest rate (SBI rate) on t-1 period
D. Data Analysis Technique
Regression analysis will be used to test hypotheses formulated for this study. Three variables (inflation, interest rate, and exchange rate) were entered. Multiple regressions will determine the significant relationship between dependent and independent variables, the direction of the relationship, the degree of the relationship and strength of the relationship (Sekaran, 2006). Multiple regression are most sophisticated extension of correlation and are used to explore the predict ability of a set of independent variables on dependent variable (Pallant, 2001). Three hypotheses generated. From the hypothesis it gives direction to assess the statistical relationship between the dependent and independent variables. The convention of P value has been set as of 5% i.e. 0.05 used as evidence of a statistical association between the dependent and independent variables.
To gather the best model of research, researcher must perform other pre-tests. The test are: normality test, assumption test (heteroscedasticity test, auto-correlation test, multi-collinearity test), and hypothesis test.
1. Normality Test
40
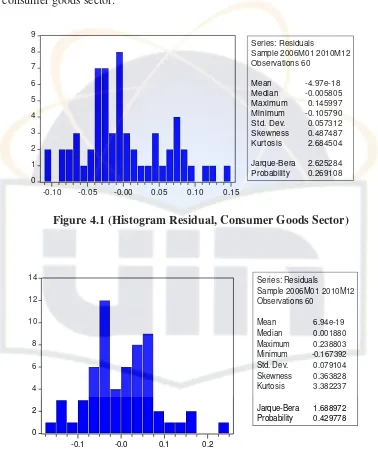
underlying random variable is to be normally distributed. An informal approach to testing normality is to compare a histogram of the residuals to a normal probability curve. The actual distribution of the residuals (the histogram) should be bell-shaped and resemble the normal distribution.
There are certain methods to detect whether data is normally distributed or not. The methods are using Histogram of Residual, Normal Probability Plot, and Jarque-Bera Test. In this research, researchers want to use a method proposed by Jarque Bera or commonly known as Jarque Bera Test to gather the most accurate model of data.
a. Jarque-Bera Test of Normality
The JB test of normality is an asymptotic, or large-sample, test. It is also based on the OLS residuals (Gujarati, 2004). This test first computes the skewness and kurtosis measures of the OLS residuals and uses the following test statistic:
[ ]
(3.8) Where,
n = sample size
S = skewness coefficient K = kurtosis coefficient
41
Regarding this, the hypothesis of Jarque-Bera Test is described as follows: H0 : Data is not normally distributed
Ha : Data is normally distributed
To detect whether the variable is normally distributed or not, one can compare the value of Jarque Bera statistic with the value of Jarque Bera table (X2)., as follows:
a. If JB Statistic > X2, the data is not normally distributed, and thus we do not reject H0.
b. If JB Statistic < X2 , the data is normally distributed, and thus we reject H0.
2. Classical Assumption Test
The Gaussian, standard, or classical linear regression model (CLRM), which is the cornerstone of most econometric theory, makes 10 assumptions underlying of Ordinary Least Square method (Gujarati, 2004, p.65). This research will focus on its 6 basic assumption in context of the two-variable regression model.
Assumption 1 : Linear Regression Model. The regression model is linear in the parameters
Assumption 2 : X values (The independent variable) are fixed in repeated sampling. Values taken by the regressor X are considered fixed in repeated samples. More technically, X is assumed to be nonstochastic.
Assumption3 : Zero mean value of disturbance ui. Given the value of X, the
42
zero. Technically, the conditional mean value of ui is zero. Symbolically, we have
|�
(3.9) Assumption 4 : Homoscedasticity or equal variance of ui. Given the value of X, the variance of ui is the same for all observations. That is, the conditional variances of ui are identical. Symbolically, we have
|�
(3.10) Assumption 5 : No autocorrelation between the disturbances. Given any
two X values, Xiand Xj(i≠ j), the correlation between any two uiand uj(i≠j) is zero. Symbolically, we have
� ( |� �)
(3.11) Assumption 6 : Zero covariance between ui and Xi, or E(uiXi) = 0. By
Assumption,
� ( �)
43
As noted earlier, given the assumptions of the classical linear regression model, the least-squares estimates possess some ideal or optimum properties. These properties are contained in the well-known Gauss–Markov theorem. To understand this theorem, we need to consider the best linear unbiasedness property of an estimator. The OLS estimator is said to be a best linear unbiased estimator (BLUE) if the following hold (Brooks, 2002):
1. It is linear, that is, a linear function of a random variable, such as the dependent variable Y in the regression model.
2. It is unbiased, that is, its average or expected value, E(β2), is equal to the true value, β2.
3. It has minimum variance in the class of all such linear unbiased estimators; an unbiased estimator with the least variance is known as an efficient estimator.
The classical assumption test needed to ensure that the regression model is the best estimator or BLUE. The classical assumption test also used to detect any mislead of the classical linear model. The test used are Heteroscedastic Test, Auto-Correlation Test, and Multi-Colinearity Test.
a. Heteroscedastic Test