Nutritional Properties of Cocoa Pods as Ruminant Feedstuff
Despal1 and H. Abel2
Dept. Animal Nutrition & Feed Technology, Faculty of Animal Science, Bogor Agriculture. Jl. Agatis Kampus IPB Darmaga, 16680 Bogor. Email: [email protected]
2) Institute for Animal Nutrition and Physiology, Faculty of Agriculture, Georg-August University, Goettingen- Germany
Abstract
An attempt to increase cocoa pods quality feed for ruminant have been done using fermentation techniques with or without urea addition. Five treatments (Fresh cocoa pod = C; fermentation with addition urea 0 g/kg = U0 or ensilage; 10 g/kg = U1; 20 g/kg = U2 and 30 g/kg fresh substances of cocoa pods) have been examined for their effect on pH, proximate composition, N-fractions, amino acid compositions, cell wall constituents, anti nutritive compounds, in vitro gas production (Gb), estimate organic matter digestibility (OMD) and metabolizable energy (ME) of cocoa pods. Ensilage (U0) improve feed values of cocoa pods by weakening the lingo-cellulose or –hemicellulose bonds, resulting in higher in vitro gas production as well as higher OMD and ME contents compare to fresh cocoa pods. The protein value of cocoa pods, expressed as true protein (TP) or non ammonia nitrogen (NAN) minus urea nitrogen (UR) was also improved. Addition of urea affected the composition of the fibre fraction as to the proportion of NDF, ADF and ADL and the content of TP was slightly increased. Urea treatment increased Gb, OMD and ME compared to ensiled or fresh cocoa pods. The optimum level of urea for maximum Gb was 6.7 g/100 g DM cocoa pods. The optimum level to reach maximum OMD and ME were also reached at urea level 6.5 – 6.7 g/100 g DM cocoa pods.
Keywords: cocoa pod, ensilage, feed quality, ruminant, urea
Backgrounds
per person per year in 1964-66, to 45 kg now, and could rise to 66 kg in 2030. Although Indonesia currently are among the least milk consumer (7 liter/capita/year), almost 75% of the milk consumed are still imported. Meat productions are slightly better than milk production figure. About 72% of the demand could be supplied by domestic production although their sustainability is still a question mark. It is hard to imagine how milk and meat domestic production could fulfill the increasing demand in 2030 if FAO projection is become reality.
In the past five years, cattle population for meat and milk production remained at the same numbers. There are several problems in increasing ruminant population in Indonesia including feeding, breeding, disease and socio-economic problems. Feeding problem such as lack of good quality feed resources and suboptimum of byproduct utilizations are among the problems that have been noticed for long time period but still lack of action to solve them. Naturally, Indonesian grass like almost all tropical grasses has very low quality in compare to temperate grass. It contained 8 – 12% crude protein and high fibre component in contrast to temperate grasses which have prime to 1st grade grasses quality (17 – 20% CP and low fibre component). The low quality of grasses are not the only problem in providing nutrition for ruminant in Indonesia, their availability are also highly depended on season and very few planning on their conservation have been made. In dry season, farmers are frequently forced to use low quality but available by product such as cocoa pods, rice straw, palm press fibre, sugarcane-bagasse which could only provide limited nutrient for animal.
Cocoa pods are among the prospective feed resources for ruminant because of their high availability (2 to 1 of cocoa pods meal to cocoa seed ratio (Duke, 1983)) and concentrate in an area so that easily to handle and process. Cocoa pods contained 9% crude ash, 10% crude protein, 2 – 3% fat, 35% crude fibre (Barnes and Amega, 1984). It may resembles that of king grass quality (Sutardi, 1988) and superior than palm press fibre and rice straw (Toharmat et al., 1997). However, as a late mature plant component, the pods contained high cell walls (35% cellulose, 11% hemicelluloses, 6% pectin and 15% lignin (Sobamiwa and Longe, 1994)) which then restrict their utilization (Reynolds, 1995). Theobromine, a toxic alkaloid present in cocoa plants, may also limit its use as ruminant feedstuff (ICCO, 200). To increase utilization of cocoa pods in ruminant ration, therefore their quality upgrading should be done.
reported to be effective in improving fibrous feed quality (Schiere and Ibrahim, 1989; Sunstol et al, 1993; Chenost and Kayouli, 1997). The urea did not only improve fibre utilization but may also supply N for rumen microbial growth.
Since addition of urea increase amount of nitrogen in the treated feed, therefore their evaluation could not be assayed based on crude protein only (N x 6.25). There should be others N fractions that could describe true protein quality improvement on urea treated feed.
Objectives
The objectives of this study were to find the amount of urea level for cocoa pods quality improvement and evaluating their improvement using parameters that describe their improvement at best.
Methods
1. Urea treatments
The cocoa pods (CPs) of AFR (Forastero) cultivar were collected after harvesting the beans. The cocoa trees at the Cikasungka Cocoa Plantation in Bogor-Indonesia were about 20 years old and ranged from 1.5 to 3 m height at the time of the harvest. The cocoa pods were randomly subdivided into five treatments, each of three replications which were fresh cocoa pods (C) and four levels of urea applications: 0 (U0), 10 (U1), 20 (U2) and 30 (U3) g/kg fresh materials respectively (w/w).
2. Chemical analysis
The pH and DM were determined directly in fresh cocoa pods and in the ensiled, while all other parameters were measured in sun-dried samples. The pH was measured according to Naumann & Bassler (1997). Ten grams fresh samples were mixed with 100 ml distilled water and stirred with a laboratory blender for 3 min. The pH was measured in the filtrate with an electrode (Mettler Toledo In lab 417).
Contents of dry matter (DM), crude ash (ASH), crude protein (CP), crude lipid (XL), and crude fibre (CF) were analysed according to the conventional Weende procedure (Naumann & Bassler, 1997).
Non protein nitrogen (NPN) was determined by precipitation of true protein (TP) with tungstic acid, filtration and determination of the insoluble nitrogen in the residue. NPN was calculated as difference between total crude protein nitrogen and true protein nitrogen (Licitraet al., 1996).
Residual urea (UR) was measured according to Naumann & Bassler (1997). The sample was cleared with Carrez-solution I and II and agitated using an automatic shaker (Co Köttermann type 5627) for 30 minutes after the addition of water. The suspension was then filtrated. After the addition of 4-Dimethylamino-benzaldehyde, the absorbance in the filtrate was measured at 436 nm wavelength (Co. Eppendorf 1101 M) and the amount (concentration) calculated by plotting the absorbance value in a urea standard curve.
Non ammonia nitrogen (NAN) was determined using the same method as used byCarro & Miller (1999). The sample was wetted with distilled water, adjusted with 1 M NaOH to pH above 10, and dried at 90oC for 16 h to remove NH3-N. The N-content of the dried residues
accounting for NAN content was determined by micro Kjeldhal (Naumann & Bassler, 1997).
using an amino acid analyser LC 3000 (Co Eppendorf Biotroniks). The sulphur containing amino acids (methionine and cysteine) must be oxidised before hydrolysis with 5 ml performic acid (0.5 ml H2O2) and 4.5 ml 88% phenolic formic acid.
The determination of neutral detergent fibre (NDF), acid detergent fibre (ADF) and acid detergent lignin (ADL) were carried out according to Van Soest et al. (1991). The contents of
hemicellulose, cellulose, and crude lignin were calculated by difference. Hemicellulose were calculated as the difference between NDF and ADF, cellulose as the difference between ADF and ADL and crude lignin was calculated by subtracting ash residue (muffle-oven at 550oC) from ADL.
Theobromine content was analysed according to Naumann & Bassler (1997). Theobromine was extracted with chloroform and the extract was dried and then resolved in water and treated with silver-nitrate solution. The free saltpetre acid was titrated with sodium hydroxide. Theobromine content was calculated according to the formula:
Theobromine (% DM) = (ml NaOH x 18)/(mg sample weight x %DM)
Where 18 is the coefficient of conversion for each ml 0.1 N NaOH used in titration.
3. In vitro gas test
In vitro gas production was measured applying the Hohenheim Gas Test (Menke et al.,
1979). Approximately 200 mg sample (of about 90% DM) was weighed and incubated with 30 ml rumen fluid-buffer solution (1:2) in a 100 ml glass syringe. The syringes were put in a double wheel plat and rotated using a rotor in a 39oCwater bath. The fermentation process was stopped after 24 hours of incubation. The amounts of gas produced (Gb) in the syringes were read. The gas production was calculated for 200 mg DM.
Results
1. Chemical compositions
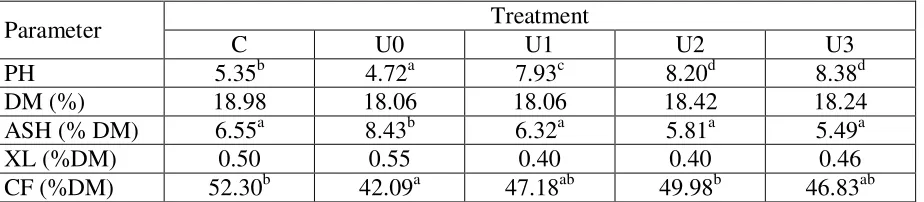
The pH and the results of proximate analyses of cocoa pods (CPs) are shown in Table 1. Ensilage (U0) reduced pH of CPs from 5.35 in the control (C) to 4.72. Addition of urea significantly increased pH (up to 8.38). However, there was no significant difference between U2 and U3. Dry matter (DM) contents tended to be reduced by ensiling with or without urea.
Table 1: PH and crude nutrient contents of cocoa pods
Parameter Treatment
C U0 U1 U2 U3
PH 5.35b 4.72a 7.93c 8.20d 8.38d
DM (%) 18.98 18.06 18.06 18.42 18.24
ASH (% DM) 6.55a 8.43b 6.32a 5.81a 5.49a
XL (%DM) 0.50 0.55 0.40 0.40 0.46
CF (%DM) 52.30b 42.09a 47.18ab 49.98b 46.83ab
Different superscripts in the same line indicate significant differences (p< 0.05)
Crude ash content of cocoa pods increased by ensilage compared to the control. However, addition of urea (U1 to U3) resulted in the same crude ash value as in the control. No significant difference was found in crude lipid content (XL). Inversely to crude ash, crude fibre content (CF) was decreased by ensilage. Urea addition tended to increase CF but still to a lower level than the control.
Table 2: N-Fractions of cocoa pods (% N in DM)
NPN = non protein nitrogen; TP = true protein; UR = residual urea; NAN = non ammonia nitrogen; AA = amino acids; nd = not determined. Different superscripts in the same line indicate significant differences (p< 0.05).
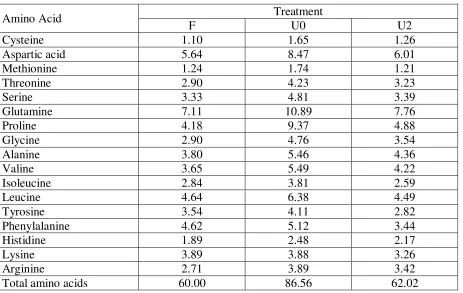
AA (calculation based on N-contents of measured amino acid) found in U0 was higher than in the control and in U2. No analysis has been made for U1 and U3. The amino acid composition changed as a result of ensilage (Table 3). This effect was more pronounced for proline, aspartic acid, and glutamine. Amino acids of U2 treated CPs was similar or slightly higher than for the control except for tyrosine, phenylalanine and lysine which were reduced.
Table 3: Amino acid contents of cocoa pods (mg/g DM)
0
The analysed cell wall contents are shown in Table 4. There was no significant effect of ensilage and urea on NDF. ADF was decreased by urea treatment whereas ADL was increased by ensilage.
Table 4: Cell wall constituents of treated CPs (% DM)
Parameter Treatment
Different superscripts in the same line indicate significant differences (p < 0.05).
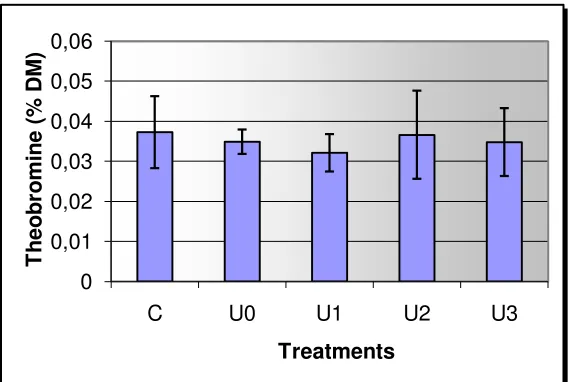
Hemicelluloses tended to increase by urea additions while cellulose was reduced in all urea treatments (U0 – U3). There were no significant effects of the treatment on crude lignin content. The contents of theobromine are shown in Figure 1. There was also no significant effect of the treatments on theobromine content of cocoa pods. Treatment U1 resulted in the lowest and the control in the highest theobromine contents (0.32 vs. 0.37 g/kg).
2. In vitro digestibility
In vitro gas production (Gb) of CPs is shown in Figure 2. Ensilage with or without urea treatment increased Gb significantly, treatment U3 excepted which decreased Gb sharply.
Figure 2: Gas productions of cocoa pods (n = 15; ± s)
Discussions
The proximate analyses of the cocoa pods indicated lower contents of CP (Total-N x 6.25), ash and crude lipid but higher CF than those observed by Barnes & Amega (1984). Theobromine content was also lower (0.032 vs. 0.32%) than reported by Barnes & Amega (1984). This may have been caused by the inclusion of pod husks in the samples. Although there was no effect of treatment, theobromine content of samples used in this study was very low and could be considered as being unaffective in ruminant nutrition. At present, there are no reports on theobromine toxicity in animals due to cocoa pods (ICCO, 2000).
The amount of N being lost from the time of addition to that of analysis increased with increasing levels of urea. While 10 g, 20 g and 30 g of urea had been added per kg fresh cocoa pods corresponding to 3.2 g, 6.4 g and 9.7 g urea-N per kg DM, only 1.7 g, 2.8 g and 5.6 g total-N (feed plus urea) were found in U1, U2 and U3 treatments respectively. Percentages of total-N losses as the ratio of urea-N added were 47%, 56% and 42% for U1, U2 and U3 respectively. It indicates an increased ureolytic activity (assuming N-losses as NH3). This is confirmed by the
similar trend in ammonia values. According to Chenost (2001), two-third of ammonia released from ureolysis is volatile and lost, and only one third of the ammonia binds on the forage cell wall.
The amount of N lost is also related to pH. Increasing urea level from U2 to U3 did not increase pH significantly. Possibly the time of incubation (14 days) was too short. Ureolytic activities are maximal at pH 7.0. The higher the pH the higher the ammonia-N lost. At an extremely high temperature of 90oC and pH > 10, all ammonia is lost. According to this feature ammonia is used to determine NAN (Carro & Miller, 1999). According to Rexen & Knudsen (1984) the alkali process on feed depends on temperature, pressure, alkali concentration and reaction time.
The evaluation of TP as tungstic acid precipitable protein seems not to be valid for urea treated fibrous feed. TP may be overestimated and NPN underestimated since not all of the NPN might be separated from TP (Licitra et al., 1996).
Total N in U0 was slightly higher than in the control. It may partly be the result of indirect enrichment of N due to organic matter degradation during ensilage. Both, the decreased pH and the low ammonia concentration are indicators for an acid fermentation of ensiled cocoa pods (U0). Possibly the substrate for fermentation was too low for a stronger acid production which would have led to an even lower pH.
The decrease in ADF for treatment U1 – U3 in comparison to control is associated with lower cellulose and partially compensatory higher hemicellulose contents. The quality of the fibre fraction of urea treated cocoa pods was therefore modified and should be higher and/or faster degradable in the microbial rumen environment.
ammonia effect on the microbes in the in vitro test. According to Smith (1989), at pH above 7 urea splitting in the rumen results predominantly in NH3 which is toxic to the rumen if present in
large amounts. However, at pH below 7 a high concentration of non toxic NH4+ predominates.
For calculation of OMD and ME from in vitro gas production, cocoa pods are grouped to dry fodder or hay and the following formulas are applied:
OMD (%) = 16.49 + 0.9042 Gb + 0.0492 (CP or TP or (NAN – UR) x 6.25) + 0.0387 XA
ME (MJ/kg DM) = 2.43 + 0.1206 Gb (ml) + 0.0069 (CP or TP or (NAN – UR) x 6.25) + 0.0187 XL
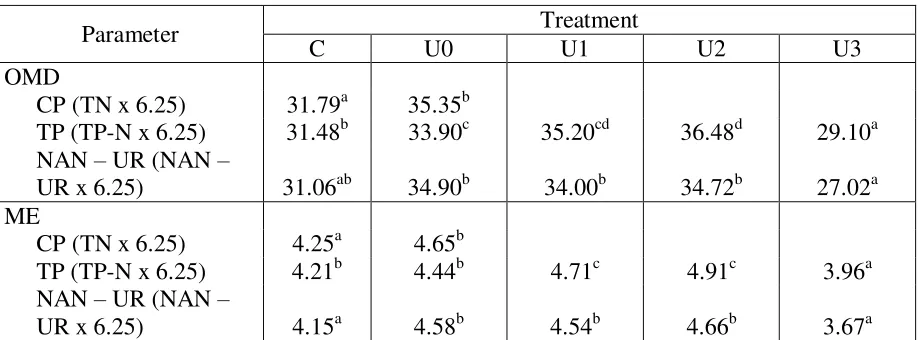
Where Gb is in ml, while TP, ASH and XL are in g/kg DM (Menke & Steingass (1987). The results of these calculations are shown in Table 5.
Table 5: OMD (%) and ME (MJ/kg DM) of cocoa pods
Parameter Treatment
C U0 U1 U2 U3
OMD
CP (TN x 6.25) 31.79a 35.35b
TP (TP-N x 6.25) 31.48b 33.90c 35.20cd 36.48d 29.10a NAN – UR (NAN –
UR x 6.25) 31.06ab 34.90b 34.00b 34.72b 27.02a
ME
CP (TN x 6.25) 4.25a 4.65b
TP (TP-N x 6.25) 4.21b 4.44b 4.71c 4.91c 3.96a
NAN – UR (NAN –
UR x 6.25) 4.15a 4.58b 4.54b 4.66b 3.67a
Different superscripts in the same line indicate significant differences (p < 0.05)
For C, the formula renders almost the same OMD- and ME-values with either CP or TP as dependent variables whereas (NAN-UR) delivers somewhat lower values. The lower values calculated for U0 when TP is used instead of CP can be explained with the relatively big difference between CP and TP.
resulting in higher TP than (NAN-UR) values. The values calculated by applying (NAN-UR) are therefore suggested to be the nearest evaluations of the real feeding values of the samples. However, the OMD and ME values may be underestimated due to considering TP instead of CP.
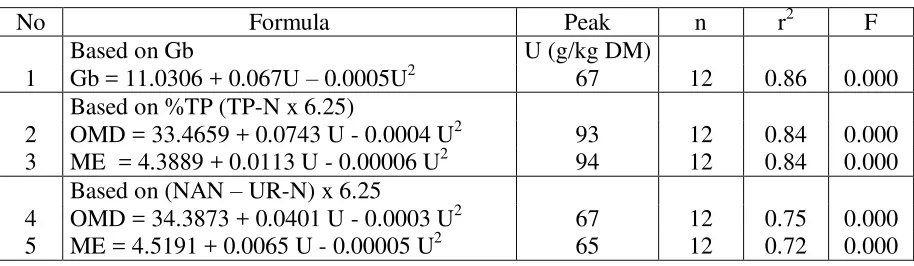
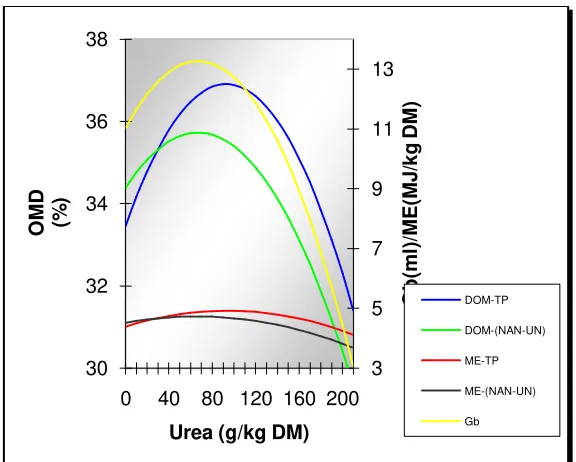
The response of Gb, OMD and ME on urea applications followed the equations shown in Table 6. The maximum Gb was reached at approximately 67 g urea per kg DM cocoa pods. About the same urea level was estimated for OMD and ME maximum with (NAN–UR) as dependent variable.
Table 6: Response of OMD and ME on urea applications
No Formula Peak n r2 F
Based on Gb U (g/kg DM)
1 Gb = 11.0306 + 0.067U – 0.0005U2 67 12 0.86 0.000 Based on %TP (TP-N x 6.25)
2 OMD = 33.4659 + 0.0743 U - 0.0004 U2 93 12 0.84 0.000 3 ME = 4.3889 + 0.0113 U - 0.00006 U2 94 12 0.84 0.000
Based on (NAN – UR-N) x 6.25
4 OMD = 34.3873 + 0.0401 U - 0.0003 U2 67 12 0.75 0.000 5 ME = 4.5191 + 0.0065 U - 0.00005 U2 65 12 0.72 0.000
Figure 3: OMD and ME of CPs as response to urea treatment
Conclusions
The treatments (ensilage with or without urea) improve the nutritive value of cocoa pods by weakening the ligno-cellulose or –hemicellulose bonds which then can easier be penetrated by rumen microbes, resulting in higher in vitro gas production, as well as higher calculated OMD and ME values compared to the control. The protein value of cocoa pods, expressed as TP or (NAN-UR) was also increased. The (NAN-UR) value is suggested to be the nearest evaluation of the real protein value of urea treated cocoa pods.
References
Barnes, A.R.; Amega, W.K., 1984: Utilization of cocoa husk meal by growing-finishing pigs. 9th International Cocoa Research Conference, Lomé, Togo, 12-18 February 1984. pp. 449 – 454.
Carro, M.D.; Miller, E.L., 1999: Effect of supplementing a fibre basal diet with different nitrogen forms on ruminal fermentation and microbial growth in an in vitro semi-continuous culture system (RUSITEC). British J. Nutr. 82, 149 – 157.
Chenost, M., 2001: Optimizing the use of poor quality roughages through treatments and supplementation in warm climate countries with particular emphasis on urea treatment. http://www.fao.org/ag/AGA/AGAP/FRG/ECONF95/HTML/CHENOST.HTM.
Chenost, M.; Kayouli, C., 1997: Roughage utilization in warm climates. Animal Production and Health Paper 135. FAO, Rome.
Duke, A.D., 1983: Handbook of Energy Crops. Unpublished. http://www.hort.purdue.edu/ newcrop/duke_energy/Theobroma_cacao.html
Flachowsky, G.; Kamra, D.N; Zadrazil, F., 1999: Cereal straws as animal feed – possibilities and limitation. J. Appl. Anim. Res. 16: 105 – 118.
ICCO, 2000: Animal feed from cocoa. http://www.icco.org/questions/animalfeed.htm.
Licitra, G.; Hernandez, T. M.; Van Soest, P. J. , 1996: Standardization of procedures for nitrogen fractionation of ruminant feeds Anim. Feed Sci. Technol. 57, 347 – 358.
Menke, K.H..; Steingass, H., 1987: Schätzung des Energetischen futterwerts aus der In vitro mit Pansensaft bestimmen gasbidung und der Chemischen analyse. II. Regressionsgleichungen. Übers. Tierernährg. 15, 59 – 94.
Menke, K.H.; Raab, L.; Salewski, A.; Steingass, H.; Fritz, D.; Schneider, W., 1979: The estimation of the digestibility and metabolizable energy content of ruminant feedstuffs from the gas production when they are incubated with rumen liquor. J. Agric. Sci. 93, 217 – 222.
Naumann, C.; Bassler, R., 1997: VDLUFA-Methodenbuch Band III, Die chemische Untersuchung von Futtermitteln. 3rd ed. VDLUFA-Verlag, Darmstadt, Germany.
Rexen, F.P.; Knudsen, K.E.B., 1984: Industrial-scale dry treatment with sodium hydroxide. In: Sundstl, F.; Owen, E., 1984: Straw and other fibrous by-products as feed. Dev. Anim. Vet. Sci. 14, 127 – 159.
Schiere, J.B.; Ibrahim, M.N.M., 1989: (Eds.) Feeding of urea ammonia treated rice straw. A compilation of miscellaneous reports produced by the Straw. Utilization Project (Sri-Lanka). Pudoc, Wageningen, pp. 125.
Smith, R.H., 1989: Nitrogen metabolism in the ruminant stomach. In: Bock, H.D.; Eggum, B.O.; Low, A.G.; Simon, O.; Zebrowska, T.; Low, A.G., (Eds.): Protein Metabolism in Farm Animals: Evaluation, Digestion, Absorption and Metabolism. VEB Deutscher Landwirtschaftsverlag, Berlin. pp. 165 – 203.
Sobamiwa, O.; Longe, O.G., 1994. Utilisation of cocoa-pod pericarp fractions in broiler chick diets. Anim. Feed Sci. Technol. 47, 237 – 244.
Sundstl, F.; Mgheni, D.M.; Pederson, I., 1993: Recent finding on upgrading of the feeding value of straw by chemical and biological methods. Proceedings of the International Conference on Increasing Livestock Production through Utilisation of Local Resources. 8 – 12 October 1993. Beijing – China.
Sutardi, T., 1988: Rumus Penduga TDN. Faculty of Animal Science. Bogor Agricultural University. Unpublished.
Toharmat, T. ; Tjakradidjaja, A.S. ; Suryahadi ; Sigit, N.A. ; Permana, I.G., 1997: Nutritive value of palm and cocoa plantation by-products in dairy cattle ration. Proceeding National Seminar II Nutrition and Feed Sciences, 15 – 16 July 1997. Bogor – Indonesia. pp. 57 – 58. Van Soest, P. J.; Robertson, J.B.; Lewis, B.A., 1991: Methods for dietary fiber, neutral detergent
fibre and non-starch polysaccharides in relation to animal nutrition. J. Dairy Sci. 74, 3583 – 3597.