DEGRADATION STUDIES ON WASTEWATER CONTAINING
METHYL-DIETHANOLAMINE BY USING UV/H2O2
ADVANCED OXIDATION PROCESS
By
SABTANTI HARIMURTI
A Thesis
Submitted to the Postgraduate Studies Programme As a Requirement for the Degree of
DOCTOR OF PHILOSOPHY
CHEMICAL ENGINEERING DEPARTMENT UNIVERSITI TEKNOLOGI PETRONAS
BANDAR SERI ISKANDAR, PERAK
ACKNOWLEDGEMENTS
Alhamdulillah, praise be to Allah, I thank to God the Lord of the worlds, the source of strengths and inspirations for finishing up my PhD program.
I would like to express my deep gratitude to my supervisor Prof. Dr. Thanabalan Murugesan and my co-supervisor Assoc. Prof. Ir. Abdul Aziz Omar for their patient guidance, enthusiastic encouragement, and useful critiques of this research work, as well as providing facilities and chemicals.
I would like to thanks for the assistance given by Mr. M Azhar B A Satar and Mr. Noor Azahari B Arshad for their helpful provides in methyldiethanolamine effluent from Petronas Penapisan Melaka Sdn. Bhd (PPMSB). I would like also to extend my thanks to the technicians of the laboratory Universiti Teknologi PETRONAS for their effort in helping me for setting up of my experiment.
Special thanks to my husband and my sons. Thank you for the love, patience, and faith for all the day during my absence as a wife and mother.
I also would like to thank Universiti Teknologi PETRONAS for the scholarship granted under Graduate Assistantship scheme. Thank you to Chemical Engineering Department and Center for Graduate Studies, Universiti Teknologi PETRONAS for the facilities provided for conducting the research.
ABSTRACT
Methyldiethanolamine (MDEA) in aqueous solutions is frequently used for scrubbing carbon dioxide (CO2) and hydrogen sulfide (H2S) from natural gas. Large
quantity of MDEA disposed into the wastewater during cleaning and maintenance as well as shutdown of the absorption and desorption columns of the gas processing plant. The MDEA is not readily biodegradable and such wastewater cannot be treated using the conventional treatment facility. Advanced Oxidation Processes (AOP’s),
such as oxidation by Fenton’s reagent, UV/H2O2 and UV/Ozone have been
recommended as a class of techniques used for the total/partial degradation of recalcitrant organics which are not readily amenable to conventional biological oxidation. Based on the advantages of UV/H2O2 process such as no formation of
sludge during the treatment, applicable for a wide range of pH, and high capability of hydroxyl radical production, the UV/H2O2 process was chosen for the treatment of
effluents containing MDEA from refinery plant. For this purpose, a synthetic MDEA solution and a real effluent from gas processing unit of a refinery were used for the experiments employing UV/H2O2 advanced oxidation process. The degradation of
MDEA was found to be highly dependent on the initial concentration of H2O2, the
initial pH, and the reaction temperature. The important parameters that govern the MDEA degradation by UV/H2O2 process were optimized using response surface
methodology (RSM). The optimum conditions for degradation process of synthetic MDEA waste were at initial pH = 9.76, ratio between contaminant to oxidant = 1000 ppm of organic carbon to 0.22 M H2O2, and temperature = 30ºC.
At optimum condition of degradation process for 3 hours irradiation using UV intensity at 12.06 mW/cm2, the maximum TOC removal achieved for synthetic and real effluent was 85.74% and 92.05%, respectively. Even though the main component of real refinery effluent was MDEA, however the other contaminats such as the presence of organic acids caused a slightly different optimum condition for degradation of refinery effluent from gas plant. During oxidation process, oxalic acid, acetic acid, formic acid, nitrite (NO2-), nitrate (NO3-), ammonium (NH4+), and carbon
dioxide (CO2) were identified as the intermediates formed during degradation.
Hydroxyl radical rate constants of MDEA mineralization at different temperatures by using UV/H2O2 in aqueous solution were also estimated. The rate constants of MDEA
mineralization were not dependent on temperature when the temperature of reaction was less than 30ºC. Based on the estimated hydroxyl radical rate constants of MDEA mineralization at temperature 20 - 50ºC, the activation energy for mineralization of MDEA by hydroxyl radical was estimated as 10.20 kJ mol-1. The presence of bicarbonate in the solution increased the TOC removal (reached 100 % TOC removal) at an initial pH = 7. This is due to the capability of bicarbonate to act as a good buffer.
At pH ≥ 7, the active site for hydroxyl radical oxidation was more provided. The biodegradability of partially degraded MDEA after UV/H2O2 was evaluated by
estimation of the BOD5/COD ratio from experimental data collected, and the
estimated value (BOD5/COD), proved that the partially degraded wastewater is
readily biodegradable and it can safely be discharged into the environment. The energy efficiency for TOC removal of MDEA using UV/H2O2 is proved as more
ABSTRAK
Methyldiethanolamine (MDEA) dalam larutan akuas selalu digunakan untuk menapis karbon dioksida (CO2) dan hidrogen sulfida (H2S) daripada gas asli. Kuantiti MDEA
yang besar telah dilupuskan ke dalam air kumbahan semasa proses pembersihan dan penyelenggaraan serta penutupan ruangan penyerapan dan nyahpenyerapan loji pemprosesan gas. MDEA tidak boleh terbiodegradasi secara terus dan kemudahan rawatan konvensional tidak boleh digunakan untuk merawat air kumbahan tersebut. Proses Pengoksidaan Lanjutan (AOP), seperti pengoksidaan oleh reagen Fenton UV/H2O2, dan UV / Ozon telah disyorkan sebagai kelas teknik yang digunakan untuk
mendegradasi secara keseluruhan / separa bagi organik degil yang tidak mudah untuk dioksidakan melalui biologi konvensional. Berdasarkan kelebihan UV/H2O2 proses
seperti tiada pembentukan enap cemar semasa rawatan, boleh di aplikasi untuk pelbagai nilai pH, dan keupayaan tinggi untuk menghasilkan radikal hidroksil, proses UV/H2O2 telah dipilih untuk merawat efluen yang mengandungi MDEA dari loji
penapisan. Bagi tujuan ini, penyelesaian MDEA sintetik dan efluen sebenar dari unit pemprosesan gas penapisan telah digunakan untuk eksperimen UV/H2O2 proses
pengoksidaan lanjutan. Degradasi MDEA sangat bergantung kepada kepekatan awal H2O2, nilai awal pH, dan suhu tindak balas. Parameter penting yang mengawal
degradasi MDEA oleh proses UV/H2O2 telah dioptimumkan dengan menggunakan
kaedah gerak balas permukaan (RSM). Keadaan optimum proses degradasi sisa sintetik MDEA adalah pada nilai pH awal 9.76, nisbah antara pencemar kepada oksidan adalah 1000 ppm karbon organik kepada 0.22 M H2O2, dan suhu ialah 30 ºC.
Selain itu keadaan optimum proses degradasi penapisan efluen sebenar adalah pada nilai pH awal 8.13, nisbah antara pencemar kepada oksidan ialah 1000 ppm karbon organik kepada 0.24 M H2O2, dan suhu ialah 30 ºC. Pada keadaan optimum proses
manakala 92.05% untuk efluen sebenar. Walaupun komponen utama penapisan efluen sebenar adalah MDEA, namun bahan pencemar lain seperti kehadiran asid organik menyebabkan keadaan optimum untuk degradasi sedikit berbeza. Semasa proses pengoksidaan, asid oksalik, asid asetik, asid formik, nitrit (NO2-), nitrat (NO3-),
ammonium, dan karbon dioksida (CO2) telah dikenal pasti sebagai perantaraan yang
terbentuk semasa degradasi. Hidroksil pemalar kadar radikal mineral MDEA pada suhu yang berbeza dengan menggunakan UV/H2O2 dalam larutan akuas juga
dianggarkan. Pemalar kadar MDEA pemineralan tidak bergantung kepada suhu apabila suhu tindak balas adalah kurang daripada 30 ºC. Berdasarkan anggaran pemalar kadar radikal hidroksil mineral MDEA pada suhu 20 - 50 ºC, tenaga pengaktifan bagi mineral daripada MDEA oleh radikal hidroksil dianggarkan sebagai 10.20 kJ mol-1. Kehadiran bikarbonat dalam larutan meningkatkan penyingkiran TOC (mencapai 100% penyingkiran TOC) pada nilai pH awal 7. Ini adalah disebabkan oleh keupayaan bikarbonat untuk bertindak sebagai penampan yang baik. Pada pH ≥ 7, tapak aktif untuk pengoksidaan radikal hidroksil adalah lebih banyak. Biodegredasi separa MDEA selepas UV/H2O2 telah ditentukan dengan mengira nisbah BOD5/COD,
dan nilai anggaran (BOD5/COD), terbukti bahawa biodegradasi separa air sisa telah
terbiodegradasi dan ia selamat untuk dilepaskan ke dalam alam sekitar. Kecekapan tenaga untuk penyingkiran TOC MDEA menggunakan UV/H2O2 dibuktikan sebagai
In compliance with the terms of the Copyright Act 1987 and the IP Policy of the university, the copyright of this thesis has been reassigned by the author to the legal entity of the university,
Institute of Technology PETRONAS Sdn Bhd.
Due acknowledgement shall always be made of the use of any material contained in, or derived from, this thesis.
© Sabtanti Harimurti, 2013
TABLE OF CONTENTS
STATUS OF THESIS ... i
DECLARATION OF THESIS ... Error! Bookmark not defined. ACKNOWLEDGEMENTS ... v
ABSTRAK ...viii
TABLE OF CONTENTS ... xi
LIST OF FIGURES ... xiv
LIST OF TABLES ...xviii
CHAPTER 1 ... 1
INTRODUCTION ... 1
1.1. Background of Research ... 1
1.2 Problem Statement ... 3
1.3 Objectives ... 4
1.4 Scope of the Present Research ... 4
1.5 Organization of Thesis ... 5
CHAPTER 2 ... 7
LITERATURE REVIEW ... 7
2.1 Natural Gas Sweetening Process ... 7
2.1.1 The Removal of Acidic Gas from Natural Gas ... 8
2.1.2 Process Wastewater from Natural Gas Sweetening Operation ... 10
2.2 Wastewater Treatment ... 11
2.2.1 Wastewater Regulation ... 12
2.2.2 Wastewater Characteristics ... 13
2.2.3 Wastewater Treatment Methods ... 14
2.2.4 The Hybrid Process of Advanced Oxidation followed by Biological Treatment ... 15
2.3 Advanced Oxidation Processes ... 16
2.3.1 The Reaction Mechanism of Hydroxyl Radical toward Organic Contaminant in Wastewater ... 18
2.3.2 Fenton’s Process ... 19
2.3.4 High Voltage Electrical Discharge Processes ... 26
2.3.5 Others AOP’s ... 29
2.3.6 AOP’s based on Ultraviolet Light... 30
2.4 Response Surface Methodology of Statistical Design of Experiment ... 47
2.5 Degradation Intermediate ... 48
2.6 Biodegradability of Pollutants ... 51
CHAPTER 3 ... 57
EXPERIMENTAL ... 57
3.1 Materials ... 58
3.1.1 MDEA Contaminated Water/Effluents ... 58
3.1.2 Reagents Used ... 61
3.2 Experimental Set Up ... 62
3.2.1 UV/H2O2 Oxidation Process ... 62
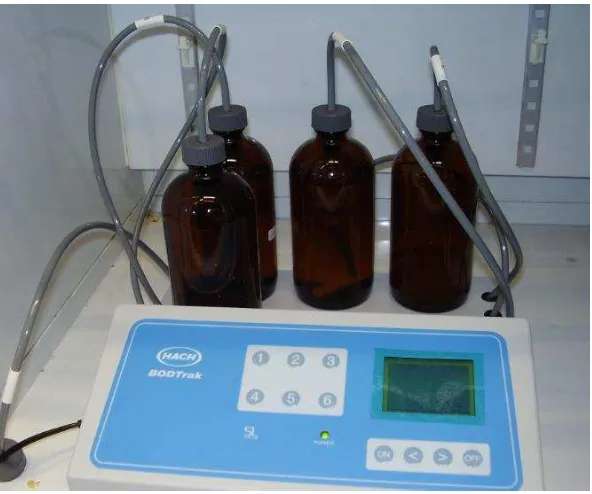
3.2.2 Biodegradability Test of Partially Degraded MDEA Solution ... 65
3.3 Analytical Methods ... 66
3.3.1 Total Organic Carbon (TOC) Determination ... 66
3.3.2 Chemical Oxygen Demand (COD) Determination ... 67
3.3.3 BOD5 Determination ... 67
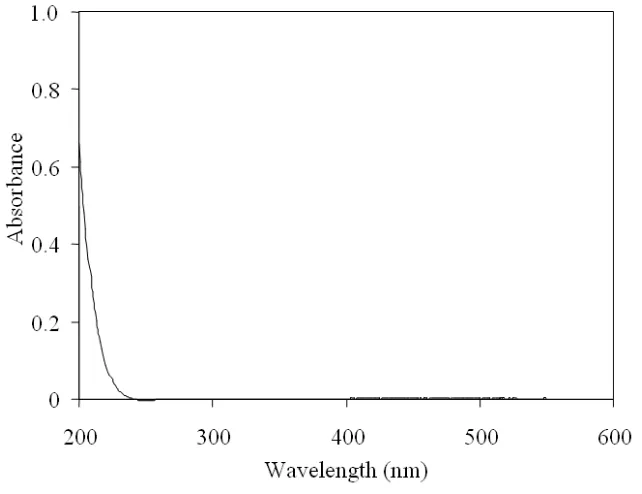
3.3.4 Identification of UV Absorption Spectra of MDEA ... 68
3.3.5 Un-reacted MDEA and Degradation Product Identification using HPLC ... 68
3.3.6 Nitrate (NO3-) and Nitrite (NO2-) Determination ... 69
3.3.7 Estimation of Ammonium (NH4+) ... 70
3.3.8 Un-reacted H2O2 Determination ... 70
3.3.9 pH ... 70
3.3.10 Measurement of UV Intensity ... 71
3.4 Statistical Design of Experiments (DOE) for Optimization of Degradation Process by Using UV/H2O2 ... 71
CHAPTER 4 ... 73
RESULTS AND DISCUSSION ... 73
4.1 Preliminary Studies ... 73
4.1.2 Effect of Initial Concentration of MDEA ... 77
4.1.3 Effect of UV Intensity in Combination with H2O2 ... 79
4.1.4 Effect of Initial Concentration of H2O2 in Combination with UV ... 81
4.1.5 Effect of pH... 84
4.1.6 Effect of Temperature ... 86
4.1.7 Optimization Process of MDEA Degradation by using UV/H2O2 ... 88
4.2 Degradation Intermediates Identification and Development of Degradation Mechanism ... 95
4.3 Kinetics of MDEA Mineralization Process... 102
4.3.1 Determination of Kinetic Constants of MDEA Mineralization ... 102
4.3.2 Temperature Dependence of MDEA Mineralization ... 113
4.4 Effect of Bicarbonate on MDEA Mineralization by UV/H2O2 ... 116
4.5 Degradation of Refinery Effluent (PPMSB Effluent) using UV/H2O2 ... 123
4.6 Biodegradability Test on Partially Degraded MDEA Solution... 129
4.7 Electrical Energy Consumption ... 130
CHAPTER 5 ... 135
CONCLUSIONS AND RECOMENDATIONS ... 135
5.1 Conclusions ... 135
5.2 Recommendations ... 136
REFERENCES ... 138
PUBLICATIONS ... 156
APPENDIX A ... 157
CALIBRATION CURVE ... 157
APPENDIX B ... 164
LIST OF FIGURES
Figure 2. 1 Chemical Structure of MDEA ... 9
Figure 2. 2 Flow diagram of a typical amine treating process [13]. ... 10
Figure 2. 3 Constituent of wastewater. ... 14
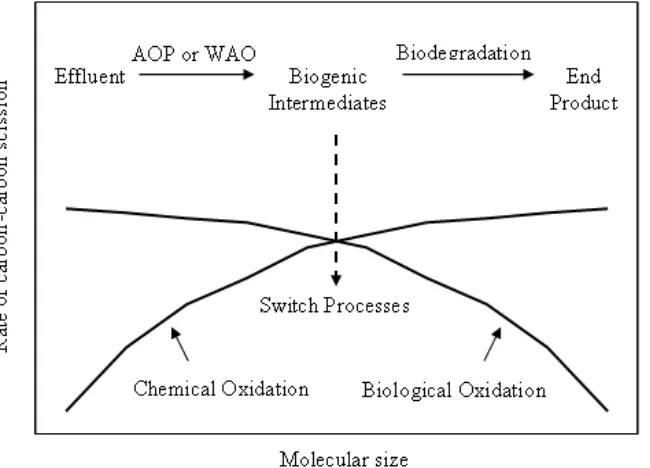
Figure 2. 4 The concept of coupling AOP-based pre-treatment with biological post-treatment [28]. ... 15
Figure 2. 5 Generation of hydroxyl radicals using different techniques [30]. ... 16
Figure 2. 6 Range of electromagnetic waves [31]. ... 31
Figure 2. 7 The general scheme of UV based oxidation reactions in the presence of auxiliary oxidant [32]. ... 33
Figure 3. 1 Scheme of activities in the present research. ... 57
Figure 3. 2 Correlation of MDEA concentrations with total organic carbon (TOC). ... 59
Figure 3. 3 Correlation of MDEA concentrations with organic carbon. ... 59
Figure 3. 4 UV/H2O2 oxidation experimental set up. ... 63
Figure 3. 5 The schematic diagram of the UV/H2O2 photoreactor. ... 63
Figure 3. 6 Experimental set up for the identification of CO2 liberation during UV/H2O2 oxidation process. ... 64
Figure 3. 7 Experimental set up of biodegradability test. ... 66
Figure 4. 2 Individual effect of UV, H2O2, and the combination of UV/H2O2
on the MDEA mineralization ([MDEA]0 = 1000 ppm TOC;
[H2O2]0 = 0.12 M; pH = 7; Temperature = 30 ⁰C
UV intensity = 12.06 mW/cm2). ... 75
Figure 4. 3 UV absorption spectra of MDEA. ... 76
Figure 4. 4 H2O2 profile during the UV/H2O2 process. ... 77
Figure 4. 5 The degradation profile of organic carbon for different initial
concentration of MDEA ... 78
Figure 4. 6 Effect of initial concentration of MDEA on TOC removal
(after 360 minute reaction time). ... 79
Figure 4. 7 The degradation profile of organic carbon for different
UV intensities... 80
Figure 4. 8 Effect of different UV intensity on TOC removal. ... 81
Figure 4. 9 The degradation profile of organic carbon at different ... 82
Figure 4. 10 Effect of initial concentration of H2O2 on TOC removal
(after 180 min). ... 83
Figure 4. 11 The degradation profile of organic carbon for different ... 85
Figure 4. 12 Effect of initial pH condition on TOC removal. ... 85
Figure 4. 13 The degradation profile of organic carbon at different temperature .... 87
Figure 4. 14 Effect of temperature on TOC removal. ... 88
Figure 4. 15 Relation between experimental value and fitted value
of TOC removal. ... 91
Figure 4. 16 Pareto chart of the standardized effect for percentage
Figure 4. 17 3D Contour plots of TOC removal for MDEA. ... 93
Figure 4. 18 Comparison of predicted and experimental TOC removal at optimum condition. ... 94
Figure 4. 19 Inorganic by-product profile during the UV/H2O2 process. ... 95
Figure 4. 20 Chromatogram of partially degraded MDEA after UV/H2O2 process using YMC-PolymerC18 column. ... 97
Figure 4. 21 Chromatogram of partially degraded MDEA after UV/H2O2 using Transgenomic column. ... 98
Figure 4. 22 Organic by-products profile during the UV/H2O2 process. ... 99
Figure 4. 23 The initial stages of MDEA mineralization by hydroxyl radical. ... 100
Figure 4. 24 Reaction pathways of intermediate degradation by hydroxyl radical. ... 101
Figure 4. 25 MDEA mineralization profile at different initial concentration of H2O2. ... 102
Figure 4. 26 MDEA mineralization profile at different initial concentration of contaminant. ... 103
Figure 4. 27 Plot of ln[-d[C]0/dt] vs ln[H2O2]0 at four different temperatures. ... 109
Figure 4. 28 Plot of ln[-d[C]0/dt] vs ln[C]0 at four different temperature. ... 110
Figure 4. 29 Plot of Equation 4.16 at the initial period of mineralization... 112
Figure 4. 30 Plot of ln k3 vs 1/T. ... 115
Figure 4. 31 The organic carbon profile during the degradation of MDEA using UV/H2O2, in the presence of NaHCO3 at initial pH = 7. ... 117
Figure 4. 33 The pH profile during the degradation of MDEA using UV/H2O2
with the presence of NaHCO3 at initial pH = 9.76. ... 120
Figure 4. 34 The organic carbon profile during the degradation of MDEA
using UV/H2O2 with the presence of NaHCO3 at initial pH = 9.76. . 121
Figure 4. 35 Percentage TOC removal achieved at initial pH = 7, for different concentration of NaHCO3. ... 122
Figure 4. 36 Percentage TOC removal achieved at initial pH = 9.76, for different concentration of NaHCO3. ... 122
Figure 4. 37 Correlation between the experimental and fitted value
(Equation 4.27) of TOC removal for refinery effluent. ... 125
Figure 4. 38 Pareto chart of the standardized effect for percentage
TOC removal for screening of significant factors for degradation
of actual effluent. ... 126
Figure 4. 39 Contour plots of TOC removal for refinery effluent. ... 127
Figure 4. 40 Comparison of experimental and predicted TOC removal for
refinery effluent. ... 128
Figure 4. 41 The biodegradability evaluation of simulated MDEA solution. ... 129
Figure 4. 42 The biodegradability evaluation of actual refinery effluent. ... 130
Figure 4. 43 The TOC for photochemical degradation of MDEA by UV/H2O2 .... 131
Figure 4. 44 The TOC for the photocatalytic degradation of MDEA ... 131
Figure 4. 45 Comparison of energy consumption of MDEA degradation in the present work using UV/H2O2 and using ZnO/SnO2 coupled
LIST OF TABLES
Table 2. 1 Malaysian effluent standard regulation for sewage and industrial effluents, Environmental Quality Act 1974 [Laws of Malaysia; (act 127) 1999] [24]. ... 12
Table 2. 2 Redox potential standards of some oxidant species [30]. ... 17
Table 2. 3 Sample of chemical species oxidizable by hydroxyl radicals [30]. ... 17
Table 2. 4 Literature review on Fenton processes, Fenton like processes and photo-Fenton processes for various types of pollutants. ... 21
Table 2. 5 Ozone-based oxidation processes for various contaminants. ... 27
Table 2. 6 Radiation type and pertaining energy levels [31]. ... 31
Table 2. 7 The review of experimental conditions and results of the
UV/H2O2 process. ... 38
Table 2. 8 The photocatalytic degradation on various contaminants with
various modifications. ... 44
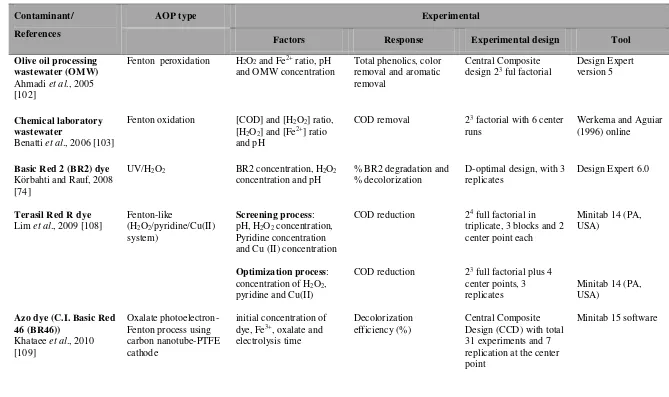
Table 2. 9 Application of response surface methodology (RSM) in the
advanced oxidation processes (AOP’s) area. ... 49
Table 2. 10 The identified by-products formed during the degradation
of organic compounds containing nitrogen using AOP’s. ... 52
Table 2. 11 Condition/concentration of pollutants that requires pre-biological treatment [117]. ... 54
Table 2. 12 Biodegradability enhancement by advanced oxidation processes
(AOP). ... 55
Table 3. 1 Chemicals used in the present work... 58
Table 3. 3 The correlation constants for the calibration curves for MDEA
and organic acids... 69
Table 3. 4 The correlation constants for the calibration curves for nitrate (NO3-) and nitrite... 70
Table 4. 1 The three levels chosen from the preliminary study. ... 89
Table 4. 2 Box-Behnken matrix design. ... 89
Table 4. 3 Box-Behnken matrix design with experimental and fitted value... 90
Table 4. 4 ANOVA analysis for TOC removal of synthetic MDEA waste. ... 92
Table 4. 5 Optimum condition for the degradation of MDEA by using UV/H2O2 at initial TOC = 1000 ppm; UV light intensity = 12.06 mW/cm2. ... 94
Table 4. 6 Estimated reduction rates at initial 30 minutes. ... 104
Table 4. 7 Calculated values for kexp and k3. ... 111
Table 4. 8 Literature values for hydroxyl radical rate constants for different compounds. ... 114
Table 4. 9 Activation energies of hydroxyl radical oxidation for different pollutants. ... 115
Table 4. 10 Box-Behnken matrix design with observed and fitted value for refinery effluent. ... 124
Table 4. 11 ANOVA analysis for TOC removal of refinery effluent. ... 127
Table 4. 12 Optimum condition for the degradation of PPMSB effluent by using UV/H2O2 at initial concentration of contaminant (TOC) = 1000 ppm; ... 128
NOMENCLATUR
Symbol Description Unit
v frequency Herzt
h Planck constant J.s
c speed of light m.s-1
wavelength m
t time minute/second
TOC total organic carbon ppm
COD chemical oxygen demand ppm
%TOCremovalt percentage of TOC removal at t ppm
TOC0 TOC value at t = 0 ppm
TOCt TOC value at t ppm
BOD5 biological oxygen demand at 5 days ppm
DO5 dissolved oxygen at 5 days ppm
y predicted response -
β0 intercept -
βi linear effect -
βii squared effect -
βij interaction effect -
ε error term -
kexp observed mineralization rate constant M-1s-1
k3 rate constant of MDEA mineralization M-1s-1
by hydroxyl radical
C substrate M
ΦH2O2 quantum yields of the photolysis H2O2 mol.E-1
Wabs,H2O2 radiation rate absorbed by H2O2 E.s-1
V volume L
A0 preexponential factor -
Ea activation energy J.mol-1
R ideal gas constant J.K-1.mol-1
T temperature oK
energy efficiency g kWh-1
∆TOC total organic carbon removed ppm
CHAPTER 1
INTRODUCTION
1.1. Background of Research
Methyldiethanolamine (MDEA) is one of the common alkanolamines used in the petrochemical industries such as natural gas processing plant, refineries, and ammonia gas plant. MDEA in water solution is used as a solvent for the absorption of acidic gases such as CO2 and H2S, which are present in natural gas. Petrochemical industries
discharge large amount of alkanolamine in wastewater during the cleaning, maintaining and scheduled inspection of the plant. The presence of this contaminant generates toxic and often non biodegradable substances into the aqueous phase, resulting in severe environmental pollution problem. The toxicity of this wastewater is due to its high content of nitrogen and dissolved organic compounds (i.e. chemical oxygen demand (COD) concentration is approximately 500000 ppm). Toxicity and non biodegradability of alkanolamine have been reported by Sandin et al. [1], Duran-Moreno et al. [2] and Fürhaker et al. [3], respectively.
since the toxic contaminant often inhibited or even eliminated the bacteria populations in the conventional wastewater treatment plants. Therefore, a hybrid process i.e.
AOP’s prior to biological treatment is required to achieve a complete degradation of contaminant. In other words, the toxic wastewater should be pre-treated using AOP’s before biological treatment.
In terms of refinery wastewater, the wastewater is commonly generated with high concentration of alkanolamine and often difficult to degrade using the conventional biological degradation. This issue is becoming an interesting research topic for the degradation study of wastewater containing alkanolamine. Therefore, during the recent decade many researchers started to look for developing alternative methods/techniques for refinery wastewater treatment. Ali et al. [4] used the ZnO/SnO2 coupled photocatalysts in the presence of UV light (356 nm) to degrade
MDEA in water solution. They successfully reduced the MDEA and total organic carbon (TOC) as much as 39.18% and 23.15% respectively using the photocatalysts for 5 hours of treatment and the initial concentration of MDEA was 1000 ppm. Even though this treatment could partially remove MDEA and TOC, however a better performance method with high efficiency for the complete degradation of refinery wastewater may still be required. One of the considerably demonstrated techniques
from AOP’s namely, Fenton’s treatment has been well studied to degrade the organic contaminant that are commonly present in the refinery wastewater. Fenton’s reagent,
a mixture of ferrous sulfate and hydrogen peroxide [5] has been used to treat MEA
[6], DEA [7], DIPA [8], and real Qilu refinery wastewater in China [λ]. The Fenton’s
process was found to be more effective due to its rapid oxidation process, but the formation of sludge and their applicability at particular pH condition (i.e. acidic) pH, have created a necessity for an alternative technique for the treatment of refinery wastewater. Due to the limitation of photocatalysis (low performance for MDEA degradation) and Fenton’s treatment (formation of slugde during the process and applicable only in the low pH), Arrif et al. in 2010 [10] used UV/H2O2 process to treat
monoethanolamine (MEA) in water solution, and a successful degradation was reported. The UV/H2O2 has many advantages such as no formation of sludge during
Based on these advantages, in this present research the UV/H2O2 technique is
proposed to treat MDEA in water solution. MDEA is commonly chosen as the scrubbing agent since this alkanolamine can be used for the absorption and stripping of hydrogen sulfide (H2S) and carbon dioxide (CO2) and also can be used to remove
carbonyl sulfide (COS) [2]. Even though MDEA is widely used as the scrubbing agent during sweetening process of acidic gas from natural gas, the study pertaining to the degradation of MDEA present in effluents are highly limited.
1.2 Problem Statement
High concentration of alkanolamine in wastewater will be generated during maintaining and cleaning as well as scheduled inspection of absorption and desorption columns of natural gas sweetening plant. The wastewater produced is toxic to the environment and cannot be treated via the conventional wastewater treatment. One of the alternative techniques in advanced oxidation processes (AOP’s), Fenton’s treatment, has been studied to degrade the alkanolamine wastewater. However, the
limitation of Fenton’s treatment has inspired to look for an alternative technique which displays better performance and advantages such as no sludge formation during the treatment, applicable for a wide range of pH, and high capability of a hydroxyl radical (HO•) production, which has been identified as an important species in the
AOP’s. UV/H2O2 is one of the methods in the AOP’s, which is expected to meet the
required criteria, for better performance.
In this context, the present research has been undertaken to experimentally investigate the degradability of MDEA using UV/H2O2. Simulated waste and real
effluent from Petronas Penapisan Melaka Sdn. Bhd. (PPMSB) were used in this study. Effects of different process parameters such as the initial concentration of the wastewater, the initial H2O2 dosage, pH, intensity of UV light, and temperature will
is an electric-energy-intensive process and the electric energy can represent major consumption cost, then the evaluation of electrical energy demand is also required.
In order to evaluate the advantage of the hybrid strategy of the combined AOP using UV/H2O2 and biological oxidation, a biodegradability test of the partially
degraded wastewater as well as untreated wastewater will be investigated following the standard procedure and using locally available activated sludge.
1.3 Objectives
The objectives of the present work are detailed as follows:
1. To study the degradation characteristics of MDEA contaminated wastewater using UV/H2O2 advanced oxidation process and to identify the
optimum conditions for the process, for both simulated solution and actual effluents from refinery.
2. To identify the formation of intermediate products during the degradation process and to establish the reaction mechanism, the rate equation, kinetic constants for the mineralization process.
3. To study the effect of bicarbonate on the degradation of MDEA using UV/H2O2.
4. To study the biodegradability of the partially degraded wastewater and to estimate the electrical energy efficiency of UV/H2O2 process for the
degradation of MDEA.
1.4 Scope of the Present Research
Experiments will be conducted to study the individual effect namely intensity of UV radiation, initial concentration of MDEA/H2O2, initial pH, and temperature on the
UV/H2O2 oxidation process and based on these results, the effect of individual
parameters and also along with their combination effect will be identified using response surface methodology (RSM) and the optimum conditions will be estimated.
The intermediate products formed, if any, during the mineralization of MDEA, will be identified for proposing the mineralization mechanism. Meanwhile, by using the TOC profile that will be established, the kinetic parameters and the rate constants for MDEA mineralization will be estimated.
Since the presence of bicarbonate in the UV/H2O2 oxidation system affects the
rate and the efficiency of the process, an attempt will be made to study the effect of bicarbonate (at different concentration levels and different initial pH condition) on the UV/H2O2 process.
Biodegradability test will be conducted on the partially degraded MDEA solution, and in order to prove the efficiency of the present process, electrical energy demand of the UV/H2O2 process will be estimated.
1.5 Organization of Thesis
This thesis consists of five chapters:
Chapter 1 provides an overview about the background of the research related to generation of wastewater from sweetening process of natural gas treatment plant, problem statement, objective, and scope of the present research.
Chapter 2 describes a detailed literature review on various advance oxidation
process, with an emphasis on UV/H2O2 process. It also presents a detailed
merits and demerits of the available process for wastewater treatment.
Chapter 4 deals with the report on the results obtained in the present research along with a detailed discussion with a view to optimize the parameters involved in the process. The development of kinetic model, the estimating of reaction rate constants, and the by-product identification for the proposal of mechanism etc are discussed in detail.
Chapter 5 gives a brief summary of the present research outcome along with
CHAPTER 2
LITERATURE REVIEW
2.1 Natural Gas Sweetening Process
Natural gas is one of the main energy sources in the world other than petroleum, coal, hydro-electricity, nuclear-electricity, geothermal, wind, solar, and biomass. It is one of the cleanest, safe, and most useful among all energy sources. The global consumption of natural gas grew by 7.4% in 2010, while the production of natural gas increased by 7.3% in 2010 as a cause of the increasing demand of this natural gas as reported in British Petroleum review [11]. Malaysia, one of the important natural gas producers in the world, produced around 2.3 trillion cubic feet of natural gas [12]. Methane (CH4) is the main hydrocarbon molecule found in the raw natural gas.
Acidic gases (i.e. carbon dioxide (CO2) and hydrogen sulfide (H2S)), mercaptans (e.g.
methanethiol (CH3SH) and ethanethiol (C2H5SH)), water vapor, nitrogen (N2) and
2.1.1 The Removal of Acidic Gas from Natural Gas
The common and most widely used gas purification processes can be classified into the following five categories [13, 16]:
1. Absorption using organic solvents.
2. Adsorption onto solid surfaces.
3. Application of membranes.
4. Chemical conversion to convert into another compound.
5. Cryogenic condensation.
Among the five common methods, the most important method for gas purification is the absorption using organic solvent. Alkanolamines such as monoethanolamine (MEA), diethanolamine (DEA), methyldiethanolamine (MDEA), and di-isopropanolamine (DIPA) are the most commonly used solvents for the absorption of acidic gases such as CO2 and H2S [13]. The capability of alkanolamine to absorb
acidic gas depends on the functional groups of alkanolamine (i.e hydroxyl group and amino group). The hydroxyl groups are capable of reducing the vapor pressure and increase the water solubility, whilst the amino group is capable to provide the alkalinity in water solution, that cause the acidic gas absorption.
Methyldiethanolamine (MDEA) is one of the common alkanolamine which is widely used in petrochemical industries. MDEA is used as an intermediate material in the synthesis of pharmaceutical products (e.g. analgesic and antispasmodic agent), personal care products (e.g. fabric softener and foaming agent on the shampoo), and the most importantly in gas processing plants [17]. The structural formula of MDEA is presented in Figure 2.1. MDEA has two ethanol functional groups and one methyl group. Those groups are attached to a nitrogen atom. Due to the existence of nitrogen atom with a pair of free electrons, MDEA forms weak base in aqueous solution, hence MDEA is often used for scrubbing/sweetening of acidic gases (CO2 and H2S) from
Figure 2. 1 Chemical Structure of MDEA
The acidic gas purification using MDEA solution occurs according to Reactions 2.1 – 2.6 [13, 19 − 20]:
Ionization of water:
H2O ↔ H+ + OH- (2.1)
Ionization of dissolved H2S:
H2S ↔ H+ + HS- (2.2)
Hydrolysis and ionization of dissolved CO2:
CO2 + H2O ↔ HCO3- + H+ (2.3)
Protonation of MDEA:
R2NCH3 + H+→ R2NCH4+ (2.4)
Acid-basic reaction with the amine:
R2NCH4+ + HCO3-↔ R2NCH3 + H2O + CO2 (2.5)
R2NCH4+ + HS-↔ R2NCH3 + H2S (2.6)
Figure 2. 2 Flow diagram of a typical amine treating process [13].
Acidic gases (such as CO2 and H2S) are absorbed in an absorber to produce a purified
gas as the product and a rich amine solution (i.e. an amine solution + dissolved CO2
and H2S). The rich amine is then routed into the regeneration unit (a stripper with a
reboiler) to produce a lean amine that is to be recycled. Further, the H2S-rich stripped
gas stream is then commonly routed into a Claus process to convert it into elemental sulfur, and the CO2 generated during desorption can be used for enhanced oil recovery
(EOR) [13].
2.1.2 Process Wastewater from Natural Gas Sweetening Operation
The general sources of the wastewater containing alkanolamine during the gas operation process come from valve leakage, operational upset and also from the cleaning of reclaimer, absorber, and plant equipments i.e. heat exchanger, pumps, and vessel [21]. A heat-stable salt, degraded alkanolamine, and solid impurities may also be generated as effluents along with alkanolamine. During the gas purification process, those impurities are generated in the reclaimer and absorber of the gas processing unit. These effluents consist of amine as main pollutant and require appropriate treatment before disposal, since this amine solution is not readily biodegradable and toxic to the environment.
The effluent from natural gas processing unit consists of raw alkanolamine solution (MDEA), heat-stable salts, degraded alkanolamime, and insoluble particles, etc. Hence, a preliminary treatment is also required before further treatment, such as treatment using advanced oxidation process (AOP).
2.2 Wastewater Treatment
2.2.1 Wastewater Regulation
Development and implementation of wastewater treatment is the answer for the concern for public health and unpleasant condition caused by the discharge of wastewater to the environment [22 – 23]. Removal of suspended and floatable material, treatment of biodegradable organics and other contaminants, as well as elimination of pathogenic organism are the basic principle of the water treatment process. USEPA (Water Pollution Control Act of 1972) established the standards for wastewater discharge. Secondary treatment such as removal of suspended solid and biodegradable organics, as well as disinfectant of municipal wastewater must be treated to meet the acceptable levels before releasing into the environment. USEPA
[image:32.595.95.471.485.687.2]and most of other countries’ regulation for water pollution insists the industries to use the best available technology to treat their wastewater before its disposal. The admissible maximum values of contaminants in the treated wastewater of different countries are regulated according to their own guidelines. The Malaysian standard for industrial effluents is presented in Table 2.1.
Table 2. 1 Malaysian effluent standard regulation for sewage and industrial effluents, Environmental Quality Act 1974 [Laws of Malaysia; (act 127) 1999] [24].
Parameters Unit Standard (A) Standard (B)
Temperature ˚C 40 40
pH value - 6.0 – 9.0 5.5– 9.0
BOD5 at β0˚C mg/L 20 50
COD mg/L 50 100
Suspended Solids mg/L 50 100
Phenol mg/L 0.001 1.0
Free chlorine mg/L 1.0 2.0
Sulphide mg/L 0.50 0.50
Ammoniacal Nitrogen mg/L 10 20
Some more stringent standards have been developed recently to deal with the removal of nutrients and the priority pollutants. When the wastewater is to be reused, standards normally include the requirements for the removal of refractory organic, heavy metals, and in some cases dissolved solids [22]. Hence, in order to achieve the regulation standard, the effluents from the industries have to be treated appropriately before discharging into the environment.
2.2.2 Wastewater Characteristics
Based on the constituents present in wastewater, it can be characterized as physical, chemical and biological. The physical characteristics mainly include the presence of suspended solids in the effluent, degree of turbidity, temperature, color, and odor. Whilst, the chemical characteristics may include the organic compounds (e.g. carbohydrates, phenol, pesticides), dissolved gases (e.g. hydrogen sulfide, methane, oxygen), and inorganics (e.g. alkalinity, heavy metals, nitrogenous substances, pH), etc. [22 – 23]. Organic impurities are the most common and important constituent in domestic and industrial wastewater. Quality of wastewater is determined by the characteristic of wastewater and commonly the organic impurities consist of the mixture of carbonaceous material (not specific). Therefore, the investigation of organic content in the wastewater is not an easy test. The most commonly used tests are the total organic carbon (TOC), chemical oxygen demand (COD), and biochemical oxygen demand (BOD5) [25]. The biological characteristics include the
Natural gas sweetening process will generate high concentration of amine in wastewater and the concentration of amine may reach as high as 15 – 50 % by weight in practice [13]. Hence, the wastewater from the gas processing unit needs to be treated before discharging into the environment [26 – 27].
Figure 2. 3 Constituent of wastewater.
2.2.3 Wastewater Treatment Methods
organic contaminants are changed into gases that can escape into atmosphere or into the biological cell tissue, which can be removed by settling [22].
2.2.4 The Hybrid Process of Advanced Oxidation followed by Biological Treatment
Effluents/wastewater with high concentration of alkanolamine will be generated and leaving the natural gas processing unit and these effluents are often toxic to the bacteria and hence can not be degraded by biological oxidation. Advanced oxidation process is recently chosen by many researchers to treat recalcitrant organic
contaminants in the effluent. Fenton’s treatment, UV/H2O2 treatment, and UV/O3
[image:35.595.155.480.457.691.2]treatment are commonly used to degrade the recalcitrant organic contaminant into smaller fragments, which are biodegradable. In order to achieve a complete degradation of recalcitrant organic contaminant, by coupling of chemical oxidation (as pre-treatment) and biological oxidation (as post-treatment) is conceptually beneficial to increase the overall treatment efficiency [28 – 30], as illustrated in Figure 2.4.
2.3 Advanced Oxidation Processes
In wastewater treatment methods, AOP’s are relatively a novel chemical process which involves the generation of hydroxyl radical. The hydroxyl radical is well known as a very reactive oxidant that is capable of degrading a wide range of organic contaminants. Generation of hydroxyl radical in the AOP’s including UV irradiation [either direct irradiation of contaminant or photolytic oxidation mediated by hydrogen peroxide (UV/H2O2) and/or ozone (UV/O3)], heterogeneous photo catalysis using
semi conductor catalysts (UV/TiO2), electron beam irradiation, X-ray, -ray
radiolysis, non-thermal electrical discharge, and ultrasonic irradiation [29]. Generation of hydroxyl radical using different techniques is shown in Figure 2.5.
Figure 2. 5 Generation of hydroxyl radicals using different techniques [30].
The AOP’s can be a chemical, catalytic, photochemical, photo catalytic, mechanical, and electrical process (Figure 2.5). The chemical and catalytic processes involve the application of ozone/or hydrogen peroxide. Moreover, the catalytic processes (Fenton type processes) involve the usage of some powerful catalyst (iron or copper ion) in combination with hydrogen peroxide to produce hydroxyl radical. UV and solar irradiation are commonly used in the photochemical and photo catalytic processes in combination with some powerful oxidants (ozone and/or hydrogen peroxide) or photo catalyst (e.g. TiO2, ZnO, etc). Generation of hydroxyl radicals can
electrical energy (e.g. electro hydraulic discharge and non thermal plasma processes) [30]. Table 2.2 gives the list of some oxidant species. The redox potential of hydroxyl radical is in the second place after fluorine.
Table 2. 2 Redox potential standards of some oxidant species [30].
Oxidant Redox Potential, E˚, V
Fluorine 3.03
Hydroxyl radical 2.80
Atomic oxygen 2.42
Ozone 2.07
Hydrogen peroxide 1.77
Permanganate ion 1.67
Chlorine 1.36
Chlorine dioxide 1.27
AOP’s are the promising chemical processes for the treatment of toxic organic pollutants in aqueous solution. Degradation of the toxic organic pollutants in the
AOP’s involve a highly reactive species i.e. hydroxyl radical. The hydroxyl radical is
a non selective oxidant, hence capable to oxidize any organic contaminant. The reported chemical species that are oxidized by hydroxyl radical are listed in Table 2.3.
Table 2. 3 Sample of chemical species oxidizable by hydroxyl radicals [30].
Group Details
Acids: formic, gluconic, lactic, malic, propionic, tartaric.
Alcohols: benzyl, tert-butyl, ethanol, ethylene glycol, glycerol, isopropanol, methanol, propenediol
Aldehydes: acetaldehyde, benzaldehyde, formaldehyde, glyoxal, isobutyraldehyde, tricholraldehyde
Aromates: benzene, chlorobenzene, chlorophenol, PCBs, phenol, catecol, benzoquinone, hydroquinone, p-nitrophenol, toluene, xylene, trinitrotoluene
Amines: aniline, cyclic amines, diethylamine, dimethylformine, EDTA, propanediamine, n -propylamine
Dyes: azo, anthraquinone, triphenylmethane Ethers: tetrahydrofuran
Simple organic acids such as acetic, maleic, and oxalic acid and also acetone, chloroform, and tetrachloroethane can not be readily oxidized by hydroxyl radicals [30].
2.3.1 The Reaction Mechanism of Hydroxyl Radical toward Organic Contaminant in Wastewater
The general reaction mechanism of hydroxyl radical toward organic contaminant in wastewater follows three pathways i.e. hydrogen abstraction, electrophilic addition, and electron transfer reaction [31 – 32]. Most commonly, the hydrogen abstraction is the first dominant step during the hydroxyl radical reactions toward the organic matter (Equation 2.7). The hydroxyl radical will take one hydrogen atom from the active site of organic matter to form one molecule of water (H2O) [31].
O H RH
RH2 2 (2.7)
The second pathway of hydroxyl radical reaction toward the organic contaminant is the electrophilic addition. In this step, the hydroxyl radical will attack the organic π -bond system (such as double -bond system) to form an intermediate product [33]. Illustration of electrophilic addition by hydroxyl radical is shown below (Equation 2.8):
The third pathway is known as electron transfer reactions. This mechanism generally occurs when the hydroxyl radical react with a halogenated organic contaminant. The hydroxyl radical will be reduced to form OH- [31] as shown below (Equation 2.9):
O OH RX
RX - (2.9)
2.3.2 Fenton’s Process
Over a hundred years ago (during 1894), the technology of Fenton’s process was first introduced when M.J.H. Fenton reported the application of ferrous ion for the enhanced oxidation of tartaric acid with aqueous hydrogen peroxide. Further, oxidation based on ferrous-catalyzed by H2O2 at the acidic pH is known as Fenton’s
oxidation [29] and the reagent (i.e. combination between Ferrous ion (Fe2+) and hydrogen peroxide (H2O2)) is known as Fenton’s reagent. After 40 years of the Fenton’s process was found, hydroxyl radical was proposed by Haber and Weiss as
the oxidant species in the Fenton’s system. Hydroxyl radical plays an important role in the degradation of pollutants by Fenton oxidation and the capability of the treatment generally depends on the concentration of hydroxyl radical in the system. The generation of hydroxyl radical by Fenton’s reagent as reported by Walling [5] is shown in Equation 2.10.
Fe2+ + H2O2→ Fe3+ + OH- + HO• k = 76.5 M-1s-1 (2.10)
Effectiveness of Fenton’s treatment to treat many recalcitrant organic pollutants
has been reported by many researchers. Degradation of amoxicillin, (which is a common antibiotic that is widely used with high probability of releasing into the environment) was successfully carried out by Homem et al. [35]. From the initial amoxicillin concentration of 450 µg/L, after 30 minutes of reaction time, the concentration reduction was reported as 54%. Biodegradability of pharmaceutical wastewater and hospital wastewater were increased by Fenton’s treatment as reported by Berto et al. [36], Jiang et al. [37], and Li et al. [38]. Badawy et al. [39] reported that even though the biodegradability of the pharmaceutical wastewater did not increase, but the contaminant level was reduced. Lodha and Chaudhari [40] successfully decolorized and reduced the COD levels until approximately 70% from wastewater containing Azo dyes within 30 minutes of reaction time. Boonrattanakij et al. [41] and Ramli [42] reported that the continuous addition of Fenton’s reagent was more effective to reduce the level of contaminant in the wastewater and also they proposed that the reaction inhibition during the treatment could be reduced because of the controllable hydroxyl radical production. Fenton’s treatment was also applied for the degradation of alkanolamines (monoethanolamine [43], diethanolamine [7], and diisopropanolamine [44]) that are commonly present in the refinery wastewater. Zhang and Yang [9] treated the refinery wastewater obtained from Shengli refinery of
SINOPEC Qilu Petrochemical Company, China. The effect of inorganic ions on
Table 2. 4 Literature review on Fenton processes, Fenton like processes and photo-Fenton processes for various types of pollutants.
Contaminant/ References
Experimental Results
Fenton’s
type Reactor Feeding reagent
pH Conc. Temp. (⁰C)
Azo dyes
Lodha & Chaudhari, 2007 [40]
Fenton’s reagent,
Batch reactor Cap = 1 L
_ 2.0 – 7.0 _ Room temp. The reported optimum pH was 3 and the degradation was increased by increasing H2O2 and Fe2+ dose, up to
the critical dose. Complete decolorization was achieved and approximately 70% of COD was removed at 30 minutes of reaction time.
Hospital wastewater after biological treatment
Berto et al., 2009 [36]
Fenton’s reagent
Batch reactor Cap = 500 ml
_ 3.8 _ Room temp. Using Fenton’s treatment, the COD decreased up to 90.6%.
Monoethanolamine (MEA)
Harimurti, 2009 [43]
Fenton’s reagent
Batch jacketed glass reactor Cap = 1 L
_ 2.0 - 5.0 [MEA] = 0.013 - 0.213 M [H2O2] =
0.708 - 2.123 M [Fe2+] =
0.014 - 0.058 M
Room temp. Optimum condition for degradation of [MEA]0 = 0.213 M was pH = 3, [H2O2]
= 2.123 M and [Fe2+] = 0.029 M. The
maximum COD reduction was + 55%. This treatment has also increased the biodegradability.
2,6-dimethyl-aniline
Boonrattanakij et al., 2009 [41]
Fenton’s reagent
Batch reactor Cap = 0.5 L
_ 3.0±0.05 _ 25±0.2 Degradation rate of contaminant was better in the continuous system. Malic, lactic, oxalic and formic acid were identified as degradation products.
Refinery wastewater from Shengli refinery of SINOPEC Qilu Petrochemical Company
Zhang and Yang, 2009 [9] Fenton’s reagent Batch reactor (round-bottom flask)
Cap = 500 ml
_ ±3.0 n[Fe2+] : n[H 2O2]
= 1:3 - 1:20
30-50 The max. COD removal was achieved at pH = 2.5 – 3, n[Fe2+] : n[H
2O2] = 1:5
after 2 hours of reaction time. The treatment was found to be effective as pre-treatment before biological oxidation.
Biologically treated coking plant effluent
Jiang et al., 2009 [37].
Fenton’s reagent
Rotated drum bottle as reactor Cap = 40 ml
_ 3.0 – 10.0 [H2O2] =
5 – 40 mg/L [Fe2+] =
10 – 70 mg/L
_ > 50% COD was removed at optimum condition i.e. pH = 6, [H2O2] = 27.2
mg/L, [Fe2+] = 56 mg/L. The treated
effluents were more biodegradable compared to the un treated effluents.
Pharmaceutical wastewater from El-Nasr Pharmaceutical and Chemical Company, South-East of Cairo
Badawy et al., 2009 [39]
Fenton’s process
_ _ 3.0±0.2 [COD]0 =
4100 – 13,023 mg/L
Room temp. The application of Fenton treatment improved the removal efficiency However, it did not improve the biodegradability.
Amoxicillin
Homem et al., 2010 [35] Fenton’s reagent Batch with thermostatic reactor Cap = 250 ml
_ 2.9 - 6.5 [H2O2] =
0 – 4.50 mg/L [Fe2+] =
0 – 240 µg/L
22-57 The optimum condition was pH = 3.5, [H2O2] = 3.50 mg/L, [Fe2+] = 95 µg/L.
54% of amoxicillin was degraded after 30 min of reaction time from the initial concentration of 450 µg/L.
Diethanolamiene (DEA)
Dutta et al., 2010 [7]
Fenton’s reagent
Batch jacketed glass reactor Cap = 1 L
_ 1.0 – 4.0 [DEA] = 800 – 16000 ppm
[H2O2 30%] =
53.33 – 233.33 ml
[FeSO4,7H2O] =
4 – 16 gram
Room temp. Optimum condition for the oxidation of [DEA]0 = 16000 ppm was [H2O2
(30%)] = 175 ml, [FeSO4,7H2O] = 8
gram, pH = 2. Biodegradability of treated DEA was better compared to the un-treated DEA.
Natural gas plant wastewater contains Diisopropanolamine (DIPA)
Ramli, 2010 [42]
Fenton’ s reagent
Jacketed glass reactor Cap = 1 L
Continuous 2.0 – 5.0 [waste] ≈ 17000 mg/L COD
[H2O2]/[Fe2+] =
5 – 30
Room temp. As much as 73% of COD was removed at the optimum condition, i.e.
[H2O2]/[Fe2+] = 10, pH = 3 at room
temperature.
Phenol
Mingyu et al., 2011 [45]
Fenton’s reagent
Cone bottle reactor Cap = 250 ml
_ 3.0 [phenol] =
0.61 mmol/L
25 The presence of ferric ion (Fe3+)
enhanced the Fenton’s oxidation whereas phosphate, chloride, copper ion and carbonate were found to suppress the oxidation process.
Diisopropanolamine (DIPA)
Khamaruddin et al., 2011 [44]
Fenton’s Reagent
Jaketed glass reactor Cap = 2 L
_ 2.0 – 4.0 [DIPA]0 =
3000 ppm n[H2O2]/n[Fe2+]
= 95
30-60 It was reported that the highest degradation was obtained at 60 ⁰C and at pH = 2.5.
Acrylic fiber manufacturing wastewater
Li et al., 2012 [38]
Fenton’s reagent
Batch reactor _ 1.0 – 7.0 [waste] = 4528 mg/L [H2O2] =
100 – 800 mg/L [Fe2+] =
100 – 800 mg/L
25 The optimum oxidation condition for degradation of 4528 mg/L COD was [H2O2] = 500 mg/L, /[Fe2+] = 300
mg/L, pH = 3 with COD removal = 65.5% for 2 hours of reaction time and the biodegradability (BOD5/COD)
increased from 0.1 to 0.226.
2.3.3 Ozone-based Processes
Naturally, ozone (O3) is present in the atmospheric layer around the earth, and it is
formed by the recombination of atomic radical oxygen and diatomic oxygen. The atomic radical oxygen (O•) is commonly generated by the photolysis of diatomic oxygen (O2) and further reacts with the diatomic oxygen (O2) to form ozone (O3) [30 – 32]. The reaction of ozone formation can be expressed in Equation 2.11 – 2.12.
O2 + hυ→ βO • (2.11)
O• + O2→ O3 (2.12)
Ozone has a redox potential of 2.07 V, therefore ozone is very reactive either in the liquid or in gas. Reaction of ozone with organic contaminant can be considered either on direct or indirect reaction. Equation (2.13) show the direct mechanism which involves organic compound degradation by molecular ozone and occurs in acidic pH range.
O3 + 2H+ + 2e-→ O2 + H2O (2.13)
Hydroxyl radical is generated from the reaction of ozone and hydroxyl ions present in water (indirect ozone mechanism) at basic pH conditions (Equation 2.14). Further, the hydroxyl radical reacts with an organic compound present in water.
O3 + H2O + OH-→ HO• + O2 + HO2 • (2.14)
Based on the Equation (2.13) and (2.14), indirect mechanism of ozonization can also be classified as AOP’s. Meanwhile, direct mechanism of ozonization can be classified as classical chemical treatment method. Combination of O3/H2O2 has been
combination is well known as peroxone or perozonation [30, 46 – 47]. Overall mechanism of reaction can be expressed in Equation 2.15.
H2O2 + O3→ β HO • + 3O2 (2.15)
The O3/UV process and O3/H2O2 processhave been studied by Andreozzi et al. [48]
for the degradation of the mineral oil-contaminated wastewater, and they concluded that O3/UV process was more effective to reduce the COD values compared to the
O3/H2O2 process. Within 30 minutes of reaction time, around 80 – 90 % of COD
removal was achieved. The UV/O3 process was also used for acetone removal [49]
and improvement of drinking water quality in France [50]. Degradation of acetone using UV/O3 was the most effective compared to the other processes i.e. H2O2/O3 and
UV/H2O2. Almost complete degradation was achieved by this process within a short
duration (< 30 minutes) of oxidation time. This process was used for disinfection, oxidation of micro-pollutant, and minimization of bromate concentration in the drinking water for the improvement of the quality. Application of UV in drinking water production was also capable of reducing the ozone consumption. Ma and Graham [51] reported an enhancement in the degradation of atrazine by ozone, which was catalyzed by small amount of manganese (Mn2+). This enhancement was due to the oxidation of Mn2+ to Mn4+, that enhanced the generation of hydroxyl radical (HO•), which has a very high oxidation potential toward atrazine. Safarzadeh-Amiri [52] used the O3/H2O2 process to degrade methyl-ter-butyl ether (MTBE) and proved
that the operating cost of O3/H2O2 process was less compared to the UV/H2O2 process
for reducing the same amount of MTBE and resulted in the same amount of removal efficiency. Biodegradability of carbaryl (a pesticide) was enhanced using photocatalytic ozonization in the presence of TiO2 as reported by Rajeswari and
Kanmani [53]. It was also reported that the ratio of BOD5/COD increased up to 0.38.
Other than the report on the enhancement of biodegradability, they also reported a reduction of COD and TOC up to 92% and 76.5%, respectively, at the experimental concentration of carbaryl, ozon, and TiO2 are 40 mg/L, 0.28 g/h, and 1 g/L,
(i.e. atrazine (ATR), sulfamethoxazole (SMX), and N-nitrodimethylamine (NDMA)) were quite similar, even though the NDMA transformation was more effective using direct photolysis. Park et al. [55] used the combination of microwave/UV and ozone to degrade bromothymol blue in water solution, and reported a complete degradation of bromothymol blue within 10 minutes of reaction time. During ozone based process, phosphate and carbonate were found to be the scavenger of the degradation reaction for sulfamethoxazole using UV/TiO2/O3 [56]. The available literature on the ozone
based oxidation process for different pollutants are summarized in Table 2.5.
2.3.4 High Voltage Electrical Discharge Processes
High voltage electrical discharge (frequency of 60Hz) process is a process when a strong electrical field induced chemical and physical processes and commonly known as corona discharge. Application of electrical discharge (short high voltage pulse (200 – 100 ns)) in liquid phase and at non-thermal condition results in the formation of various active species such as HO•, H•, •O, HO2-, O2-•, H2O2, etc (Equation 2.16 – 2.18).
H2O + e-* → HO •+ H•+ e- (2.16)
H2O + e-* → H2O+ + 2 e-* (2.17)
H2O + H2O+→ H2O+ + HO• (2.18)
This process is very effective for treatment of biological microorganism and dissolved chemicals in liquid phase [30, 33]. The radical species present in the system usually react with each other and produce H2O2, H2 or H2O (Equations 2.19 – 2.21).
HO• + HO•→ H2O2 (2.19)
H• + H•→ H2 (2.20)
Table 2. 5 Ozone-based oxidation processes for various contaminants.
Contaminat/
References
Experimental Results
Reactor Lamp Conc. pH Temp.
Mineral oil-contaminated wastewater
Andreozzi et al., 2000 [48]
Semi-connector reactor
Cap = 0.2 – 1 L
17 W LP UV
= 254 nm
_ 4.9 (buffer
KH2PO4)
25⁰C O3/UV was proved to be more effective to
reduce the COD value compared to the O3/H2O2. Approximately 80 – 90 % COD
was removed within 30 minutes of reaction time.
Atrazine
Ma and Graham, 2000 [51]
Reactor & gas bubble-connecting column
Cap = 3.651 L
_ Mn2+ sol. = 24.8
ml/min
7.0 _ The presence of small amount of Mn2+ (0.3
– 1.2 mg/L) greatly enhanced the degradation of atrazine.
Methyl-ter-butyl ether (MTBE)
Safarzadeh-Amiri, 2001 [52]
Bubble column as reactor with
circulation of mixture 2 L/min Cap = 6 L
_ [MTBE]0 = 80 mg/L
[O3] = 150 mg/L
[H2O2] = 50 mg/L
_ _ The O3/H2O2 provides an economical and
efficient process for the reduction of MTBE-contaminated water. Nearly complete reduction of MTBE (80 to 0.05 mg/L) was achieved by using 150 mg/L ozone and 50 mg/L H2O2.
Acetone
Hernandez et al., 2002 [49]
Glass borosilicate reactor
Cap = 1 L
LPUV & MPUV
Ozone inlet = 35 /weight
[aceton] = 5 ppm
7.0 (borate buffer)
20 ⁰C LPUV/O3 was reported as more effective
for acetone degradation among UV/O3,
H2O2/O3, and UV/H2O2. Acetone removal
was > 99% within 30min of reaction time. Increasing O3 concentration increased the
degradation rate.
Pretreated drinking water from Paris area (France)
Meunier el al, 2006 [50]
Brown glass screwed with dispenser fitted for ozone injection Cap = 500 ml
UV at = 254 nm.
_ 8.0 6±1ºC
& 25±1ºC
Introducing UV in the system reduced the ozone dosege and the combination of UV/O3 improved the water quality with
regard to disinfection, oxidation of micro-pollutant and minimization of bromate concentration.
Carbaryl (Carbamat pestiside)
Rajeswari and Kanmani, 2009 [53]
Cilinder photoreactor Cap = 500 ml
125 W MP UV lamp
[carbaryl]o = 40 g/L O3 input = 0.28 g/h
[TiO2] = 5 g
_ 19±1⁰C By this process, 92% COD and 76.5% TOC were removed and the ratio of BOD5/COD
increased to 0.38.
Sulfamethoxazole (SMT)
Beltrán et al., 2009 [56]
Tubular borosilicate glass Cap = 1 L
HP Hg lamp [O3] = 10-30 mg/L _ _ The degradation of sulfamethoxazole was
caused by direct ozonenolysis, direct photolysis, and HO•. Phosphate and carbonate was found to be the scavengers.
Bromothymol Blue (BTB)
Park et al., 2010 [55]
Quartz reactor with Microwave = 2.45 Hz max power 1 kW circulation = 300 cc/min.
Cap = 1L
UV-C O3 = 0.75 – 3.26 g/h
[BTB]0 = 3.0 x 10⁻⁵
M
_ _ Decomposition rate of BTB increased significantly with increasing of catalyst dosage, microwave intensity when applied together with ozone. Complete degradation was achieved when 3.26 g/h of O3 was
injected in the UV/MW/TiO2 system.
Micropollutants i.e.: Atrazine,(ATR), sulfametoxazole (SMX) and N-nitrosodimethylamine (NDMA)
Katsoyiannis et al., 2011 [54]
Batch reactor Cap = 500 ml
15 W LP Hg lamp
[pollutant]0 = 0.5 – 1
µM [O3]0 = 1.5 mM
[H2O2]0/ [O3]0 = 1:2
8.0 20 ⁰C Transformation rate of micropollutants increased with the use of O3/H2O2. Energy
requirement for O3/H2O2 and UV/H2O2 is
quite similar for the NDMA transformation.
Based on the reactions according to Equations 2.16 – 2.21, the degradation of organic contaminant in the system follow three mechanisms i.e. direct reaction with hydroxyl radical, indirect reaction of radicals formed from stable molecules (H2O2),
and direct reaction with stable molecule [57].
2.3.5 Others AOP’s
There are many other types of promising AOP’s are introduced recently. Those are ultrasonic irradiation, radiolysis of water, and electrochemical processes. These processes also involve the radical species to degrade the organic pollutant in the system, which are generated by ultrasonic wave, radio wave, and direct electron transfer, and the details are discussed below:
2.3.5.1 Ultrasonic Irradiation
The frequency of ultrasonic wave that is used in this process ranges from 20 – 40 kHz. Irradiation of ultrasonic wave into the water generate a highly reactive hydroxyl radical (HO•) and H• (Equation 2.22).
H2O + ultrasound→ HO• + H• (2.22)
During the degradation of organic pollutant, the reactive radicals react with the organic contaminant in the system through oxidation or reduction [33, 57].
2.3.5.2 Water Radiolysis
and ionization of water, which further produce reactive radicals, and degrade the organic contaminants present in water [33, 57].
2.3.5.3 Electrochemical Processes
Electrochemical processes are a kind of oxidation-reduction reaction in which one atom or molecule loses an electron to another atom or molecule. During the degradation of organic pollutant, the reaction occurs by the electron transfer reaction of oxidation-reduction or by chemical reaction. General electrolysis of organic matter by electron transfer is shown in Equation 2.23 [33].
RH + electrolysis→R • + H+ + e- (2.23)
2.3.6 AOP’s based on Ultraviolet Light
UV light was firstly investigated by Isaac Newton during the early 19th century and he observed the diffraction of white beam when passing through a prism. Infrared and ultraviolet was discovered beyond two ends of spectra of visible light. The light irradiation is later characterized as irradiation with visible (VIS), infrared (IR) or ultraviolet (UV). These three have same characteristics of electromagnetic irradiation, but differed in respect of its frequency. Correlation between electromagnetic energy and frequency (Equation 2.24) is known as Plank relation or Plank-Einstein equation:
hc hv
E (2.24)
Higher electromagnetic energy will occur at short wavelengths [32]. The radiation type and pertaining energy at specific wavelength are presented in Table 2.6, while the range of electromagnetic wave is presented in Figure 2.6.
Table 2. 6 Radiation type and pertaining energy levels [31].
Radiation Wavelength (nm) Energy range (kJ Einstein-1)
IC >780 <155
VIS 780 – 400 155 – 300
UV-A 400 – 315 300 – 377
UV-B 315 – 280 377 – 425
UV-C 280 – 100 425 – 1198
Figure 2. 6 Range of electromagnetic waves [31].
All processes involving UV light for the degradation of organic contaminant or for initiation of oxidation mechanism by irradiation of some powerful oxidant or photocatalyst are considered as UV-based processes. These UV-based processes can be grouped into three categories i.e. UV photolysis, photochemical processes, and photocatalytic processes.
2.3.6.1 UV Photolysis
Most of the molecules have lowest-energy electronic state at room temperature. This
condition is called as “ground state”. During the exposure of UV irradiation, the
molecules are excited to a higher energy level and called as “excited state”. Lifetime of excited molecules is very short (10-9 – 10-8 s). Further, the molecule returns to the ground state or decompose to produce different molecules. Direct photolysis of molecules by UV irradiation is expressed in Equation 2.25 – 2.27 [31 – 32, 58].
M + hυ→ M* (2.25)
M* → M (2.26)
M* → Product (2.27)
In order to achieve an efficient process for the degradation of organic contaminant, commonly UV light is combined with some powerful oxidant or
![Figure 2. 2 Flow diagram of a typical amine treating process [13].](https://thumb-ap.123doks.com/thumbv2/123dok/417531.526222/30.595.86.470.82.363/figure-flow-diagram-typical-amine-treating-process.webp)
![Table 2. 1 Malaysian effluent standard regulation for sewage and industrial effluents, Environmental Quality Act 1974 [Laws of Malaysia; (act 127) 1999] [24]](https://thumb-ap.123doks.com/thumbv2/123dok/417531.526222/32.595.95.471.485.687/malaysian-effluent-standard-regulation-industrial-effluents-environmental-malaysia.webp)
![Table 2. 2 Redox potential standards of some oxidant species [30].](https://thumb-ap.123doks.com/thumbv2/123dok/417531.526222/37.595.110.528.510.734/table-redox-potential-standards-oxidant-species.webp)

![Figure 4. 1 Individual effect of UV, H2O2, and the combination of UV/H2O2 on MDEA degradation ([MDEA]0 = 1000 ppm TOC; [H2O2]0 = 0.12 M; pH = 7; Temperature = 30 ⁰C;UV intensity = 12.06 mW/cm2)](https://thumb-ap.123doks.com/thumbv2/123dok/417531.526222/94.595.116.446.409.667/figure-individual-effect-combination-degradation-mdea-temperature-intensity.webp)
![Figure 4. 2 Individual effect of UV, H2O2, and the combination of UV/H2O2 on the MDEA mineralization ([MDEA]0 = 1000 ppm TOC; [H2O2]0 = 0.12 M; pH = 7; Temperature = 30 ⁰C;UV intensity = 12.06 mW/cm2)](https://thumb-ap.123doks.com/thumbv2/123dok/417531.526222/95.595.154.475.230.491/figure-individual-effect-combination-mineralization-mdea-temperature-intensity.webp)