ISSN: 1693-6930
accredited by DGHE (DIKTI), Decree No: 51/Dikti/Kep/2010 359
Optimization and Feasibility Analysis of Satellite
Earth Station Power System Using Homer
Hanaa T. El-Madany1*, Faten H. Fahmy1, Ninet M. A. El-Rahman1, Hassen T. Dorrah2
1Electronics Research Institute, National Research Center Building, Cairo, Egypt
2
Electrical Power & Machines Dept., Cairo University, Egypt e-mail: [email protected]*
Abstrak
Stasiun satelit bumi yang terletak di daerah terpencil adalah salah satu dari banyak aplikasi yang didukung oleh sumber energi terbarukan. Sistem bumi untuk satelit terdiri dari stasiun bumi dan pusat-pusat kendali yang bekerja sama untuk mendukung satelit dan pengguna data. Stasiun bumi terdiri dari subsistem utama, pemancar, penerima, antena, peralatan pelacakan, peralatan antarmuka terestrial dan catu daya. Subsistem daya adalah bagian penting yang dibutuhkan untuk memasok stasiun bumi dengan daya listrik untuk terus berkomunikasi dengan satelit-nya. Makalah ini membahas simulasi dan penentuan ukuran optimal dari sistem daya stasiun bumi menggunakan software HOMER. Kombinasi dua sumber energi (surya dan angin) untuk menyediakan produksi tenaga listrik terus-menerus digunakan untuk menentukan operasi sistem yang optimal. Terdapat tiga konfigurasi sistem yang dibandingkan dalam hal net present cost (NPC) and levelized cost of energy (COE). Juga, sebuah studi secara ekonomis akan dianalisis dalam aspek permintaan energi dan analisis sensitifitas akan dilakukan.
Kata kunci: daerah terpencil, HOMER, photovoltaic, stasiun bumi, ukuran optimal
Abstract
Satellite earth stations which located in remote areas are one of many applications powered by the renewable energy sources. Ground system consists of ground station and control centers working together to support the spacecraft and the data user. Earth station consists of major subsystems, transmitter, receiver, antenna, tracking equipment, terrestrial interface equipment and power supply. Power subsystem is an important part that required for supplying the earth station with electrical power to continue communicating with its remote sensing satellite. This paper deals with simulation and optimal sizing of earth station power system using HOMER software. A combination of two energy sources (solar, and wind) to provide a continuous electric power production is used to determine the optimum system operation. Three system configurations are compared with respect to the total net present cost (NPC) and levelized cost of energy (COE). Also, economical study will be analyzed for energy demand and sensitivity analysis will be performed.
Keywords: earth station, HOMER, optimal sizing, photovoltaic, remote area
1. Introduction
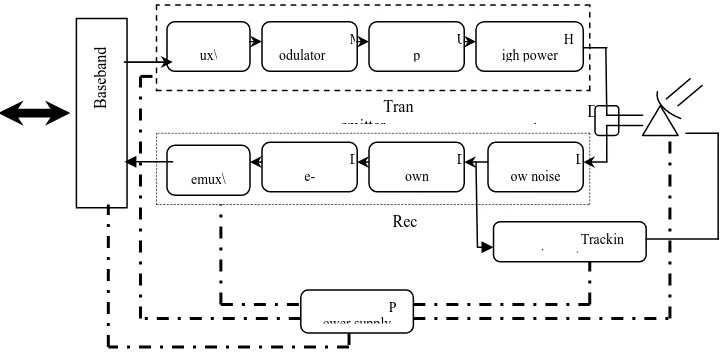
Terrestrial solar photovoltaic (PV) systems are presently economical for many remote applications, where the cost of other alternatives, such as extending utility power lines or transporting fuel, are very high. Telecommunication is one of several applications of renewable energy in remote areas. The functional elements of an earth station are shown in Figure 1 [1]. The earth station consists of four major subsystems, transmitter, receiver, antenna, and tracking equipment [2]. Two other important subsystems are terrestrial interface equipment and power supply. These components do not significantly change with the type of spacecraft being controlled, and therefore applies to several applications such as earth observation, remote sensing, and telecommunications. It is also applicable to low earth orbits as it is to geostationary orbits or interplanetary orbits. Power system is required for supplying all mentioned subsystems with electrical power demand.
2. Research Method 2.1. Site Selection
The procedure to determine where the earth station is to be installed is generally known as the site selection process. Although a set of "rules" for site selection has not been adopted, there are certain guidelines that are generally adhered to in selecting the most appropriate site. The ground should be capable of bearing the load of the earth station antenna and building. This is of particular concern for the larger and heavier antenna structures.
Radio frequency interference must be minimized between the earth station and other telecommunication service. Most receiving earth stations that are found in rural and remote areas require an environmentally clean power supply. At the same time, the electrical load of the receiving earth station is critical and requires a continuously power supply. From this point of view, it is important to introduce a model for a receiving earth station powered by using photovoltaic system. Aswan was selected as the site under consideration because it enjoys very high level of solar radiation. Aswan is located at Latitude 24o 04' north and Longitude 32o 57' east [3].
Figure 1. General configuration of an earth station
2.2. Power System Implementation Using Homer
HOMER is a computer program that simplifies the task of evaluating design options for both off-grid (stand-alone, and hybrid) system and distributed generation (DG) applications [4]. It has been developed by United State (US) National Renewable Energy Laboratory (NREL) since 1993. It is developed specifically to meet the needs of renewable energy industry’s system analysis and optimization.
There are three main tasks that can be performed by HOMER: simulation, optimization and sensitivity analysis. In the simulation process, HOMER models a system and determines its technical feasibility and life cycle. In the optimization process, HOMER performs simulation on different system configurations to come out with the optimal selection. In the sensitivity analysis process, HOMER performs multiple optimizations under a range of inputs to account for uncertainty in the model inputs.
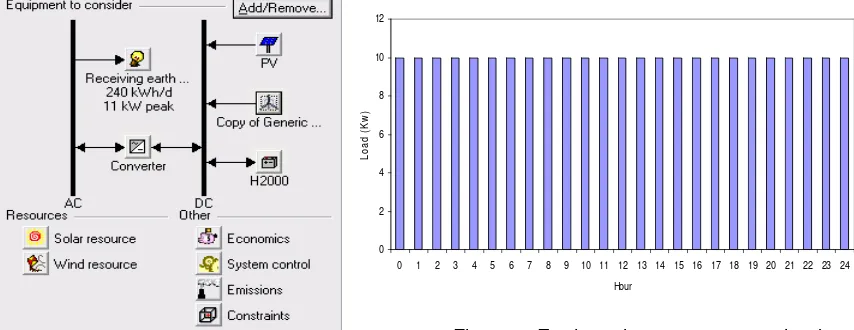
HOMER has been used as the sizing and optimization software tool for the receiving earth station power system. The power system consists of a renewable energy sources (solar energy, and wind turbine), batteries for energy storage and power inverter to maintain the flow of energy between the AC and DC sides. Figure 2 shows the proposed scheme as implemented in the HOMER simulation tool.
2.3. Economic Criteria Based on LCC Concept
The economical approach, according to the concept of Life Cycle Cost (LCC), is developed to be the best indicator of economic profitability of system cost analysis in this study. The LCC method of economic analysis calculates a system's total cost over its useful life. This
sers
B
as
eb
an
d
eq
u
ip
m
en
t
ux\
M odulator
U p
H igh power
L ow noise D
own D
e-emux\
Trackin g equipment
D uplexer Tran
smitter
Rec eiver
method takes into account the initial (capital) and all other costs required for the system to operate properly over its life [5]. Four main parts are considered: PV array, wind turbine, battery bank, and the inverter. According to the studied system, LCC takes into account the initial capital cost (CIC), the present value of replacement cost (Crep ), the present value of operation
and maintenance cost (CO&M ), the salvage value (Sal). Thus, LCC may be expressed as follows
[6- 8]: Sal C C C ($)
LCC = IC+ rep+ o&M − (1)
a. The Initial Capital Cost
The initial capital cost of each system component consists of the component price, including systems design and installation costs. This is a one-time payment at the start of a project. Then the initial capital cost for the PV/wind/battery system, (CIC) is given by [9, 10]:
)
C
*
(P
)
C
*
(C
)
C
*
(P
)
C
*
(P
C
iinv inv ibat bt iw w iPV PV IC+
+
+
=
(2)where (PPV, Cipv) are the total capacity (kW) and unit cost ($/kW) of PV array respectively; (Pw,
Ciw) are the total capacity (kW) and unit cost ($/kW) of wind turbine respectively; (Cbt, Cibat) are
the total capacity (kWh) and unit cost ($/kWh) of the battery bank respectively; and (Pinv, Ciinv )
are the nominal capacity (kW) and unit cost ($/kW) of the inverter respectively.
b. The Replacement Cost
Replacement costs present value reflects major repairs and equipment replacements which occur when the normal duty life of any system components is shorter than the life expectancy of the entire system. As the life period of battery bank and inverter are shorter than PV system; the replacement cost of the wind turbine, the batteries and the inverter have to be included in the cost analysis of the power system [11-14].
The wind turbine will be purchased after 15 years. Therefore, the replacement cost of wind turbine can be calculated from:
i)
(1
1
.
.C
P
C
repw w repw 15
+
=
(3)The group of battery bank will be purchased (after N = 5, 10, 15, and 20 years). Therefore, the replacement cost of battery bank can be calculated from:
i)
(1
1
i)
(1
1
i)
(1
1
i)
(1
1
.
.C
C
C
repb bt repbat 5 10 15 20
+
+
+
+
+
+
+
=
(4)The inverter will be replaced after 15 years, so the replacement cost of inverter can be evaluated as follows:
i)
(1
1
.
C
.
P
C
repinv inv repinv 15
+
=
(5)The present value of total replacement cost (Crep) can be determined as follows:
repinv repb
repw repPV
rep
C
C
C
C
C
=
+
+
+
(6)where Crep is the total system replacement cost, (CrepPV , Crepw) are the replacement cost of PV
array ($) and the replacement cost of wind turbine ($) respectively, (Crepbat , Crepinv) are the unit
Figure 2. HOMER implementation of power system
Figure 3. Earth station power system load profile
c. The Operation and Maintenance Cost
In its general form, the present worth factor of operation and maintenance (PWFO&M)
and the present value of operation and maintenance cost of the PV/wind/battery system (CO&M)
are expressed as [15]:
i)
(1
i
1
i)
(1
PWF
N N M & O
+
−
+
=
(7))
PWF
.
C
.
(P
)
.PWF
.C
C
(
)
PWF
.
C
.
P
(
C
C
M & O Minv & O inv M & O Mbat & O bt M & o Mw & o w MPV & O M & O+
+
+
=
(8)where (CO&MPV , CO&Mw, CO&Mbat, and CO&Minv) are the operation and maintenance cost of PV,
wind turbine, battery bank and inverter respectively, and N is the system lifetime.
d. Salvage Value
Salvage present value or the recovery value of the equipment is the net value of the equipment used at the end of the system's service life. The salvage or the residual value of components is based on the possibilities of alternative uses at the end of the project lifetime. In this analysis a salvage value can be calculated as follows [16]:
comp rem rep
R
R
.
C
Sal
=
(9)Rrem, the remaining life of the component at the end of the project lifetime, is given by:
]
R
N
[
R
R
rem=
comp−
−
rep (10)Rrep, the replacement cost duration, is given by:
= comp comp rep R N INT . R
R (11)
where Crep, Rcomp, and Rproj are replacement cost ($), component lifetime (yr), and project
lifetime (yr) respectively.
0 2 4 6 8 10 12
2.4. Electrical Load Input Details
The load details are inputs to the HOMER simulations. The load inputs describe the electric demand that the system must serve. The earth station power system load profile indicated in Figure 3.
2.5. Resources
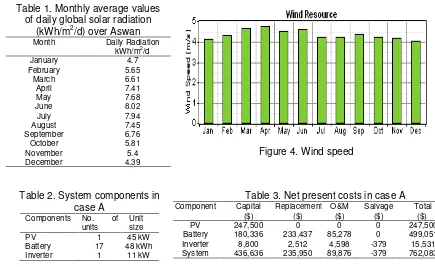
Monthly average data of global solar radiation in Aswan are described in Table 1 [4]. As shown in Table I, the solar radiation data for the selected remote area are obtained to be in the range between 8.02 kWh/m2/d (in June) and 4.39 kWh/m2/d (in December). The scaled annual average of the solar radiation is estimated to be 6.49 kWh/m2/d.
The HOMER software can generate the clearness index from the solar radiation data according to the latitude of the place has been chosen. If the solar radiation data is not available, clearness index can also be used to generate the solar radiation data. Therefore, either the clearness index or the solar radiation data can be used to represent the solar resource input, as long as the data of latitude is available to the HOMER software.
Also, the wind speed is indicated in Figure 4. It is cleared from Figure 4 that the most year months have wind speed values ranging from 4 m/s to 4.77 m/s.
3. Simulation Results and Discussion
Three power systems configurations using different energy storage technologies, namely, PV/battery system, wind/battery system, and PV/wind/battery system are simulated in HOMER environment for optimal sizing which minimizes the system cost.
The simulation results provide comparison among these configurations. Simulation studies are classified as: Case A (PV/battery system), Case B (PV/wind/battery system), and Case C (wind/battery system).
Table 1. Monthly average values of daily global solar radiation
(kWh/m2/d) over Aswan
Daily Radiation kWh/m2/d Month
4.7 January
5.65 February
6.61 March
7.41 April
7.68 May
8.02 June
7.94 July
7.45 August
6.76 September
5.81 October
5.4 November
4.39 December
Figure 4. Wind speed
Table 2. System components in case A
Components No. of units
Unit size
PV 1 45 kW
Battery 17 48 kWh
Inverter 1 11 kW
Table 3. Net present costs in case A
Component Capital ($)
Replacement ($)
O&M ($)
Salvage ($)
Total ( $ )
PV 247,500 0 0 0 247,500
Battery 180,336 233,437 85,278 0 499,051
Inverter 8,800 2,512 4,598 -379 15,531
System 436,636 235,950 89,876 -379 762,083
3.1. Case A: PV/Battery Power System
Table 2 shows the optimal unit size and number of units of each component in the system. Total net present cost (comprise of capital, replacement, O&M and salvage) of the PV stand alone system and its each component is illustrated in Table 3. The levelized cost of energy (COE) for Case A is equal to 0.854 $/kWh.
3.2. Case B: PV/Wind/Battery Power System
This case has considered only battery as energy storage option with PV/wind energy power system. In this case PV and wind generator are the electric power generator devices. Therefore, 97% of total electrical production is obtained by the PV and 3% of total electrical production is obtained by the wind generator. The optimal unit size and number of units of each component in the system is shown in Table 4.
Total net present cost of the complete system and its component is illustrated in Table 5, which is much higher compared to Case A due to the additional power generating device. The COE for this case (0.868 $/kWh) is higher than Case A.
3.3. Case C: Wind/Battery Power System
This case has considered only battery as energy storage option with wind turbine power system. In this case wind generator is the only electric power generator device.
Table 4. System components in case B
Component s
No. of units
Unit size
PV 1 42 kW
Wind Turbine
2 3 kW
Battery 17 48 kWh
Inverter 1 11 kW
Table 5. Net present costs in Case B
Compo-nent
Capital ($)
Repla-cement
($)
O&M ($)
Salvage ($)
Total ( $ )
PV 231,000 0 0 0 231,000
Wind turbine
18,600 4,567 5,079 -689 27,557
Battery 180,336 233,437 85,278 0 499,051
Inverter 8,800 2,512 4,598 -379 15,531
System 438,736 240,517 94,955 -1,068 773,140
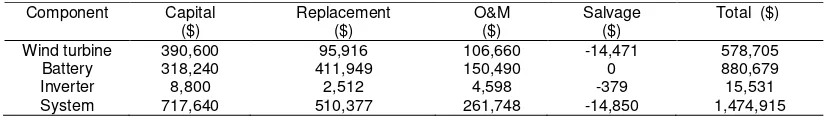
Therefore, 100% of total electrical production is by wind generator. The optimal unit size and number of units of each component in the system is shown in Table 6. Total net present cost of the complete system and its component is illustrated in Table 7, which is much higher compared to Case B due to single storage and power generating system. The COE (1.673 $/kWh) for this Case is higher than the previous two cases.
Table 6. System components in case C
Components No. of units Unit size
Wind turbine 42 3 kW
Battery 30 48 kWh
Inverter 1 11 kW
Table 7. Net present costs in case C
Figure 5 includes the cost summary of the PV/battery system which indicates that the battery is very effective in calculating the total system costs due to the short life time (5 years), so the battery is replaced 5 times during the project life time. From HOMER simulation, the use of standalone PV system was the cheapest, with the total Net Present Cost (NPC) of $ 762,083. This was according to the global solar irradiance of 6.49 kWh/m2/d. The monthly average
Component Capital
($)
Replacement ($)
O&M ($)
Salvage ($)
Total ( $ )
Wind turbine 390,600 95,916 106,660 -14,471 578,705
Battery 318,240 411,949 150,490 0 880,679
Inverter 8,800 2,512 4,598 -379 15,531
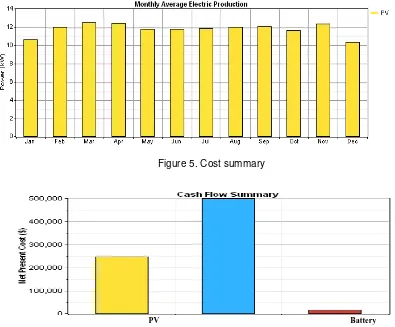
electric production is shown in Figure 6. The PV array provided energy of 103,050 kWh/year (100%).
Figure 5. Cost summary
Figure 6. Monthly average electric production for PV/battery system
3.4. Sensitivity Analysis
A challenge that often confronts the system designer is uncertainty in key variables. Sensitivity analysis can help the designer to understand the effects of uncertainty and make good design decisions despite the uncertainty.
A sensitivity analysis can be performed by entering multiple values for a particular input variable. HOMER repeats its optimization process for each value of that variable. An input variable for which you have specified multiple values is called a sensitive variable, and many sensitive variables can be defined.
A sensitivity analysis can be referred to as one-dimensional if there is a single sensitive variable. If there are two sensitive variables, it is a two-dimensional sensitivity analysis, and so on. HOMER's has the most powerful graphical capabilities which is developed to help and examine the results of sensitivity analyses of two or more dimensions [17].
a. Sensitivity to Electrical Load and Wind Speed
Primary load data may be specified with an annual average of 240 kWh/d, then specify 100, and 420 kWh/d for the primary load scaling variable. Also, wind speed ranges from 4.35 m/s to 10 m/s.
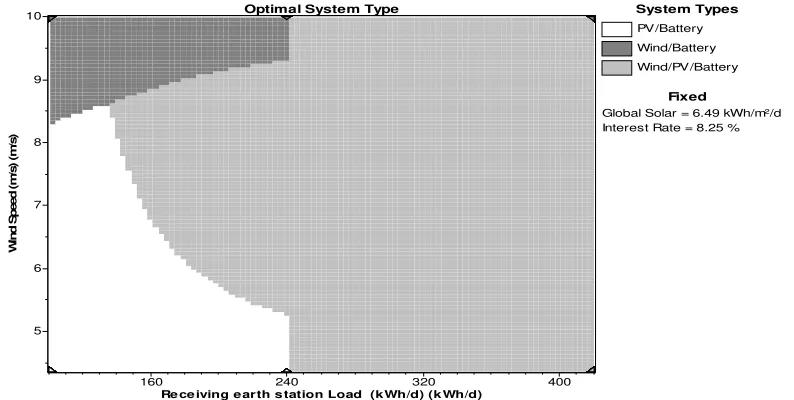
The graph in Figure 7 shows that, for the assumptions used in this analysis (global solar radiation = 6.49 kWh/m2/d, and interest rate = 8.25%), the PV/battery systems are optimal for small systems (up to 240 kWh/d) and a wind speed up to 8.5 m/s. At high wind speeds, as the load size is still up to 240kWh/d, the optimal system type changes to Wind/battery. At high wind speeds, as the load size increases, the optimal system type changes to PV/wind/battery.
Figure 7. Sensitivity to electrical load and wind speed
b. Sensitivity to Electrical Load and Solar Insolation
Two parameters remains without any variations (wind speed=4.35 m/s, and interest rate=8.25%). While the scaling process changes the magnitude of the load data and global solar radiation.
Figure 8 describes the sensitivity to load data and solar radiation. At solar insolation between 6.5 kWh/m2/d and 10 kWh/m2/d, the PV/battery system becomes competitive to PV/wind/battery system up to 240 kWh/d load energy at (wind speed = 4.35 m/s, and interest rate = 8.25%) while PV/wind/battery is the optimal case at increasing the load sizes and the same range of solar insolation.
Figure 8. Sensitivity to electrical load and global solar insolation
c. Sensitivity to Wind Speed and Solar Insolation
Two variables are considered, solar insolation and wind speed but the load and interest rate is still constant (load energy = 240 kWh/d, and interest rate = 8.25%). Figure 9 explores the feasibility to wind speed and solar radiation. The PV/battery system is the most economical solution at higher solar insolation and low wind speed, in contrast, the wind /battery is the competitive system at higher wind speed (between 9.25 m/s and 10 m/s). While the PV/wind/battery system is the optimal one at wind speed between 5.2 m/s and 9.2 m/s.
160 240 320 400
5 6 7 8 9 10
W
in
d
S
p
e
e
d
(
m
/s
)
(m
/s
)
Optimal System Type
Re ce iving earth s tation Load (kWh/d) (k Wh/d)
System Types
PV/Battery Wind/Battery Wind/PV/Battery
Fixed
Global Solar = 6.49 kWh/m²/d Interest Rate = 8.25 %
160 240 320 400
6.5 7.0 7.5 8.0 8.5 9.0 9.5 10.0
G
lo
b
a
l
S
o
la
r
(k
W
h
/m
²/
d
)
Optimal System Type
Re ce iving e ar th s tation Load (k Wh/d)
System Types
PV/Battery Wind/PV/Battery
Fixed
Figure 9. Sensitivity to wind speed and global solar insolation
3.5. Sensitivity Results
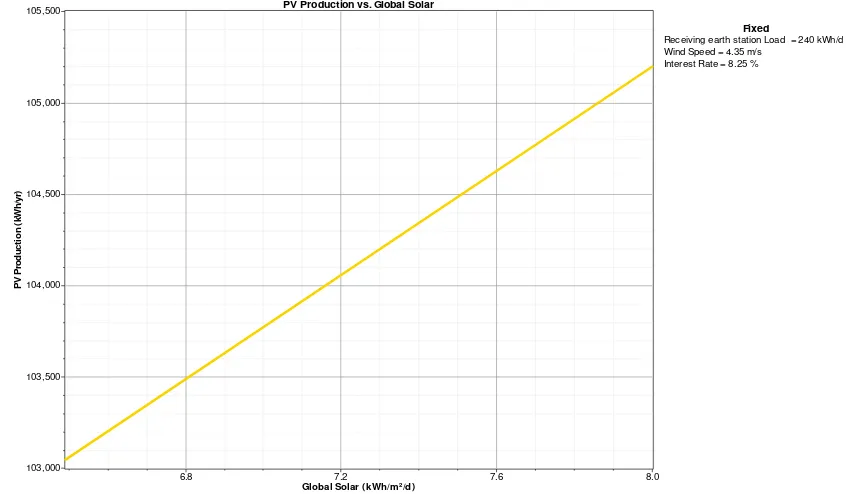
The PV production as a function of global solar radiation, wind speed, is shown in Figure 10 to Figure 11 respectively. The PV production increases with the global solar radiation. In contrast, it is inversely proportional to wind speed due to the wind energy system contributes with percentage of the total energy production.
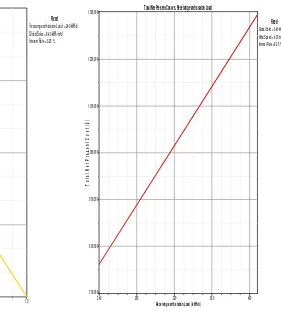
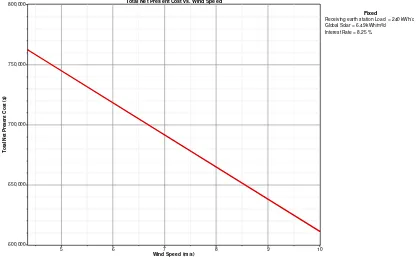
The total NPC versus the four data sets (load energy, interest rate, global solar radiation, and wind speed) is presented in Figure 12 to Figure 15 respectively. It is found that, the NPC increases gradually with load energy due to more energy production are needed to cover the load demand. While the NPC decreased with interest rate, global solar radiation, and wind speed. As a result of, the unit size of each component in the system decreases to feed the same load.
Figure 10. PV production as a function of solar insolation
6.5 7.0 7.5 8.0 8.5 9.0 9.5 10.0
5 6 7 8 9 10
W
in
d
S
p
e
e
d
(
m
/s
)
Optimal System Type
Global Solar (k Wh/m ²/d)
System Types
PV/Battery Wind/Battery Wind/PV /Battery
Fixed
Receiving earth station Load = 240 kWh/d Interest Rate = 8.25 %
6.8 7.2 7.6 8.0
103,000 103,500 104,000 104,500 105,000 105,500
P
V
P
ro
d
u
c
ti
o
n
(
k
W
h
/y
r)
PV Production vs. Global Solar
Global Solar (kWh/m ²/d)
Fixed
Receiving earth station Load = 240 kWh/d Wind Speed = 4.35 m/s
Figure 11. PV production as a function of wind speed
Figure 12. Total NPC vs. load profile
Figure 13. Total NPC vs. interest rate Figure 14. Total NPC vs. global solar insolation
5 6 7 8 9 10
0 30,000 60,000 90,000 120,000 P V P ro d u c ti o n ( k W h /y r)
PV Production vs. Wind Speed
Wind Speed (m/s)
Fixed
Receiving earth station Load = 240 kWh/d Global Solar = 6.49 kWh/m²/d Interest Rate = 8.25 %
240 280 320 360 400 700,000 800,000 900,000 1,000,000 1,100,000 1,200,000 1,300,000 T o ta l N e t P re s e n t C o s t ($ )
Total Net Present Cost vs. Receiving earth station Load
Receiving earth station Load (kWh/d)
Fixed Global Solar = 6.49 kWh/m²/d Wind Speed = 4.35 m/s Interest Rate = 8.25 %
8.5 9.0 9.5 10.0 10.5 11.0 11.5
680,000 700,000 720,000 740,000 760,000 780,000 T o ta l N e t P re s e n t C o s t ($ )
Total Net Present Cost vs. Interest Rate
Interest Rate (%)
Fixed
Receiving earth station Load = 240 kWh/d Global Solar = 6.49 kWh/m²/d Wind Speed = 4.35 m/s
6.8 7.2 7.6 8.0
730,000 735,000 740,000 745,000 750,000 755,000 760,000 765,000 T o ta l N e t P re s e n t C o s t ($ )
Total Net Present Cost vs. Global Solar
Global Solar (kWh/m²/d)
Figure 15. Total NPC vs. wind speed
4. Conclusion
Earth station is a vital element in any satellite communication network. The function of an earth station is to transmit/receive information to/from the satellite in the most cost-effective and reliable manner while retaining the desired signal quality. Power supply subsystem is an important system for supplying the earth station equipment with electrical power. Designing a power system would require correct components selection and sizing with appropriate operation strategy. Initial component sizing methods are based on worst month scenario leads to non optimal design with excess capacity. HOMER software program is used for simulating and optimizing the earth station power system.
Three power system configurations are presented, PV/battery system, PV/wind/battery system and wind/battery system. These systems are compared with respect to the total net present cost (NPC) and levelized cost of energy. The total NPC of wind/battery system was still higher as compared to PV/battery system and PV/wind/battery system provided if the wind speed is low enough. For our site, the PV/battery configuration is the most economic solution under given resource and load conditions. The values of global solar irradiance, wind speed, interest rate, and load energy have been varied in order to determine the suitability of the implementation of the different types of energy systems. For this reason, sensitivity analysis is performed for three power system configurations.
The total NPC of Wind/battery system was still higher as compared to PV/battery system and PV/Wind/battery system provided if wind speed is low enough. However, if the wind speed increases considerably, the total NPC of Wind/battery system would be the lowest among all other systems. On the other hand, if the global solar radiation and interest rate increase, the total NPC of PV/battery system would be the lowest among all other systems. The choice of the hybrid PV/Wind system is only feasible if the load energy increases. For our site, the PV/battery configuration is the most economic solution under given resources and load conditions.
References
[1]. B Elbert. The Satellite Communication Ground Segment and Earth Station Handbook. Artech House
space technology and applications library. Boston, London. 2000.
[2]. http://www.boddunan.com/education/19-engineering/4678-earth-station-design.html.
5 6 7 8 9 10
600,000 650,000 700,000 750,000 800,000
T
o
ta
l
N
e
t
P
re
s
e
n
t
C
o
s
t
($
)
Total Net Present Cost vs. Wind Speed
Wind Speed (m /s)
Fixed
[3]. New and Renewable Energy Authority. Ministry of Electricity and Energy. Egyptian Solar Radiation Atlas. Cairo, Egypt. 1998.
[4]. United States (US) National Renewable Energy Laboratory’s (NREL) HOMER Software, https://analysis.nrel.gov/homer.
[5]. Kandahar City Utility Interconnected 10 MWp Photovoltaic Power Assessments. Report of Afghanistan Clean Energy Program. May. 2010.
[6]. J Kaldellis, D Zafirakis, E Kaldelli, K Kavadias. Cost Benefit Analysis of a Photovoltaic-Energy
Storage Electrification Solution for Remote Islands. Renewable Energy. 2009; 34: 299-1311.
[7]. J Razak, K Sopian, Y Ali, M Alghoul, A Zaharim, I Ahmad. Optimization of PV-wind-hydro-diesel
Hybrid System by Minimizing Excess Capacity. European Journal of Scientific Research. 2009; 25(4):
663-671.
[8]. Kamel S, Dahl C. The Economics of Hybrid Power Systems for Sustainable Desert Agriculture in
Egypt. Energy. 2005; 30:1271-1281.
[9]. Kaldellis K, Kondili E, Filios A. Sizing a Hybrid Wind-Diesel Stand Alone System on the Basis of
Minimum Long-Term Electricity Production Cost. Applied Energy. 2006; 83: 1384-1403.
[10]. Benghanem M. Low Cost Management for Photovoltaic Systems in Isolated Site with New IV
Characterization Model Proposed. Energy Convers. Manage. 2009; 50: 748-755.
[11]. A Kaabeche, M Belhamel, R Ibtiouen. Optimal Sizing Method for Stand–Alone Hybrid PV/Wind
Power Generation System. Revue des Energies Renouvelables (SMEE'10) Bou Ismail Tipaza. 2010;
205–213.
[12]. A Kaabeche, M Belhamel, R Ibtiouen. Techno-Economic Valuation and Optimization of Integrated
Photovoltaic/Wind Energy Conversion System. Solar Energy. 2011; 85: 2407-2420.
[13]. S Mishra, S Singal, D Khatod. Optimal Installation of Small Hydropower Plant-a Review. Renewable
and Sustainable Energy Reviews. 2011; 15: 3862- 3869.
[14]. G Panayiotou, S Kalogirou, S. Tassou. Design and Simulation of a PV and a PV/Wind Standalone
Energy System to Power a Household Application. Renewable Energy. 2012; 37: 355-363.
[15]. S Rahman, D Vanier. Life Cycle Cost Analysis as a Decision Support Tool for Managing Municipal
Infrastructure. CIB Triennial Congress. Toronto, Ontario. 2004: 1-12.