DOI: 10.12928/TELKOMNIKA.v13i3.1804 776
Failure Mode and Effect Analysis of Power Transformer
Based on Cloud Model of Weight
Jianpeng Bian*, Xiaoyun Sun, Jing Yang
School of Electrical and Electronics Engineering, Shijiazhuang Tiedao University, Shijiazhuang, 050043, Hebei, China
*Corresponding author, e-mail: [email protected]
Abstract
As the key component of a power system, the power transformer directly impacts the reliability and safety of the system. Failure mode and effects analysis (FMEA) is a methodology used to analyze potential failure modes within a system and has been used extensively to examine the power transformer’s performance in various potential failure scenarios. However, the FMEA method has several flaws; for example, the non-differential analysis of evaluation index and the impossibility of evaluating the actual risk among risk priority number (RPN) values that on the surface are equal. The cloud model of weight incorporates the relative importance of index. This paper proposes applying FMEA based on the cloud model of weight to assess a power transformer for risk, and shows that this method can effectively overcome the defects of traditional FMEA assessment methods.
Keywords: Power transformer, Maintenance strategy, Cloud model of weight, FMEA
Copyright © 2015 Universitas Ahmad Dahlan. All rights reserved.
1. Introduction
The power transformer is the key equipment in a power system; therefore, the normal operation of the transformer is critical for the safety and stability of the system. Failure mode and effects analysis, first developed at Grumman Aircraft Corporation in the 1950s, is the methodology most commonly used to perform preventive maintenance. This maintenance identifies and eliminates known and/or potential failures, beginning by ranking the highest-priority issues [1, 2]. Traditional FMEA determines the risk priorities of failure modes by using the risk priority number, which is determined by each risk factor’s occurrence (O), severity (S) and detection (D). Traditional RPN is a product of these three factors [3, 4]. That is:
RPN O S D (1)
The drawbacks of using RPN to prioritize failure mode maintenance for power transformer parts are clear [5-8]. They include primarily different sets of risk factors may produce the same RPN value, but their risk implications may be quite different. And the relative importance of O, S and D is not taken into account.
The fuzzy set theory, which has demonstrated great capability and performs in a variety of application domains such as control and modeling [9, 10], can capture the uncertainty and ambiguity of factors. Thus, the fuzzy RPN has been widely utilized in FMEA to overcome some of traditional FMEA’s aforementioned drawbacks [11, 12]. However, approaches based primarily on probability or fuzzy set theory usually ignore all uncertainties that may occur during the evaluation process. In addition, the fuzzy RPN model lacks an effective way to translate qualitative evaluation to quantitative numerical value. Thus, FMEA based on fuzzy theory cannot attach enough importance to uncertainty to adequately assess and prioritize risk maintenance in the power transformer.
The proposed method also provides a convincing foundation for planning an efficient maintenance strategy, which will improve the transformer’s security and value.
The rest of this paper is organized as follows. Section 2 describes the FMEA based on the cloud model of weight method. Section 3 illustrates the practical application of this method to assess the power transformer. Section 4 presents conclusions.
2. FMEA Based on Cloud Model of Weight 2.1. Evaluation Index of Power Transformer
In order to properly assess the power transformer, we must establish the key index of the assessment. It would not be practical to include every possible risk factor in this example. Instead, key index were chosen that are broad enough to encompass the entire structure of the power transformer, represent each critical part and produce a comprehensive risk assessment.
There are many possible failure modes in a transformer, and their probability of occurrence, detection and severity differ. Based on statistical data and expert opinion, traditional FMEA calculates the probability of each failure mode and ranks these probabilities into 5 grades. The higher the grade is, the greater the potential danger to the power transformer (Table 1-3).
Table 1. Evaluation criteria of severity
Severity Effect of severity Ranking
Hazardous Tremendous loss of environment and personnel, extreme damage to transformer, will greatly affect power system
10
Very severe high failure rate of the power transformer and may cause loss of environment and personnel
8,9
Comparatively severe
Significant damage to transformer, unclear to what degree environment and personnel will suffer
6,7
Moderate Some damage to transformer, likely some loss of environment and personnel 2,3,4,5
Low Transformer and power system not affected, no obvious damage to environment and personnel
0,1
Table 2. Evaluation criteria of detection
Detection Likelihood of detection Ranking
Absolute uncertainty
Potential failure or fault may be very difficult to detect and (once detected) may require emergency major refurbishment
10
Very low Potential failure or fault may be detected with strict online multi-monitoring 8,9
Moderate Potential failure may be detected with strict overall monitoring and increasing the number of diagnostics performed
5,6,7
High Potential failure may be easily detected with strict monitoring schedule 2,3,4
Almost certain Potential failure may be easily detected by the appearance, sound and temperature of transform
0,1
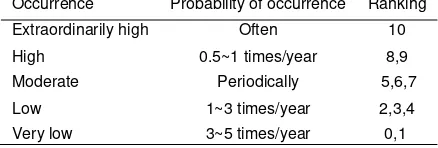
Table 3. Evaluation criteria of occurrence Occurrence Probability of occurrence Ranking
Extraordinarily high Often 10
High 0.5~1 times/year 8,9
Moderate Periodically 5,6,7
Low 1~3 times/year 2,3,4
2.2. Construction of the Cloud Model of Weight
Cloud model is a new model for concept representation and captures the uncertain transition between qualitative concept and its quantitative representation. The digital characteristics of clouds can integrate the fuzziness and randomness of linguistic terms in a unified way, which lays a foundation of knowledge representation. Therefore, the cloud model can mimic a human being’s thinking and is more flexible and effective than the conventional fuzzy reasoning methods in representing uncertainty and propagating knowledge. The calculation method of the cloud model of weight is based on the product of the square root. The specific process is as follows [13]:
(1) Construction of the cloud matrix of contrast
Every element in the cloud matrix of contrast is constituted by the cloud model. The element Cikrepresents the contributing degree of the sub-index fito the prior-index, which is relative to fk. Assume the number of the sub-index isn. Through analyzing the characteristics of the pair-wise comparison cloud matrix, it is clear that the diagonal elementCiirepresents the important degree of comparison, that is,Exii 1,Enii 0, Heii 0. Again, the element Cik represents the contributing degree of the sub-index fito the prior-index, which is relative to fk and the symmetrical elementCkiis the contrast. So, the Cikand Ckimust satisfy the following relation:
(2) Value of the elements in the cloud matrix of contrast
When constructing the cloud matrix of contrast, the mutually important degrees of the different index should be determined first to form the cloud model, that is, the cloud’s pole. Secondly, experts must determine the degree of each sub-index’s importance relative to the cloud’s pole. Finally, the results are synthesized. The concrete process for a cloud weight based FMEA analysis of a power transformer is as follows:
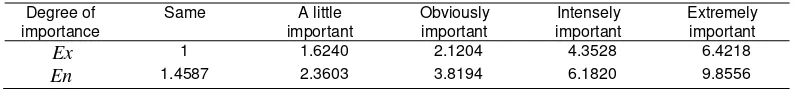
The degree of mutual importance of FMEA’s three risk factors (S, O, and D) is divided into five ranks. Experts determine the mutually important degree of each factor relative to the cloud model’s pole. The qualitative results are quantified through the application of synthesized, multi-expert quantification to determine the value of each factor. TheEx and of the cloud model of different important degree is listed in Table 4. And .
Table 4. Division of important degree and corresponding expect value and entropy value of cloud model
1 1.6240 2.1204 4.3528 6.4218
En 1.4587 2.3603 3.8194 6.1820 9.8556
(3) Calculation of cloud of weight
The cloud model of weight can be comprehended as modulating the traditional weight. In the characteristic numbers of the cloud models ( ,En,He), the is the weight of the traditional FMEA analysis, and theEnand are utilized to fine-tune the value of the weight by adjusting the parameters. The concrete process is as follows:
0
(3) Normalization of vector W
The normalization of vectorWisW (W W1, 2,,Wn). Wiis the cloud model of weighti
The definition of the add operation and the division operation of the cloud model 1
(
1,
1,
1)
2.3. Process of FMEA Based on Cloud Model of Weight
(1) According to Table 1-3, the severity, detection and occurrence of potential failure in components of the power transformer are respectively evaluated and the corresponding quantitative values are determined.
(b) The product M Ex En Hei( i, i, i)of every element of the cloud matrix of contrast
C
is calculated through Equation (4)-(5).(c) The nth root W (W W W1, 2, 3)of can be calculated according to the Equation (6).
(d) The is normalized by Equation (7)-(9) to produce the quantitative value of severity, detection and occurrence in the cloud matrix of contrast.
(e) The quantified values of severity, detection and occurrence according to step (1) are normalized and mapped onto the cloud weight of severity, detection and occurrence. Then the weight of severity, detection and occurrence can be calculated.
(3) According to the Equation (10), RPN can be calculated through the quantified values for severity, detection, occurrence derived according to step (1) and the cloud weight of severity, detection and occurrence.
s o d
RPN w S w O w D (10)
(4) According to Table 5 and RPN, the corresponding maintenance strategy for each part of the power transformer can be determined.
Table 5. Corresponding Maintenance Strategy according to the threshold of RPN
RPN<2 2<RPN<4 4<RPN<6 6<RPN<8 8<RPN<10 Maintenance
3. Practical Applications of FMEA Based on Cloud Weight
Let us consider a sample 500kV power transformer and analyze it using FMEA based on the cloud weight model. The operational history and maintenance records of our sample transformer show that the transformer has experienced a short-term emergency load and has had one overhaul. The major problem with this transformer is that a group of cooler terminals has burned, the hand of the on-load tap-changer (OLTC) is normal but the electric operation is bad and the oil gauge level is lower than normal. The inspection of body of transformer is normal.
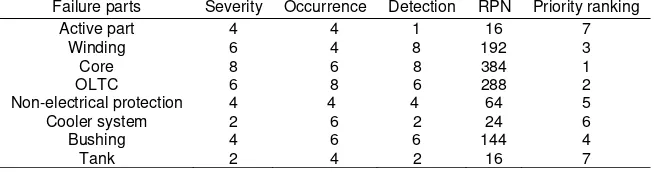
Table 6. Evaluation of three risk factors, priority ranking by traditional RPN Failure parts Severity Occurrence Detection RPN Priority ranking
Active part 4 4 1 16 7
Table 6 shows the failure risk factors S, O, and D for a power transformer and how they would be ranked using the traditional RPN values. Clearly, the three risk factors of potential failure for the Active part and the Tank are different. However, using traditional RPN calculus, these two parts would be assigned the same RPN and have the same maintenance priority ranking.
This paper evaluates the intertwined importance of the risk factors of severity, occurrence and detection in a power transformer, quantifies these qualitative results plus multi-expert opinions, and creates a judgment matrix as follows:
The pair-wise comparison cloud matrix can be constructed according to Equation (2)-(3) to determine the cloud model of weight of the three variables. The weight variable can be obtained by inputting the index value. Finally, the cloud weight of each of the three variables is calculated utilizing the algorithm of the cloud model of weight. Figure 1 shows the cloud model of weight of the three risk factors according to Equation (4)-(9).
Figure 1. Cloud model of weight of three risk factors
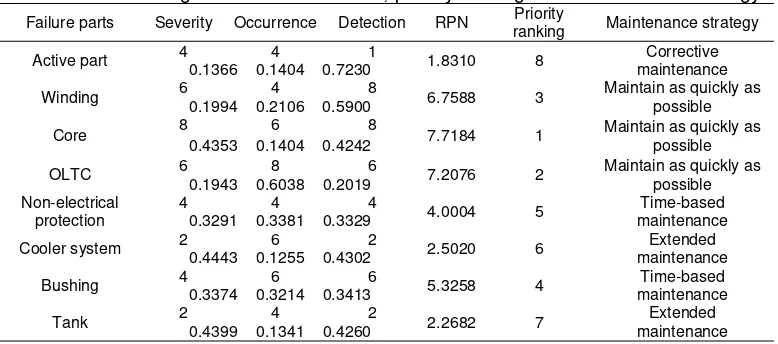
Table 7. Cloud weight of three risk factors, priority ranking and maintenance strategy Failure parts Severity Occurrence Detection RPN Priority
ranking Maintenance strategy
Active part 4 4 1 1.8310 8 Corrective
maintenance 0.1366 0.1404 0.7230
Winding 6 4 8 6.7588 3 Maintain as quickly as
possible 0.1994 0.2106 0.5900
Core 8 6 8 7.7184 1 Maintain as quickly as
possible 0.4353 0.1404 0.4242
OLTC 6 8 6 7.2076 2 Maintain as quickly as
possible 0.1943 0.6038 0.2019
Non-electrical protection
4 4 4
4.0004 5 Time-based
maintenance 0.3291 0.3381 0.3329
Cooler system 2 6 2 2.5020 6 Extended
maintenance 0.4443 0.1255 0.4302
Bushing 4 6 6 5.3258 4 Time-based
maintenance 0.3374 0.3214 0.3413
Tank 2 4 2 0.4399 0.1341 0.4260 2.2682 7 maintenance Extended
Table 7 shows that the risk value of failure across all three risk factors is very high for the Core, OLTC and Winding failure parts of the transformer; therefore, these components should be maintained as quickly as possible according to the threshold of RPN. Two risk factors—occurrence and detection—are comparatively high for the Non-electrical protection and Bushing parts, but the severity factor is comparatively low. Thus, potential failure maintenance should be time-based according to the threshold of RPN. One risk factor—occurrence—is high for the Cooler system and Tank parts, but the severity and detection factors are low; therefore, failure maintenance for these two parts should occur on an extended maintenance schedule according to the threshold RPN.
Although the severity and occurrence factors for the Active part are comparatively high, the detection factor is very low. Maintenance for this part, which is behind the tank, may occur on a corrective schedule.
4. Conclusion
schedule. The paper compares FMEA based on cloud weights to the currently more commonly used traditional FMEA, which scores and prioritizes risk through a simple calculation of RPN. The cloud model of weight is more practical and flexible than traditional RPN values, as it is capable of taking into consideration the relative importance among the risk factors O, S and D, as well as allowing for uncertainties that can occur during transformer performance tests and evaluations. Based on the practical example offered in the paper, the cloud weight based model shows its potential advantage in detecting high risks of power failures in transformers systematically and effectively.
Also, very importantly, we show that evaluating risk factors using cloud weight analysis may help parse out the actual differences in risk that may lurk behind the apparently equal RPN that traditional FMEA analysis generally produces. It is evident that the proposed model can not only reduce manpower investment in power transformer maintenance, but also mitigate the risks and expenses associated with power transformer failures.
Acknowledgements
This work was supported by the National Natural Science Foundation of China (Grant No. 51307112) and National Natural Science Foundation of China (Grant No. 51274144) and the Natural Science Foundation of Hebei Province (Grant No. F2012210031) and China Postdoctoral Science Foundation (Grant No. 2013T60197).And Colleges and Universities youth talent program projects of Hebei Province (Grant No.BJ2014054).
References
[1] Hoseynabadi HA, Oraee H, Tavner PJ. Failure Modes and Effects Analysis (FMEA) for wind turbines.
Electrical Power and Energy Systems. 2010; 32(7): 817-824.
[2] Xiao YC, Nan GQ, Zhang Qing, Han Xiao. Transformer Fault Diagnosis Based on Hierarchical Fuzzy Support Vector Machines. TELKOMNIKA Indonesian Journal of Electrical Engineering. 2013; 11(10): 5842-5850.
[3] Gao LA, Zhou YG, Huo LM. Reliability assessment of distribution systems with distributed generation based on Bayesian networks. Engineering Review. 2014; 34(1): 55-62.
[4] Hu AH, Hsu CW, Kuo TC, Wu WC. Risk evaluation of green components to hazardous substance using FMEA and FAHP. Expert Systems with Applications. 2009; 36(3): 7142-7147.
[5] Gargama H, Chaturvedi SK. Criticality Assessment Models for Failure Mode Effects and Criticality Analysis Using Fuzzy Logic. Reliability. 2011; 60(1): 102-110.
[6] Braglia M, Frosolini M, Montanari R. Fuzzy criticality assessment model for failure modes and effects analysis. International Journal of Quality & Reliability Management. 2003; 20(4): 503-524.
[7] Franzén A, Karlsson S. Failure Modes and Effects Analysis of Transformers, Royal Institute of Technology. KTH School of Electrical Engineering. Stockholm, Sweden. 2007.
[8] Liu HC, Liu L, Lin QL. Fuzzy Failure Mode and Effects Analysis Using Fuzzy Evidential Reasoning and Belief Rule-Based Methodology. Reliability. 2013; 62(1): 23-26.
[9] Yang ZL, Bonsall S, Wang J. Fuzzy Rule-Based Bayesian Reasoning Approach for Prioritization of Failures in FMEA. Reliability. 2008; 57(3): 517-528.
[10] Chen Y, Ji L, Liu Q. Application Research of Fuzzy Theory in PE Teaching Evaluation. TELKOMNIKA
Indonesian Journal of Electrical Engineering. 2013; 11(9): 5133-5140.
[11] Lee YS, Kim DJ, Kim JO, Kim H. New FMECA Methodology Using Structural Importance and Fuzzy Theory. Power Systems. 2011; 26(4): 2364-2370.
[12] Liu HC, Liu L, Liu N, Mao LX. Risk Evaluation in Failure Mode and Effects Analysis with Extended VIKOR Method under Fuzzy Environment. Power Systems. 2012; 39(17): 12926-12934.