Nutrient Cycling in Agroecosystems71:17–32, 2005.
DOI 10.1007/s10705-004-0382-0 © Springer 2005
The variation of greenhouse gas emissions from soils of various
land-use/cover types in Jambi province, Indonesia
Shigehiro Ishizuka
1,∗, Anas Iswandi
2, Yasuhiro Nakajima
3, Seiichirou Yonemura
3, Shigeto
Sudo
3, Haruo Tsuruta
3and Daniel Murdiyarso
41Forestry and Forest Products Research Institute, Sapporo, Hokkaido 062-8516, Japan; 2Department of Soil
Science, Bogor Agricultural University (IPB), Jl. Raya Pajajaran Bogor 16143, Indonesia;3National Institute for Agro-Environmental Sciences, Tsukuba, Ibaraki 305-8604, Japan;4Department of Geophysics and Meteorology, Bogor Agricultural University (IPB), Jl. Raya Pajajaran Bogor 16143, Indonesia; ∗Author for correspondence (Tel: +81-11-851-4131; Fax: +81-11-851-4167; e-mail: [email protected])
Key words:Flux measurement, Greenhouse gas, Land-use change, Nitrification, Sumatra of Indonesia, Tropical rain forest
Abstract
We measured fluxes of three greenhouse gases (N2O, CO2and CH4) from soils of six different land-use types at 27 temporary field sites in Jambi Province, Sumatra, Indonesia. Study sites included natural and logged-over forests; rubber plantation; oil palm plantation; cinnamon plantation; and grassland field. The ranges of N2O, CO2 and CH4fluxes were 0.13–55.8µg N m−2h−1; 1.38–5.16 g C m−2d−1;−1.27–1.18 mg C m−2d−1, respectively. The averages of N2O, CO2and CH4fluxes at 27 sites were 9.4µg N m−2h−1, 3.65 g C m−2d−1,−0.45 mg C m−2d−1, respectively. The values of CO2and CH4fluxes were comparable with those in the reports regarding other humid tropical forests, while the N2O flux was relatively lower than those of previous reports. The N2O fluxes in each soil type were correlated with the nitrification rates of soils of 0–5 cm depth. In Andisols, the ratio of the N2O emission rate to the nitrification rate was possibly smaller than that of the other soil types. There was no clear relationship between N2O flux and the soil water condition, such as water-filled pore space. Seventeen percent of CH4fluxes were positive; according to these positive fluxes, we did not find a good correlation between CH4uptake rate and soil properties. Although we performed a chronosequence analysis to produce some hypotheses about the effect of land-use change by a limited amount of sampling at one point in time, further tests are required for the future.
Introduction
Greenhouse gas emissions from humid tropical eco-systems are clearly significant, but because of the limited quantity of data, the global estimate of green-house gas fluxes remains uncertain. To overcome this limitation, we need more spatial data, especially from the areas where there are few observations, such as Southeast Asia.
Land-use changes have the potential to affect the global budget of greenhouse gases (IPCC 1995). Over the last three decades in Indonesia, deforestation and land-use/cover changes have coincided with the de-velopment of the road infrastructure. During 1990 to
1997, the percentage deforestation rate of humid trop-ical forest in Southeast Asia (0.91%) was the largest in the world and annual loss of forest area was estimated as 2.5 G ha y−1, which was almost the same as that of Latin America (Achard et al. 2002). But few data have been collected about the effect of land-use change on the greenhouse gas emissions in Southeast Asia.
from natural soils; they estimated the annual global emission as 6.8 Tg N, 80% of which was released from tropical areas. According to their estimation, one reason for this high proportion of output from the trop-ics is that Ferralsols, which have a relatively high N2O emission rate, comprise an area of 1116 Mha, one of the world’s largest. Clearly, precise knowledge of the variation of N2O flux in tropical regions is needed.
The global CH4 rate of uptake by soils has been estimated at 15–35 Tg y−1(Potter et al. 1996). Humid tropical forest accounts for 10–20% of the global CH4 uptake rate (Potter et al. 1996). The most important factor controlling the CH4 uptake rate is the gas dif-fusion coefficient, which is determined by soil texture class (Born et al. 1990; Verchot et al. 2000). Land-use change from forest to active pasture caused a decrease in the CH4uptake rate (Keller et al. 1993; Keller and Reiners 1994), although degraded pasture consumed more CH4 than primary forest (Verchot et al. 2000). Because of the limited number of studies, however, the effect of land-use change on the CH4uptake rate in tropical forests remains poorly quantified.
The annual global CO2flux from soils into the at-mosphere is estimated to be 76.5 Pg C y−1(Raich and Potter 1995). The CO2flux from tropical moist forest was the highest of all terrestrial ecosystems (Raich and Potter 1995). Much like in the case of the CH4uptake rate, the effect of land-use change on CO2flux is ob-scure; some reports indicate an increase, while others indicate a decrease or no change in CO2emission rate (Raich and Schlesinger 1992).
An intensive field study on greenhouse gas emis-sions from soils of humid tropical forests in Sumatra, Indonesia, first reported by Ishizuka et al. (2002), re-vealed relatively lower N2O flux and CO2fluxes than in previous reports involving multiple land-use types. These researchers obtained results showing that slash-and-burn had the adverse impact of accelerating N2O emission rates and reducing CH4 uptake rates. Be-cause the field study focused on the seasonal variation of gas fluxes and on the impact of land-use change after deforestation, the area of land under study was relatively small, 3.7 km in latitude by 7.5 km in longit-ude (Ishizuka et al. 2002). It remains to be determined whether data is available or not for a larger area, and can therefore be applied to the entire area of Jambi, Sumatra, which has a wide variety of soil types and land-use types.
Our objective was to make an initial approach to represent the flux intensity and the relationship between land-use type and greenhouse gas
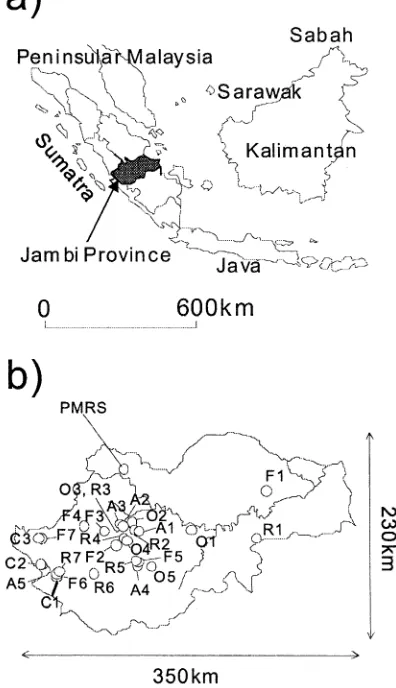
emis-Figure 1. (a) The location of Jambi Province, and (b) the location of the 27 sites and PMRS.
sions in several hundred square kilometers in Jambi, Sumatra, Indonesia by (1) clarifying the major factor controlling greenhouse gas emissions related to the soil properties, and (2) performing a chronosequence analysis to evaluate the effect of land-use change.
Material and methods
Site description
19
the easternmost part, a swampy area, sits near sea level. The entire region (except the mountainous area) belongs to humid tropics. The annual rainfall ranged from 2112 to 2798 mm y−1 between January 1998 and December 2001 in the northwestern part of Jambi Province, called Pasir Mayang Research Site (PMRS; Ishizuka et al. 2002). It has yearly dry and wet seasons, which last from May to September and from October to April, respectively; the average monthly rainfall in the dry season (114 mm) was 42% of that in the rainy season (270 mm). According to four years of measure-ment in PMRS, the N2O flux in September was 80% of the annual mean of N2O flux and the differences in CO2 and CH4fluxes between September and annual mean was less than that of N2O (Tsuruta et al., un-published data). The area’s annual mean temperature is around 25◦C. The soil type around the mountainous area features Andisols, containing thick volcanic ash. In the middle part of Jambi Province, the main soil type is Ultisols, which has a low pH and a low nutrient level. The soil in the eastern part of Jambi Province has a wetter regime than that in the western part, whose soil is classified as Udults in USDA soil taxonomy.
In this experiment, we collected gas samples and soil samples at various land-use/cover types. Three land-use types are distributed widely throughout the province; rubber plantations managed by small land-holders, oil palm plantations belonging to large es-tates (Murdiyarso and Wasrin 1995) and abandoned grassland fields, where mainly Alang-alang (Imperata cylindrica) grows. We took the samples at 27 sites; seven natural or logged-over forests, three cinnamon (Cinamum burmanii) plantations, five oil palm plant-ations, seven rubber plantplant-ations, and five Alang-alang grassland fields. The ‘logged-over forest’ was defined as forest that was selectively cut and even had a signi-ficant amount of aboveground biomass. By the status of this logged-over forest, it is more adequate to cat-egorize it in natural forest rather than in afforested forest, so we categorized the primary and logged-over forest into a forest (F). The location of and the gen-eral information about each site are shown in Figure 1 and in Table 1, respectively. We divided the rubber plantation sites and the oil palm plantation sites into two groups. One group included rubber and oil palm plantations more than 10 years old, labeled old rubber (oR) and old oil palm (oO), respectively. The other group included young rubber (yR) and oil palm plant-ations (yO) less than 10 years old. The total number of sampling sites categorized by soil type and land-use type appears in Table 2.
General land-use history and management in this region
The lowland area was cleared from natural forests and burned for transmigration area in the 1980s. Un-til 1987, the area was planted with food crops such as maize, upland rice, cassava, soybean and peanuts. However, the yield of the crops was low even though some fertilizers and agriculture lime (calcite; CaCO3) had been applied. Therefore in the 1990s, the trans-migration farmers and a private company introduced oil palm in this area, facilitated by the government. In order to speed up the process of clearing land for oil palm plantation, heavy equipment (backhoe, trailer, etc.) was used to uproot the residual trunks and tree branches which were then burned (A. Iswandi, personal communication). As a result of these meas-ures, most of the top soil disappeared and the soil was susceptible to erosion through rainfall. There-fore, for young oil palm up to the age of four years, legume cover crops (such as Centrosema pubercens,
Crotalaria juncea,Siratrospp. etc.) were planted not only to protect soils from erosion, but also to increase soil fertility through N2fixation. Fertilizers (N, P, K) were regularly added twice a year to the oil palm. Alang-alang grassland was the area of the transmigra-tion farmers who did not take part in the oil palm pro-gram or the rather newly cleared forests but abandoned by the farmers. The farmers did not plant food crops because of the low productivity. With the small-holder rubber plantations originating from cleared forest, the residual trunk, twig etc. were burned, and then they grew upland rice without fertilizer and at the same time rubber trees were planted. Upland rice usually was planted up to three growing seasons until the rubber canopy covered the land surface. In cinnamon plantation, farmers never used fertilizers.
Flux measurement
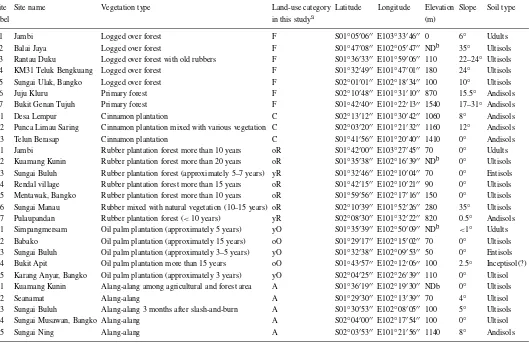
Table 1. Sampling sites description.
Site Site name Vegetation type Land-use category Latitude Longitude Elevation Slope Soil type
label in this studya (m)
F1 Jambi Logged over forest F S01◦05′06′′ E103◦33′46′′ 0 6◦ Udults
F2 Balai Jaya Logged over forest F S01◦47′08′′ E102◦05′47′′ NDb 35◦ Ultisols
F3 Rantau Duku Logged over forest with old rubbers F S01◦36′33′′ E101◦59′06′′ 110 22–24◦ Ultisols
F4 KM31 Teluk Bengkuang Logged over forest F S01◦32′49′′ E101◦47′01′′ 180 24◦ Ultisols
F5 Sungai Ulak, Bangko Logged over forest F S02◦01′01′′ E102◦18′34′′ 100 10◦ Ultisols
F6 Juju Kluru Primary forest F S02◦10′48′′ E101◦31′10′′ 870 15.5◦ Andisols
F7 Bukit Genan Tujuh Primary forest F S01◦42′40′′ E101◦22′13′′ 1540 17–31◦ Andisols
C1 Desa Lempur Cinnamon plantation C S02◦13′12′′ E101◦30′42′′ 1060 8◦ Andisols
C2 Punca Limau Saring Cinnamon plantation mixed with various vegetation C S02◦03′20′′ E101◦21′32′′ 1160 12◦ Andisols
C3 Telun Berasap Cinnamon plantation C S01◦41′56′′ E101◦20′40′′ 1410 0◦ Andisols
R1 Jambi Rubber plantation forest more than 10 years oR S01◦42′00′′ E103◦27′45′′ 70 0◦ Udults R2 Kuamang Kunin Rubber plantation forest more than 20 years oR S01◦35′38′′ E102◦16′39′′ NDb 0◦ Ultisols R3 Sungai Buluh Rubber plantation forest (approximately 5–7 years) yR S01◦32′46′′ E102◦10′04′′ 70 0◦ Entisols R4 Rendal village Rubber plantation forest more than 15 years oR S01◦42′15′′ E102◦10′21′′ 90 0◦ Ultisols R5 Mentawak, Bangko Rubber plantation forest more than 10 years oR S01◦59′56′′ E102◦17′16′′ 150 0◦ Ultisols R6 Sungai Manau Rubber mixed with natural vegetation (10–15 years) oR S02◦10′39′′ E101◦52′26′′ 280 35◦ Ultisols R7 Pulaupandan Rubber plantation forest (<10 years) yR S02◦08′30′′ E101◦32′22′′ 820 0.5◦ Andisols O1 Simpangmersam Oil palm plantation (approximately 5 years) yO S01◦35′39′′ E102◦50′09′′ NDb <1◦ Udults O2 Babako Oil palm plantation (approximately 15 years) oO S01◦29′17′′ E102◦15′02′′ 70 0◦ Ultisols O3 Sungai Buluh Oil palm plantation (approximately 3–5 years) yO S01◦32′38′′ E102◦09′53′′ 50 0◦ Entisols O4 Bukit Apit Oil palm plantation more than 15 years oO S01◦43′57′′ E102◦12′06′′ 100 2.5◦ Inceptisol(?) O5 Karang Anyar, Bangko Oil palm plantation (approximately 3 years) yO S02◦04′25′′ E102◦26′39′′ 110 0◦ Ultisol A1 Kuamang Kunin Alang-alang among agricultural and forest area A S01◦36′19′′ E102◦19′30′′ NDb 0◦ Ultisols
A2 Seanamat Alang-alang A S01◦29′30′′ E102◦13′39′′ 70 4◦ Ultisol
A3 Sungai Buluh Alang-alang 3 months after slash-and-burn A S01◦30′53′′ E102◦08′05′′ 100 5◦ Ultisols
A4 Sungai Musawan, Bangko Alang-alang A S02◦04′00′′ E102◦17′54′′ 100 0◦ Ultisol
A5 Sungai Ning Alang-alang A S02◦03′53′′ E101◦21′56′′ 1140 8◦ Andisols
21
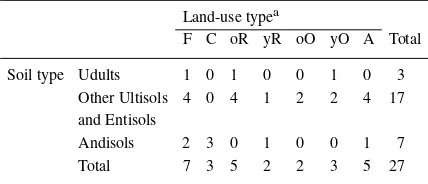
Table 2. Number of plots in each soil type and land-use. Land-use typea
asee Table 1 for the land-use codes.
the gas concentrations with two gas chromatographs, a Shimazu GC-9A and a Shimazu GC-14A. The former was equipped with a thermal conductivity detector for CO2, and a flame ionization detector for CH4, and the latter with an electron capture detector and a pre-cut system for N2O. The standard calibrations of CH4, CO2 and N2O were made using standard gases of 2.01µl CH4l−1, 1994µl CO2l−1, and 0.3µl N2O l−1 (Sumitomo Seika Chemicals Co.), respectively. The contamination and leakage of gases in the vials by the transport are negligible as the result of a test presented in Japan. We calculated the flux by the slope of gas concentrations with the sampling times. The temper-atures in the chamber, in the ambient air (1 m height above the ground), and in the soil (2 cm and 10 cm depth each) were measured with a temperature sensor (Sato Co., SK-1250MC). For each individual chamber flux measurement, we calculated the 90% confidence interval, and defined the minimum detectable flux as that flux at which>67% of the confidence intervals did not include zero (Hutchinson and Livingston 1993; Verchot et al. 1999). The minimum detectable N2O flux was 5.0µg N m−2h−1.
Soil gas sampling
Soil gas samples were taken with a stainless steel tube (3 mm outer diameter and 1 mm inner diameter) at the soil surface and at depths of 5, 10 and 20 cm. Three samples were taken from each site. The gas concen-tration was analyzed with the method used for flux measurement.
Soil sampling and analysis
We collected two soil samples per site. One was a dis-turbed sample for chemical and biochemical analyses, and the other was a volumetric sample for physical analysis. Seven replicates of both types of samples were taken at a depth of 0–5 cm at each site in
prox-imity to the chamber used for gas flux measurement, but at least 30 cm apart from every other chamber. The seven replicates of disturbed soil samples for the chemical and biochemical analyses were mixed thor-oughly and employed for the following experiments. To minimize changes in inorganic nitrogen content caused by fast nitrogen mineralization and nitrifica-tion, we extracted the inorganic nitrogen at the hotel using a 2 M KCl solution on the same day the sample was taken, and later performed an analysis in the laboratory. The residual disturbed soil samples were passed through a 2 mm mesh sieve, and stored in a refrigerator at 4◦C. We measured soil pH (H2O) with 10 g soil in 25 ml deionized water using a glass electrode (Horiba, F-22). Total carbon and nitrogen were determined using an NC analyzer (Sumitomo Chemical Co., NC-800). The available phosphate con-tent was measured using the Bray II method (Olsen and Sommers 1982). The microbial biomass carbon (CBIO) was measured by the chloroform fumiga-tion extracfumiga-tion method (Vance et al. 1987) using a TOC analyzer (Shimazu TOC-5000). With the solu-tion, we determined the nitrogen content using the peroxydisulfate oxidation method and calculated the microbial biomass nitrogen (NBIO) (Sakamoto and Hayashi 1999). The ammonium and nitrate concentra-tions were determined using a flow-injection analyzer (Tecator, Aquatec 5400 analyzer). The net nitrogen mineralization and nitrification rates were measured by the aerobic incubation method (Hart et al. 1994) at 25◦C for 8 weeks.
For physical analysis of the soil, seven replicates of a 100 ml sample of volumetric soil were collected with a 100 ml cylindrical sampling core. We mixed the seven replicates (700 ml total) to determine soil bulk density, water content, and the volumetric proportion of solid, liquid and gas phases. The solid phase pro-portion was calculated by dividing the solid weight by 2.5. The particle distribution was determined by the pipette sampling method (Day 1965).
At each site, we also collected triplicate samples of organic matter from the soil surface within an area of 50 cm2 and then weighed this dry matter in the laboratory.
Statistical analysis
17). Neither the CH4 flux nor the CO2 flux differed significantly with soil type, so we used the data of 27 sites to compare the effects of land-use on these gases. Pasir Mayang Research Site (PMRS), in the north-western part of Jambi province (Ishizuka et al. 2002), furnishes another data set with which to determine the relationship between soil properties and green-house gas emissions. To compare the data at PMRS with the data of this study, we calculated the averaged flux values of nine measurements repeated across five sampling plots (P1, P2, L2, R, and Op), in PMRS for September and October only, between Septem-ber 1997 and March 2002 (Tsuruta et al. unpublished data).
Results
General soil properties (Table 3)
Soil type and soil properties. The properties of An-disols (n = 7) were different from those of the
other soils (n = 20). The soil pH for Andisols (6.18 on average, ranging from 5.66 to 6.85) was higher (P < 0.001) than that of other soils (4.52 on av-erage, with a range of 4.10 to 5.12). The average values of total carbon and nitrogen content in Andisols (92 mg g−1and 7.9 mg g−1, respectively) were larger (P <0.001) than those of the other soils (33 mg g−1 and 2.5 mg g−1, respectively). The average micro-bial biomass carbon and nitrogen content in Andisols (1630 µg C g−1 and 280 µg N g−1, respectively) were larger (P < 0.001) than those of the other soils (740 µg C g−1 and 102 µg N g−1, respect-ively). The bulk density in Andisols (0.63 Mg m−3) was lower (P < 0.001) than that of the other soils (0.94 Mg m−3). The proportion of liquid phase to the whole soil volume in Andisols (51%) is larger (P < 0.002) than that of the other soils (34%). Compared to the other soils (0.60µg g−1d−1), Andisols showed higher (P <0.03) nitrification rate (1.19µg g−1d−1).
Land-use and soil properties. The soil properties at the cinnamon plantation sites were unlike those of the other types of land-use. Because they were all loc-ated in the Andisols areas, the cinnamon plantation sites manifested a relatively higher pH, water con-tent, and proportion of liquid phase, while having a lower bulk density. At the Alang-alang grassland field sites, values were low for soil properties such as the nitrogen mineralization rate, the nitrification
rate, the dry weight of litter layer, the water con-tent and the microbial biomass carbon and nitrogen. These results indicate that the microorganisms in the Alang-alang grassland soils were less active than those in the other land-use types. The oil palm plantation sites had characteristics similar to those of the Alang-alang grassland field sites. At oil palm plantation sites, the bulk density was higher and the proportion of gas phase was lower than that of the other land-use types.
Compared to the other sites (except cinnamon plantation), the forest soil had more microbial biomass carbon and nitrogen, greater nitrogen content, and higher nitrogen mineralization and nitrification rates. The nitrate content, nitrogen mineralization, and ni-trification rate of old rubber plantation were all larger than those of young rubber plantation, a fact suggest-ing that the increase in the microorganisms activity coincided with the growth of rubber trees.
Gas fluxes (Table 4)
The soil temperature at 10 cm depth on Andisols is significantly different from that on other soil types (P < 0.001, Table 4), because the areas of Andisols are located above 800 m elevation and mean annual temperature is thought to be lower than that of low-land area. This low soil temperature on Andisols must affect the microorganisms’ activity and thus we must consider this effect.
CO2. The average CO2 flux was calculated to be 3.65 ± 0.85 g C m−2 d−1 (n = 27), with a range n = 20), the difference is not significant (Table 5, P = 0.204, by Student’st-test). The CO2 flux at oil palm plantation (2.36±0.22,n=5) was significantly smaller than those of the other land-use types (Table 6, P <0.05, by ANOVA).
CH4. The overall average CH4 flux across all land-use types equalled −0.45 mg C m−2 d−1, with the
CH4 flux of the 27 sites ranging from −1.27 to 1.18 mg C m−2 d−1. The average flux across all forest stands, −0.70 ± 0.35 mg C m−2 d−1 (n =
7), was smaller than those of the other land-use types except for the old oil palm plantation (−0.75±
cham-23 Table 3. General soil properties.
Plot Soila Land- pH Total Total C/N NH4 NO3 N-minc Nitrd Biomass Biomass SWCe Bulk WFPSf Litter Soil texture
useb C N C N density Sand Silt Clay
(%) (%) (%)
F1 Ud F 4.32 30.8 2.2 13.8 1.94 3.07 0.50 0.58 651 103 0.35 1.01 59.4 418.5 60.9 17.3 21.9
F2 Ult F 4.10 60.3 4.1 14.7 7.78 7.76 1.33 1.12 1305 148 0.54 0.69 51.4 502.9 28.8 13.7 57.5
F3 Ult F 4.81 37.2 3.1 12.1 5.45 2.14 0.68 0.63 970 169 0.11 1.11 22.6 377.6 63.9 7.6 28.5
F4 Ult F 4.20 25.7 2.5 10.2 5.24 5.11 1.03 1.10 1101 172 0.43 0.93 63.2 193.3 26.0 15.3 58.7
F5 Ult F 4.30 41.7 2.9 14.5 3.98 8.07 0.90 0.67 1039 124 0.34 0.76 37.8 99.1 43.6 18.2 38.2
F6 A F 6.85 47.2 4.1 11.4 5.37 1.16 0.67 0.76 1380 271 0.52 0.88 70.3 80.4 33.6 30.4 36.0
F7 A F 6.06 213.9 16.3 13.1 14.61 4.31 2.36 2.65 3426 553 1.85 0.29 61.9 161.5 34.6 55.6 9.8
C1 A C 5.66 97.2 9.0 10.7 10.36 2.74 1.20 1.37 1540 283 0.98 0.53 65.3 1924. 5 25.2 53.5 21.3
C2 A C 6.10 44.2 4.0 11.1 6.01 1.18 0.54 0.71 961 170 0.72 0.76 78.8 141.2 20.2 31.4 48.4
C3 A C 6.49 129.3 11.2 11.6 12.02 4.77 1.73 1.97 1521 265 1.11 0.47 64.5 56.4 44.4 39.3 16.3
R1 Ud oR 4.16 29.8 2.2 13.2 4.73 4.31 0.50 0.64 616 89 0.34 0.98 55.3 223.4 53.8 15.7 30.5
R2 Ult oR 4.16 33.0 2.3 14.6 5.50 2.61 0.69 0.66 735 107 0.31 0.95 47.1 631.8 46.4 15.4 38.2
R3 Ent yR 4.45 18.0 1.3 14.2 3.02 0.50 0.17 0.23 286 41 0.21 1.20 48.0 280.6 78.2 7.9 13.9
R4 Ult oR 4.47 64.0 4.5 14.1 7.93 4.88 1.51 1.63 1397 166 0.52 0.68 48.2 296.0 13.0 32.0 55.0
R5 Ult oR 4.27 40.1 3.0 13.2 8.41 1.97 0.99 1.10 861 133 0.44 0.84 55.9 74.7 32.7 11.5 55.8
R6 Ult oR 4.43 22.9 2.1 10.8 8.38 0.95 0.39 0.50 795 148 0.84 0.75 90.7 402.6 24.3 43.6 32.1
R7 A yR 6.15 68.9 6.0 11.4 6.05 1.26 0.72 0.84 1568 270 0.82 0.67 75.0 81.7 15.5 59.4 25.1
O1 Ud yO 5.04 11.5 1.0 11.5 4.41 1.06 0.16 0.33 198 32 0.34 1.16 73.1 173.8 48.5 25.6 25.9
O2 Ult oO 4.70 24.4 1.8 13.4 4.63 1.54 0.19 0.28 518 74 0.29 1.08 55.0 205.3 51.5 7.3 41.2
O3 Ent yO 4.63 15.5 1.1 14.0 2.34 0.89 0.26 0.33 309 42 0.16 1.18 35.5 135.6 87.9 7.1 4.9
O4 Inc oO 4.67 38.2 3.3 11.6 3.02 3.30 0.49 0.60 824 119 0.60 0.89 83.1 50.5 16.2 10.5 73.3
O5 Ult yO 4.29 42.9 3.1 14.1 2.85 1.15 0.46 0.66 709 101 0.46 0.93 68.7 215.1 10.9 28.2 61.0
A1 Ult A 4.91 17.6 1.4 13.0 2.00 1.51 0.08 0.21 376 49 0.14 1.05 25.2 136.4 50.7 19.2 30.1
A2 Ult A 4.77 37.6 2.7 14.1 9.77 2.37 0.29 0.41 640 81 0.58 0.77 64.3 139.9 47.7 15.3 31.0
A3 Ult A 5.12 25.5 1.9 13.6 13.80 5.77 0.11 0.02 480 30 0.22 0.91 31.6 19.1 40.2 6.8 53.0
A4 Ult A 4.54 46.5 3.2 14.8 3.22 0.98 0.24 0.37 892 122 0.44 0.87 58.7 105.3 9.5 12.4 77.6
A5 A A 5.97 40.8 3.0 13.8 3.18 0.46 −0.07 −0.01 1047 151 0.51 0.84 64.8 135.7 8.7 22.8 68.5
aA; Andisols, Ud; Udults, Ult; Ultisols except Udults, Ent; Entisols, Inc; Inceptisols.bsee Table 1 for the land-use codes.cNitrogen mineralization rate,dnitrification rate,esoil water content, fwater filled pore space. Units: total C and total N, mg g−1; NH
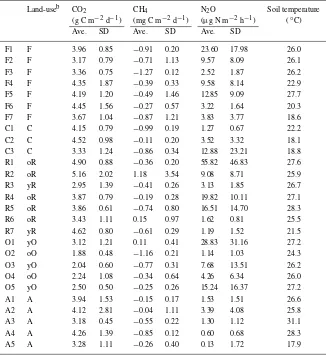
Table 4. The average fluxes of three gas species at each sitea.
Land-useb CO2 CH4 N2O Soil temperature
(g C m−2d−1) (mg C m−2d−1) (µg N m−2h−1) (◦C)
Ave. SD Ave. SD Ave. SD
F1 F 3.96 0.85 −0.91 0.20 23.60 17.98 26.0
F2 F 3.17 0.79 −0.71 1.13 9.57 8.09 26.1
F3 F 3.36 0.75 −1.27 0.12 2.52 1.87 26.2
F4 F 4.35 1.87 −0.39 0.33 9.58 8.14 22.9
F5 F 4.19 1.20 −0.49 1.46 12.85 9.09 27.7
F6 F 4.45 1.56 −0.27 0.57 3.22 1.64 20.3
F7 F 3.67 1.04 −0.87 1.21 3.83 3.77 18.6
C1 C 4.15 0.79 −0.99 0.19 1.27 0.67 22.2
C2 C 4.52 0.98 −0.11 0.20 3.52 3.32 18.1
C3 C 3.33 1.24 −0.86 0.34 12.88 23.21 18.8
R1 oR 4.90 0.88 −0.36 0.20 55.82 46.83 27.6
R2 oR 5.16 2.02 1.18 3.54 9.08 8.71 25.9
R3 yR 2.95 1.39 −0.41 0.26 3.13 1.85 26.7
R4 oR 3.87 0.79 −0.19 0.28 19.82 10.11 27.1
R5 oR 3.86 0.61 −0.74 0.80 16.51 14.70 28.3
R6 oR 3.43 1.11 0.15 0.97 1.62 0.81 25.5
R7 yR 4.62 0.80 −0.61 0.29 1.19 1.52 21.5
O1 yO 3.12 1.21 0.11 0.41 28.83 31.16 27.2
O2 oO 1.88 0.48 −1.16 0.21 1.14 1.03 24.3
O3 yO 2.04 0.60 −0.77 0.31 7.68 13.51 26.2
O4 oO 2.24 1.08 −0.34 0.64 4.26 6.34 26.0
O5 yO 2.50 0.50 −0.25 0.26 15.24 16.37 27.2
A1 A 3.94 1.53 −0.15 0.17 1.53 1.51 26.6
A2 A 4.12 2.81 −0.04 1.11 3.39 4.08 25.8
A3 A 3.18 0.45 −0.55 0.22 1.30 1.12 31.1
A4 A 4.26 1.39 −0.85 0.12 0.60 0.68 28.3
A5 A 3.28 1.11 −0.26 0.40 0.13 1.72 17.9
aMeans of 7 replicates.
bSee Table 1 for the land-use codes.
Table 5. The averaged fluxes of three greenhouse gases in each soil type.
Soil type Number of sites CO2 CH4 N2O
(g C m−2d−1) (mg C m−2d−1) (µg N m−2h−1)
Ave. SD Ave. SD Ave. SD
Andisols 7 4.00 0.57 −0.57 0.35 3.7 4.3
Ultisols Udults 3 3.99 0.89 −0.39 0.51 36.1 17.3
othersa 17 3.44 0.91 −0.41 0.56 7.0 6.1
Total 27 3.65 0.85 −0.45 0.50 9.4 12.0
aIncluding two Entisols sites.
bers (7 chambers× 27 sites), 32 chambers showed positive CH4 flux; moreover, all land-use types had some chambers showing a positive flux. We observed no significant difference in CH4flux between Andisols and the other soils (Table 5).
N2O. The overall average across all sites was 9.4 µg N m−2 h−1, with a range of 0.13 to 55.8 µg N m−2 h−1. The average flux of N
25
Table 6. The averaged CO2and CH4flux of each land-use type. Land-use Number of CO2flux CH4flux typea cases Average S.D. Average S.D.
F 7 3.88 0.50 −0.70 0.35
aSee Table 1 for the land-use codes.
were hot spots that produce high N2O fluxes (data not shown). The N2O fluxes of Udults (23.6, 55.8 and 28.8µg N m−2h−1for F1, R1 and O1, respectively) were higher than those of the other soils (Table 5). The N2O fluxes for the old rubber (except R1, 11.8
±8.1µg N m−2h−1,n = 4) and for the young oil palm plantation (except O1, 11.5±5.3µg N m−2h−1, n = 2) were relatively larger than those of the other
land-use types (Table 7). Alang-alang grassland field (1.39±1.25µg N m−2h−1,n=5) and young rubber
plantation (2.16±1.37µg N m−2h−1,n=2) showed
relatively lower N2O fluxes than did the other land-use types (Table 7).
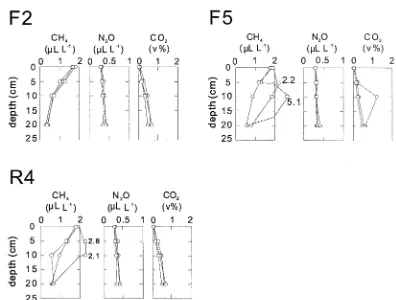
Soil gas. In almost all profiles, the CH4 concentra-tion decreased and the N2O and CO2 concentrations increased at greater soil depths. The typical patterns of each gas concentration with depth are shown in Figure 2. High CH4 concentrations, greater than 1.8
µm3m−3, were observed at depths of 5 cm (F5, O1, A1 and C3), 10 cm (F4, F5 and A3), and both 5 and 10 cm (R4, R6). At oil palm plantation sites, the dis-parity between gas concentrations at the surface and at 5 cm depth was greater than those at the other land-use types (Figure 2).
Comparison of soil properties and gas fluxes between PMRS and the 27 sites in this study
The summary of soil properties and averaged gas fluxes in PMRS is shown in Table 8. The soil at PMRS revealed significant differences from the soils at the 27 sites in this study. The soil at PMRS had relatively lower values in water content, nitrification rate, and microbial biomass nitrogen, while at the same time having higher values in ammonium nitrogen content, dry weight of the litter layer, and gas phase proportion
Table 7. The averaged N2O emission of each land-use typea. Land-use typeb Number of cases N2O flux
Average S.D.
aWithout the data on Andisols and Udults. bSee Table 1 for the land-use codes.
(P < 0.05, by ANOVA). This result indicates that at PMRS the stress to the microorganisms arising from dry soil conditions leads to the suppression of micro-bial activities such as nitrification and decomposition of litter layer, in turn resulting in the accumulation of ammonium and of litter layer.
The CO2flux in PMRS (1.87±0.34 g C m−2d−1) was significantly smaller than the overall CO2flux of the 27 sites in this study (P <0.001 by Student’st-test). The N2O flux at PMRS (2.9±1.7µg N m−2h−1) is lower than the overall value of the 27 sites in this study (7.0±6.1µg N m−2h−1,n = 17, except for those
at the sites with Andisols and Udults). The average CH4 flux in PMRS (−0.21± 0.25 mg C m−2 d−1) was larger than the average of the 27 sites in this study (−0.45±0.50 mg C m−2d−1).
Discussion
N2O emissions
The intensity of N2O flux on forest stands, 9.3 µg N m−2 h−1 (n = 7) (equivalent to
Figure 2. The profile of soil gas concentration at F2 (upper left), F5 (upper right), and R4 (lower left). The data are shown in triplicate profiles for each site. The profile like at F2 was normally observed, while the kind of profile like at F5 and R4, which showed high CH4concentration at 5 cm and/or 10 cm depth, was irregularly observed.
The N2O fluxes differed according to soil type. We observed the highest emissions under wet conditions, such as those at F1, R1 and O1. Furthermore, the N2O fluxes in PMRS, with its relatively drier conditions, were lower than those of the other sites. These results indicate that in this area the N2O fluxes are mainly determined by soil moisture which affected both the nitrification and denitrification rates. According to the hole-in-the-pipe model, WFPS affects the ratio of N2O and NO. The lower WFPS, the higher the ratio of NO to N2O (Davidson et al. 2000a). We calculated the re-lationship between the sum of NO and N2O emissions estimated by WFPS (Davidson et al. 2000a) and nitri-fication rate, but there was no significant relationship (R = 0.125, α = 0.54). The sites having less than 20% or higher than 75% WFPS had low N2O fluxes (Figure 3), this result suggesting that in the former NO and the latter N2 is the dominant gas as nitrogenous gas loss. The fluxes between 20% and 75% WFPS scattered, this result suggesting that WFPS is not a dominant factor to control N2O emission in these soils.
Figure 3. The relationship between soil WFPS and N2O flux at 27 sampling sites in each soil type.
compar-27
Table 8. Summary of soil characteristics at Pasir Mayang at 0–5 cm depth and gas fluxesa. Plot name
P1 P2 L2 Op R
Land-use typeb F F F A yR
pH 4.38 3.91 3.73 4.43 4.59
Total C (mg g−1) 21.2 21.4 23.0 33.5 19.5
Total N (mg g−1) 1.1 1.3 1.4 2.2 1.9
C/N 19.1 16.5 15.9 15.5 10.0
NH4 (µg g−1) 7.9 7.2 6.0 10.6 10.5
NO3 (µg g−1) 3.3 1.6 1.6 1.7 1.7
N-minc (µg g−1d−1) 0.26 0.52 0.43 0.47 0.29
Nitrd (µg g−1d−1) 0.03 0.26 0.30 0.27 0.01
Biomass C (µgC g−1) 936 770 712 628 221
Biomass N (µgN g−1) 55 79 73 54 29
SWCe (kg kg−1) 0.149 0.174 0.161 0.233 0.405
Bulk density (Mg m−3) 1.00 0.75 0.82 0.80 0.76
WFPSf (%) 23.2 24.1 25.7 33.0 42.9
Litter (g m−2) 972 NDh 1518 1221 833
Soil texture Sand (%) 66.0 NDh 73.7 64.6 32.6
Silt (%) 15.8 NDh 15.2 10.8 43.3
Clay (%) 18.2 NDh 11.2 24.6 24.0
CO2fluxg (g C m−2d−1) 1.69 2.21 2.00 1.38 2.10 CH4fluxg (mg C m−2d−1) −0.24 0.18 −0.50 −0.14 −0.34 N2O fluxg (µg N m−2h−1) 2.60 4.33 4.93 1.71 0.86 aSummarized data of Ishizuka et al. (2002) with additional data at PMRS.
bSee Table 1 for the land-use codes. cNet nitrogen mineralization rate. dNet nitrification rate.
eSoil water content. fWater filled pore space.
gThe averaged flux for September and October only between Sept. 1997 and March 2002. hNot determined.
able with that in the previous report (Figure 4, Matson and Vitousek 1987; Keller et al. 1988; Livingston et al. 1988; Ishizuka et al. 2000), calculated by the following equation:
F =9.256×NR+0.4993(R2=0.7822) (1) where F is N2O flux (µg N m−2 h−1) and NR (µg N g−1 d−1) is nitrification rate. This result sug-gests that in tropical forests throughout the world, nitrification is an important rate limiting process to cause N2O emission not only from the nitrification process but also from the denitrification process by providing nitrate as the substrate. It also suggests that the low N2O fluxes in these sites result from the low net nitrification rates, whose average, 5.3±
4.2µg N/g/7d, was relatively lower than at the other sites (net nitrification rate in Figure 4 in Davidson et al. 2000a). There are, however, two exceptions in the relationship between the N2O flux and the
nitrific-ation rate. The first is the sites on Andisols, which had a much lower correlation coefficient. The coefficient for Andisols, including Japanese Andisols (Ishizuka et al. 2000), was one-seventh of that of the other soils (Figure 4), and is expressed as the following equation:
FA=1.377×NRA+1.941(R2=0.4187) (2)
whereFA (µg N m−2h−1) andNRA(µg N g−1d−1)
are the N2O flux and the nitrification rate in Andisols, respectively. One reason for this low correlation coef-ficient is that the N2O flux on Andisols was measured under relatively lower temperature. The mean tem-perature of these Andisols (including 16.4◦C with Japanese Andisols; Ishizuka et al. 2000) was 19.2◦C,
which was 7.4◦C lower than that of the other soils. If
Figure 4. The relationship between nitrification rate and N2O flux throughout the world. The solid line indicates the regression incor-porating all data except Andisols and Udults (R1, F1, and O1) in tropical forests. The dashed line indicates the regression using the data of Andisols, including the data of Japanese Andisol.
microbial process; there may be another reason for the lower N2O fluxes in these Andisols. Another import-ant nitrogenous gas, NO, could possibly account for the main part of gaseous loss of nitrogen from An-disols (Akiyama et al. 2000). But this supposition is questionable, however, because the WFPS of these Andisols, ranging from 61.5% to 77.5% (Figure 3), is the ideal value for N2O to be the dominant gas in gaseous nitrogen loss (Davidson et al. 2000a). In any case, we need more intensive research to clarify the mechanisms of N2O emission from Andisols.
The second exception in the relationship between the N2O flux and the nitrification rate is the high emis-sion rates at R1, F1 and O1 (Table 5, Figure 4), where the observed N2O flux exceeds the value calculated by regression Equation 1. This result indicates that in some places with wet conditions, such as Udults, the N2O was derived from the denitrification processes.
CH4uptake/emission
Our results on CH4uptake rate (0.70±0.35 mg C m−2 d−1, n = 7) in forest stands were comparable with
those in the previous report (0.79±0.12 mg C m−2d−1;
Potter et al. 1996). The estimate based on soil tex-ture classification by Dörr et al. (1993), designated as medium or coarse for the soils in this study, ranged from 0.33 to 1.07 mg C m−2 d−1, suggesting that the estimate of CH4 uptake rate in Southeast Asia is reasonable.
CH4 emission from unknown sources may have an impact on these flux values, because 17% of total chambers showed positive flux. The sudden increase of CH4concentrations in the soil gas profiles (for ex-ample, at the depth of 5 and 10 cm at F5 (Figure 2)) suggests the presence of a CH4 source at subsurface soil. At F4 and F5, the CH4concentration at the depth of 5 cm was smaller than that in the ambient air, for a profile having a high CH4concentration at a depth of 10 cm. This fact suggests that the emitted CH4at 10 cm depth was partly oxidized by the methanotrophs in the upper soil layers, thus resulting in the negative CH4flux at the soil surface. It follows from this result that the negative fluxes (an indication of CH4 uptake by the soil), in certain cases, were also possibly af-fected by CH4 emissions in the layer below. At R4 and R6, the CH4concentration at the depth of 5 cm was larger than that in the ambient air for the same profile, showing high CH4concentration at the depth of 10 cm. This pattern suggests that the oxidation po-tential in the surface layer is insufficient for oxidizing the entire quantity of CH4emitted in the layer below.
Possibly owing to this ‘noise’ of CH4source, the relationship between soil properties and CH4 uptake rate was obscure. Many researchers have found a good correlation between CH4 uptake rate and soil properties, for example ammonium content (King and Schnell 1994), diffusion coefficient (Keller and Rein-ers 1994), and clay content (Ishizuka et al. 2002), but we did not find a good correlation with soil properties in this study (for example, the correlation coefficient with ammonium nitrogen, diffusion coefficient estim-ated by pore space, and clay content was −0.133,
0.135, and−0.242, respectively).
29
future research to identify the ratio of CH4emission from termites to the oxidation by the soil (Sugimoto et al. 1998). This would help us better understand the relationship between CH4uptake rate by soils and soil properties, such as the soil texture or the proportion of soil gas phase.
We can present plausible explanations as to why the CH4fluxes in PMRS were lower than those in this study: termite density is high, especially in primary forest, in PMRS. Positive CH4flux was invariably de-tected at the forest sites in PMRS, although the soil had relatively high potential to oxidize CH4(Tsuruta et al., unpublished data). If the impact of termites in PMRS was greater than that in the area outside of PMRS, then the value for the CH4uptake rate in PMRS was low. It is consistent to assume that high CH4emission from termites in PMRS increased the soil CH4 concen-tration and reduced apparent CH4 uptake rate. High positive CH4 fluxes of more than 2 mg C m−2 d−1 were irregularly observed at old rubber plantation and forest stands in this study; the result implies that the density of termites depends on the stability of land-use or the aboveground biomass of the trees. According to this hypothesis, the forest in PMRS had not been affected by human activity for a long time and this stability of land-use may contribute to the high density of termites in PMRS. The effect of termites on global warming was not considered significant with regard to methane production worldwide (Eggleton et al. 1999; Verchot et al. 2000), but our result, that even the sites showing negative CH4flux were possibly affected by termites, seems to impose that the termite effect to CH4uptake rate in such terrestrial ecosystems is more significant.
CO2emission
The CO2 emission rate was comparable with that of a previous report (Raich and Schlesinger 1992). The estimated values for this study, ranging from 3.25 to 3.86 g C m−2d−1, can be obtained with the following equation (Raich and Schlesinger 1992):
SRa=9.26×Ta+0.0127×Ta×Pa+289, (3)
whereSRa(g C m−2y−1) is the annual soil respiration rate,Ta(◦C) is the mean annual air temperature (25◦C in this area) andPa(mm) is the mean annual precip-itation (from 2100 to 2800 mm for this area). Lower values, ranging from 1.2 to 2.2 g C m−2d−1, were re-ported in the previous report on PMRS (Ishizuka et al. 2002), but our study suggests that the value obtained
at PMRS showed lower emission rates because of the dry soil conditions. The value at PMRS is one of the variations of this area, and the averaged flux in this province should be raised to 3.3 g C m−2d−1, a fig-ure which supports the results of the previous report (Raich and Schlesinger 1992).
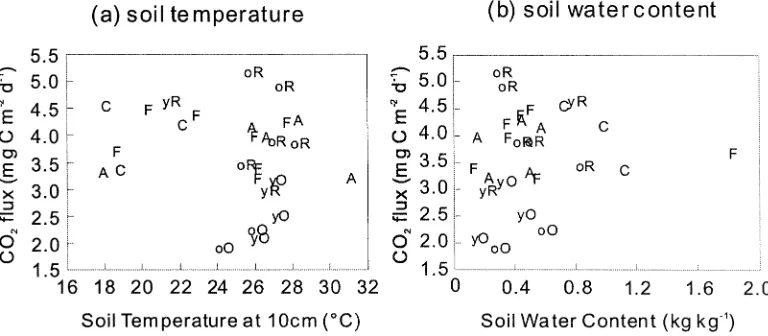
The effect of temperature and soil water content is not clear. There is no apparent relationship between soil water content and CO2flux (Figure 5). One reason is that we cannot produce matric potential data to com-pare the relationship as shown in the previous report (Davidson et al. 2000b). The sites on Andisols had low soil temperature (from 18◦C to 23◦C with an av-erage of 19.8◦C), but the CO2flux is relatively larger than that of the other sites having high soil temperat-ure (from 23◦C to 31◦C with an average of 26.6◦C). Because the CO2fluxes on Andisols may reflect this relatively cool temperature, the potential CO2flux on Andisols under the same temperature as the lowland area may be higher than that of the other soil types. The effects of temperature and soil water content were also confounded in these soils with different soil type and different soil temperature.
Chronosequence analysis with land-use/cover change
We can present some hypotheses about the effect of land-use change, conversion of forest to rubber plant-ation, oil palm plantplant-ation, and abandoned grassland field by a chronosequence analysis under the assump-tion that there is not so much seasonal fluctuaassump-tion in each flux as shown in PMRS (Tsuruta et al., this is-sue). Because these hypotheses are obtained from one sampling at one point in time, the hypothesis must be confirmed by more frequent sampling in the future. This study may be the first report to deal with the conversion from tropical forests to rubber plantation and oil palm plantation.
Figure 5.The relationship between soil temperature (a) and CO2flux and between soil water content and CO2flux (b). Plotting symbols indicate the land-use code (see Table 1). The group of lower soil temperature less than 23◦C in (a) belongs to the sites in the mountainous area above 800 m elevation, which are on Andisols.
emission in a few decades to the level similar to that of the forest stands was not comparable with their result. Our result suggests that in the long term con-version from tropical forest to rubber plantation could have little effect on N2O emission. Of course, because deforestation and/or biomass burning should have a pronounced impact on N2O emissions in the short term (Ishizuka et al. 2002) and in the long term (Keller et al. 1993), and the future usage of the rubber planta-tion site is still obscure, we have to consider the total effect of the land-use change from forests to rubber plantation.
The CH4uptake rate for the old rubber plantation (Table 6) was largest in all land-use types. Positive CH4 flux was observed in 7 of 35 chambers, with highest CH4emission of 8 mg C m−2d−1. The most frequent range was−1.0 to−0.5 mg C m−2d−1; 15
chambers belonged to this range. This result indicates that the growth of rubber trees coincides with the in-crease of a hot spot of CH4emission. It is possible to assume the increase of this hot spot by the increase of termite density, but we have no data to support this. However, the land-use change from forest to rubber plantation might cause little decrease in CH4 uptake rate in the long term.
Young oil palm plantation had a higher N2O flux than did forest stands (Table 7), while old oil palm plantation had a value lower than that of forest stands. This high N2O emission from young oil palm planta-tion is considered as the result of fertilizer and nitrogen fixation by the legume crops in young oil palm like the legume-rich forest (Davidson et al. 2000a). The
disappearance of legume crop and increase of nitro-gen uptake by old oil palm may result in the low N2O flux in old oil palm plantation. The low N2O flux for old oil palm plantation (Table 7) suggests that in the long term, i.e., more than 10 years, the N2O flux will decrease at the oil palm plantation.
The change in the CH4 uptake rate following the conversion of forest to oil palm plantation exhibited a trend opposite to that of rubber plantation (Table 6). The CH4uptake rate decreased for several years after oil palm plantation, although the growth of oil palm coincided with an increase in the CH4uptake rate. The change in land-use from forest to oil palm plantation might produce little change in CH4uptake rate in the long term (more than 10 years).
The CO2fluxes for young and old oil palm plant-ation were the smallest among all land-use types (Table 6), a finding that suggests that the conversion from any land-use to oil palm plantation will decrease the CO2 flux. At oil palm plantation, the soil was compacted by intense human activities, giving the soil relatively higher bulk densities. This increased density resulted in less undergrowth and litter layer at oil palm plantation. In addition to the land reform by heavy equipments before oil palm plantation, the lack of the respiration of undergrowth and litter layer makes the CO2efflux from the soil surface smaller than that from the other land-use types.
31
flux and CH4uptake rate. The CO2flux at the Alang-alang grassland field was the same as the flux at the forest stands, a fact suggesting that the conversion from forests to the Alang-alang grassland field will have little effect on CO2flux.
Conclusions
Measurements of the fluxes of three greenhouse gases in Jambi Province, Sumatra, Indonesia were updated. The CO2flux ranged from 1.38 to 5.16 g C m−2d−1 (3.65 g C m−2 d−1 on average), a range twice as large as the value previously reported for this area, but comparable with that in the report by Raich and Schlesinger (1992). The CH4flux ranged from−1.27 to 1.18 mg C m−2 d−1 (−0.70 mg C m−2 d−1 on
average for forest stands), values in the range of the previous estimates by Dörr et al. (1993). A significant reduction in the CH4uptake rate arose from CH4 emis-sions from unknown source, possibly termites. The N2O flux ranged from 0.13 to 55.8 µg N m−2 h−1 (9.3 µg N m−2 h−1 on average for forest stands), which was larger than the value previously reported for this area, but was relatively smaller than those of other humid tropical forests. The low N2O flux can be attributed to both the low nitrification rate in this area, and the low proportion of released N2O to measured nitrification in Andisols. We presented some hypo-theses about the effect of land-use change, but because these hypotheses were obtained from one sampling at one point in time, further tests are required for verification.
Acknowledgements
This study was managed under the project titled ‘The impact of land-use/cover change in terrestrial ecosys-tems of tropical Asia on greenhouse gas emissions’ in the ‘Global Environmental Research Program’ sup-ported by a grant from the Ministry of the Environ-ment, Japan. We thank Mr Zuhdi and Mr Ermadani of Jambi University for their kind assistance in the field work. We extend our thanks to the staffs at ICRAF in Muarabungo and at IPB in Bogor. We also thank the assistants, Ms Banzawa, Ms Yoshizawa, Ms Matsuoka in NIAES, Ms Takeuchi in FFPRI, and Mr Chris Perry for proofreading.
References
Achard F., Eva H.D., Stibig H., Mayaux P., Gallego J., Richards T. and Malingreau J. 2002. Determination of deforestation rates of the world’s humid tropical forests. Science 297: 999–1002. Akiyama H., Tsuruta H. and Watanabe T. 2000. N2O and NO
emissions from soils after the application of different chemical fertilizers. Global Change Sci. 2: 313–320.
Born M., Dorr H. and Levin I. 1990. Methane consumption in aerated soils of the temperate zone. Tellus 42A: 2–8.
Bouwman A.F., Fung I., Matthews E. and John J. 1993. Global ana-lysis of the potential for N2O production in natural soils. Global Biogeochem. Cycles 7: 557–597.
Breuer L., Papen H. and Butterbach-Bahl K. 2000. N2O emission from tropical forest soils of Australia. J. Geophys. Res. 105: 26353–26367.
Cicerone R.J. and Oremland R.S. 1988. Biogeochemical aspects of atmospheric methane. Global Biogeochem. Cycles 2: 299–327. Davidson E.A., Keller M., Erickson H.E., Verchot L.V. and
Veldkamp E. 2000a. Testing a conceptual model of soil emissions of nitrous and nitric oxides. BioScience 50: 667–680.
Davidson E.A., Verchot L.V., Cattânio J.H., Ackerman I.L. and Carvalho, J.E.M. 2000b. Effects of soil water content on soil respiration in forests and cattle pastures of eastern Amazonia. Biogeochemistry 48: 53–69.
Day P.R. 1965. Particle fractionation and particle-size analysis. In: Black C.A., Evans D.D., Ensminger L.E., White J.L. and Clark F.E. (Eds) Methods of Soil Analysis Part 1 – Physical and Min-eralogical Properties, Including Statistics of Measurement and Sampling. American Society of Agronomy, Inc., Madison, WI, pp. 545–567.
Dörr H., Katruff L. and Levin I. 1993. Soil texture parameterization of the methane uptake in aerated soils. Chemosphere 26: 697– 713.
Eggleton P., Homathevi R., Jones D.T., MacDonald J.A., Jeeva D., Bignell D.E., Davies R.G. and Maryati M. 1999. Termite assemblages, forest disturbance and greenhouse gas fluxes in Sabah, East Malaysia. Phil. Trans. Royal Soc. London Ser. B – Biol. Sci. 354: 1791–1802.
Hart S.C., Stark J.M., Davidson E.A. and Firestone M.K. 1994. Nitrogen mineralization, immobilization, and nitrification. In: Weaver R.W., Angle J.S. and Bottomley P.S. (Eds) Methods of Soil Analysis Part 2 – Microbiological and Biochemical Prop-erties. Soil Science Society of America Inc., Madison, WI, pp. 985–1018.
Hutchinson G.L. and Livingston G.P. 1993. Use of chamber systems to measure trace gas fluxes. In: Harper L.A. (Ed) Agricultural Ecosystem Effects on Trace Gases and Global Climate. Am. Soc. Agron., Madison, WI, pp. 63–78.
IPCC 1995. Summary for policymakers: radiative forcing of cli-mate. In: Houghton J.T., Meira Filho L.G., Bruce J., Hoesung Lee, Callandar B.A., Haites E., Harris N. and Maskell K. (Eds) Climate Change 1994 Radiative Forcing of Climate Change and An Evaluation of the IPCC IS92 Emission Scenarios. Cambridge University Press, Cambridge, MA, pp. 72–126.
Ishizuka S., Tsuruta H. and Murdiyarso D. 2002. An intensive field study on CO2, CH4and N2O emissions and soil properties at four land-use types in Sumatra, Indonesia. Global Biogeochem. Cycles 16: 1049; doi:10.1029/2001GB001614.
Ishizuka S., Sakata T., Tanikawa T. and Ishizuka K. 2000. N2O emission and spatial distribution in a Japanese deciduous forest. J. Jpn. For. Soc. 82: 62–71.
succes-sion of pasture to forest in the Atlantic lowlands of Costa Rica. Global Biogeochem. Cycles 8: 399–409.
Keller M., Veldkamp E., Weitz A.M. and Reiners W.A. 1993. Effect of pasture age on soil trace-gas emissions from a deforested area of Costa Rica. Nature 365: 244–246.
Keller M., Kaplan W.A., Wofsy S.C. and DaCosta J.M. 1988. Emis-sions of N2O from tropical forest soils: response to fertilization with NH4, NO3and PO4. J. Geophys. Res. 93: 1600–1604. King G.M. and Schnell S. 1994. Effect of increasing atmospheric
methane concentration on ammonium inhibition of soil methane consumption. Nature 370: 282–284.
Livingston G.P., Vitousek P.M. and Matson P.A. 1988. Nitrous oxide flux and nitrogen transformations across a landscape gradient in Amazonia. J. Geophys. Res. 93: 1593–1599.
Matson P.A. and Vitousek P.M. 1987. Cross-system comparisons of soil nitrogen transformations and nitrous oxide flux in tropical forest ecosystems. Global Biogeochem. Cycles 1: 163–170. Murdiyarso D. and Wasrin U.R. 1995. Estimating land use change
and carbon release from tropical forests conversion using remote sensing technique. J. Biogeograph. 22: 715–721.
Olsen S.R. and Sommers L.E. 1982. Phosphorus. In: Page A.L., Miller R.H. and Keeney D.R. (Eds) Method of Soil Analysis Part 2 – Chemical and Microbiological Properties, Second Edition. American Society of Agronomy, Inc., Madison, WI, pp. 403– 430.
Potter C.S., Davidson E.A. and Verchot L.V. 1996. Estimation of global biogeochemical controls and seasonality in soil methane consumption. Chemosphere 32: 2219–2246.
Prather M., Ehhalt D., Dentener F., Derwent R., Dlugokencky E., Holland E. et al. 2001. Atomospheric chemistry and greenhouse
gases. In: Houghton J.T., Ding Y., Griggs D.J., Noguer M. van der Linden P.J., Dai X., Maskell K. and Johnson C.A. (Eds) Climate Change 2001: The Scientific Basis. Contribution of Working Group I to the Third Assessment Report of the Inter-governmental Panel on Climate Change. Cambridge University Press, Cambridge, UK, pp. 239–287.
Raich J.W. and Potter C.S. 1995. Global patterns of carbon dioxide emissions from soils. Global Biogeochem. Cycles 9: 23–36. Raich J.W. and Schlesinger W.H. 1992. The global carbon
diox-ide flux in soil respiration and its relationship to vegetation and climate. Tellus 44B: 81–99.
Sakamoto K. and Hayashi A. 1999. A rapid method for determin-ing the microbial biomass-N in soil – Determination of total-N in soil extract by peroxydisulfate oxidation method – Soil Microorganisms 53: 57–62.
Sugimoto A., Inoue T., Kirtibutr N. and Abe T. 1998. Methane oxidation by termite mounds estimated by the carbon isotopic composition of methane. Global Biogeochem. Cycles 12: 595– 605.
Vance E.D., Brooks P.C. and Jenkinson D.S. 1987. An extrac-ted method for measuring soil microbial biomass C. Soil Biol. Biochem. 19: 703–707.
Verchot L.V., Davidson E.A., Cattânio J.H. and Ackerman I.L. 2000. Land-use change and biogeochemical controls of methane fluxes in soils of eastern Amazonia. Ecosystems 3: 41–56. Verchot L.V., Davidson E.A., Cattânio J.H., Ackerman I.L.,