Trop. For. Manage. J. VII (2) : 63-73 (2001)
STUDY ON THE USE OF
SMALL FORMAT NON-METRIC AERIAL PHOTOS
FOR ESTABLISHING AERIAL TEAK STAND VOLUME TABLE
(
A case study in Randublatung Forest Management Unit,
PT. Perhutani Unit I, Central Java
)
AGUNG BUDI CAHYONO1), I NENGAH SURATI JAYA2) and BAMBANG SAPTO PRATOMOSUNU3)
ABSTRAK
Penelitian ini mengkaji tentang pemanfaatan foto udara non-metrik format kecil (SFNAP) guna menyusun tabel volume udara tegakan jati (aerial stand volume table of teak wood) di KPH Randublatung, Perum Perhutani Unit I, Jawa Tengah. Sebagai perbandingan, pengkajian terhadap penggunaan potret udara metrik konvensional (CAP) juga dilakukan. Hasil penelitian menunjukkan bahwa secara teknis SFNAP layak digunakan untuk mengestimasi potensi tegakan sebagaimana ditunjukkan oleh hasil tes statistik. Model terbaik untuk estimasi volume tegakan jati menggunakan SFNAP di lokasi penelitian adalah V = 52,4 – 0,469 C (r2 = 76,2%), sedangkan model terbaik menggunakan CAP adalah V = 32,4 – 0,246 C (r2 = 69,1%).
INTRODUCTION
During the last three decades, forest as a natural resource given a significant
contribution to the Indonesia’s economic growth. To keep its existence and sustainability,
it should be well managed. This forest resource can only be well managed when supported by accurate and reliable data that could be detected through forest inventory. Due to the vastness of the forest area, the terrestrial inventory method is usually cost consuming. Alternatively, the application of remote sensing technique through the application of aerial photographs and satellite imagery followed by adequate ground checking are more preferable. In Java, teak wood (Tectona grandis L.f) has been long time as a main forest product that consumed by most of population either for their life or for industrial intake. Randublatung forest management unit (Kesatuan Pemangkuan Hutan/KPH), is one of the concession areas of PT. Perhutani that recently sufferred from illegal cutting. To monitor and inventory the remaining forest stand in accurate and speedy manner, there is a need to use remote sensing technique, particularly using large scale of aerial photos.
1) Scientist and lecturer at the Geodetic Department, Sepuluh November Institute of Technology (ITS), Surabaya 2) Scientist and lecturer at the Faculty of Forestry, Bogor Agriculture University
Now, availability of non-metric cameras, which technically become more and more sophisticated, provided an opportunity that aerial photos with a small format could be able to substitute conventional aerial photos (CAP) usually taken with metric cameras.
To support the government programs in natural resources inventory (NRI), especially for production forest, now, PT. Perhutani had established forest mapping and inventory programs using SFNAP. The work presented in this research was a part of the work initiated by the cooperation between PT. Waindo SpecTerra and the Geodetic Engineering Department, Gadjah Mada University on Forest Mapping Project using small format aerial photos. It is expected that the result of SFNAP would be applicable in forest inventory, such as estimating stand or tree volumes.
The small format non-metric aerial photos (SFNAP) used in this study is aerial photos taken from small/light aircraft using 35 mm or 70 mm type camera and has standard picture format of 2.4 x 3.6 cm or 5.5 x 5.5 cm. Warner et al (1996) noted that small format aerial photography provides a low-cost source of aerial photo with simple technology. It could be applied when aerial photos are needed immediately at a low cost, e.g. disaster mitigation (flooding, earthquakes). Jaya and Cahyono (2001) found that the SFNAPs are feasible to be used for forest interpretation. In particular, planners, managers and decision-makers need an up-to-date data to monitor and control the developments in fast changing areas (e.g. urban and sub-urban areas). The small format image quality depend on: (1) the subject, which will have certain qualities, such as terrain contrast, lighting and atmospheric haze; (2) the camera lens quality; (3) the type of film used,
granularity and tonal quality; (4) the exposure and film processing; (5) the degree of
apparent image motion and (6) the print quality.
Objectives
The main objective of this study is to evaluate the technical applicability of Small Format Non-metric Aerial Photograph in establishing aerial stand volume table of teak forest in comparison with the CAP.
METHODS
Study area and data
Major of the study area is part located in Banjarrejo, Kradenan and Randublatung, Jati Districts, Regency of Blora, while the rest is located in Gabus District, Regency of Grobogan, Forest Management Unit (KPH) Randublatung Central Java. The areas extend
from 111°20’ to 111°28’ East longitude (Perum Perhutani, 1993), and from 7°10’ to 7°15’
South latitude. This research was conducted from February to August 2001.
Randublatung Forest Management Unit (Kesatuan Pemangkuan Hutan/KPH), Bekutuk and Ngliron Forest Division (Bagian Hutan / BH).
Tools and equipment used were light aircraft (KitFox™ series 5 voyager) with 3 passengers, camera Canon EOS 1000, stereoscope, parallax bar, micrometer wedge, crown density scale, measuring tape, compass, hagameter and GPS Garmin 38.
Data processing were used are Arc View for processing SDH-PDE, ERMapper 6,0, MapInfo 5, Ozy Explorer, AutoCAD 2000, Transform (Geodetic Department, UGM) for UTM - Polyeder transformation, Minitab 11 for statistic calculation, Excel and Microsoft Word 2000 for reporting.
General Procedures
SFNAP data acquisition
The procedure of data acquisition was adopted from the work of PT. Waindo SpecTerra in collaboration with the Geodetic Engineering Department, the University Gadjah Mada on Forest Mapping Project using small format aerial photos. According to Haryuatmanto (1995), the procedure of data collection using small format non-metric aerial photography technique, includes (1) data recording using 35 mm camera, (2) making ground control using GPS-Video and (3) photo acquisition. The specifications of SFNAP are as follows:
small format non-metric aerial photo 35 mm
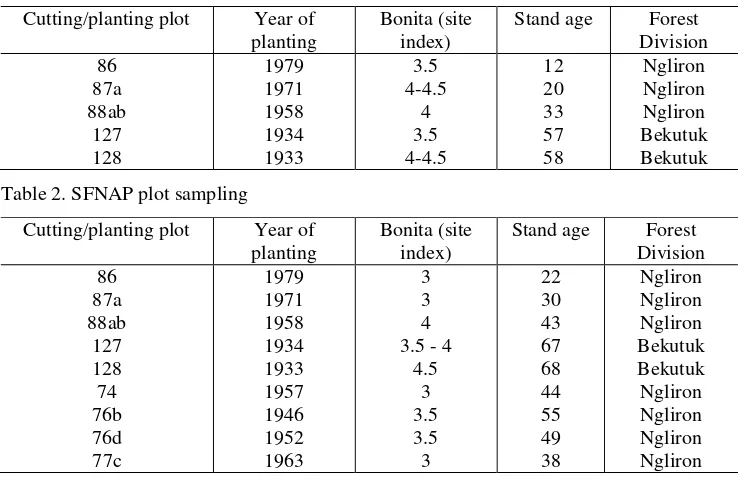
Table 1. CAP plot sampling
Cutting/planting plot Year of planting
Table 2. SFNAP plot sampling
Cutting/planting plot Year of planting
To establish the regression model expressing the relationship between stand variables and stand volume, the plots interpreted in the SFNAP were also checked in the fields. The field measurements were done between April and June 2001. For 26 sample plots measured on the CAP, the field data were derived from the tally sheet collected by PT. Perhutani in 1991. It should be noted that the CAPs were taken 1992. The ground activities covered in this research are measurement of tree height, tree diameter, and counting of tree number per plot. The tree height from the base until top of the tree crown was measured using hagameter. The diameter of tree was measured at the breast height. These variables are used to predict the total tree volume based on Local Volume Table.
The sampling plots were selected using systematic sampling with random start. The 0.1-ha ground sample plots were laid out across the stand, in which the distance between plot was 200 m x 200 m. The coordinate of plot location was mapped using GPS.
Data analysis
(1) Data processing
Prior to establish the regression model, the field data were processed into stand volume per plot (m3/plot). Furthermore, the ground stand volume was treated as dependent variable (V), while the stand variables measured on the photos such as crown cover (C), stand height (H), crown diameter (D) and number of tree (N) were treated as independent variables.
(2) Establishment of the best regression model
The regression models examined in this study are simple and multiple regressions. To build the model of stand volume from aerial photo, it is necessary to select the most appropriate variables and model. Various researches found that the relationship between the stand volume and the stand variable were in the form of linear, logarithmic and or exponential model. In this study, selection of the model was based upon practical and statistical considerations. The best regression model is the model that explains the close relationship between predictor (dependent variable), y, and independent variable, x. During selection of the model, the best model should consider the fewer number of independent variables in the equation and the easiness level on measuring those independent variables in the photos.
RESULTS AND DISCUSSION
Coefficient correlation
Table 3. Simple regressions using CAP
Linear regression equation Coefficient correlation (r)
r table
(0.05)
r table
(0.01)
V = 32.4 – 0.246 C
R-Sq = 69.1% 0.831
0.374 0.478
V = 0,98 + 0.474 H
R-Sq = 43.3% 0.658
V = 3.93 + 1.46 D
R-Sq = 52.4% 0.724
V = 18.9 – 0.628 N
R-Sq = 51.2% 0.716
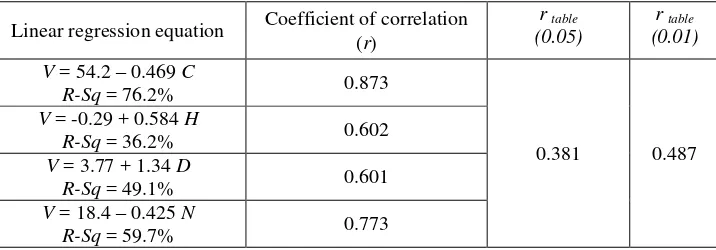
Table 4. Simple regressions using SFNAP
Linear regression equation Coefficient of correlation (r)
r table
(0.05)
r table
(0.01)
V = 54.2 – 0.469 C
R-Sq = 76.2% 0.873
0.381 0.487
V = -0.29 + 0.584 H
R-Sq = 36.2% 0.602
V = 3.77 + 1.34 D
R-Sq = 49.1% 0.601
V = 18.4 – 0.425 N
R-Sq = 59.7% 0.773
In Table 3 it was shown that the calculated r-values of C, H, D and N are all higher than r table both at the 95% (0.374) and 99% (0.478) confidence levels. These mean that the relationships between V and C, H, D or N measured from conventional aerial photo (CAP) are closely related at the 95% and 99% confidence levels.
and/or N is a little bit easier than measuring H. Using the SFNAP, the correlation between
D and V is also lower than the correlation between V and N; and V and C.
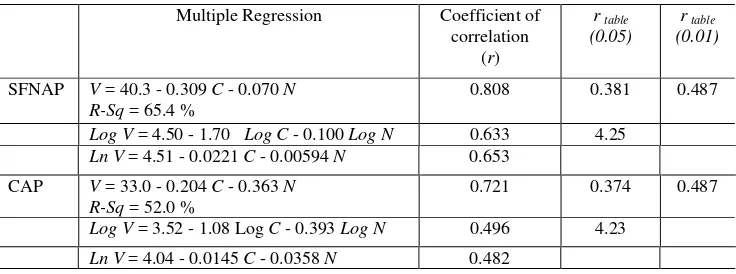
Table 5. Multiple regressions
Multiple Regression Coefficient of correlation
(r)
r table
(0.05)
r table
(0.01)
SFNAP V = 40.3 - 0.309 C - 0.070 N R-Sq = 65.4 %
0.808 0.381 0.487
LogV = 4.50 - 1.70 Log C - 0.100 LogN 0.633 4.25 Ln V = 4.51 - 0.0221 C - 0.00594 N 0.653
CAP V = 33.0 - 0.204 C - 0.363 N R-Sq = 52.0 %
0.721 0.374 0.487
Log V = 3.52 - 1.08 Log C - 0.393 Log N 0.496 4.23
Ln V = 4.04 - 0.0145 C - 0.0358 N 0.482
To compare their relationship, the use of multiple regression was also reformed. Table 5 shows that r-values of multiple regression derived either from CAP or SFNAP is higher than rtable. In comparison with the simple regression, the multiple regression in predicting using C and N variables decrease r-values from 0.873 to 0.808. The same pattern was also found on multiple regressions derived from the CAP, where the calculated r-values decrease significantly from 0.831 to 0.721. These results explained that the addition of N variable degraded the estimation accuracy. Ultimately, it could be concluded that the use of only C variable could provide better estimation.
In comparison with the previous research, Suar (1993) found that the best model for estimating teak stand volume in BKPH Cikampek, KPH Purwakarta is V = -10.2 + 0.169 N + 8.2D having r2 = 0.538, while Effendi (1998) found the best model for estimating teak stand volume in KPH Jombang is of V = 0.0013182 C0.989D2,5, having r2 = 0,851. The work of Perum Perhutani and Fakultas Kehutanan IPB (1998) in KPH Nganjuk, Madiun and Jombang, found that the best models were made using variables C and D. The above results coincided with the study results obtained in this study, in which the inclusion of C
always performs the best model.
Test for significance of regression
Table 6. F-test for significance of simple regression using CAP confidence level; F (0.01) = F table at 99% confidence level.
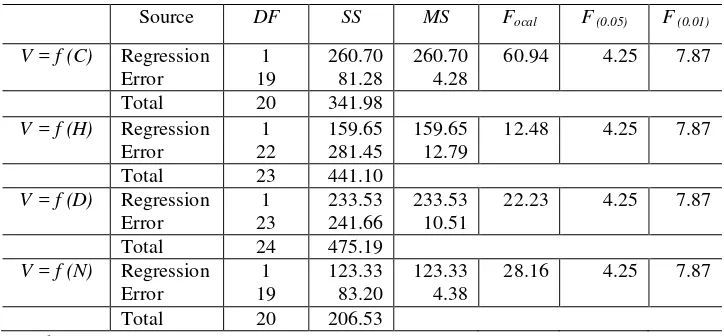
Table 7. F-test for significance of simple regression using SFNAP
Source DF SS MS Focal F (0.05) F (0.01) table at 95% confidence level; F (0.01) = F table at 99% confidence level.
concludes that the stand volume in the study site can be predicted by using crown cover (C), tree height (H) and crown diameter (D) measured on the SFNAP. The models are depicted in Table 4. Among these variables, the C variable was the most recommended variable for predicting stand volume through the SFNAP. The use of multiple regression could not be recommended since it reduces the accuracy.
The best model
For practical purposes, Jaya (1986) expressed that the best model should be simple; using only few numbers of independent variables and those variables should be easy to be measured. For practical reason, the easiest variables include C (crown cover) and N
(number of tree). Both C and N variables are easy to be measured providing consistent interpretation result. Based on r-values and F-test, the best models for the study site are:
V = 54.2 – 0.469 C for the SFNAP and
V = 32.4 – 0.246 C for the CAP
The aerial volume tables for these equations are shown in Tables 8 and 9.
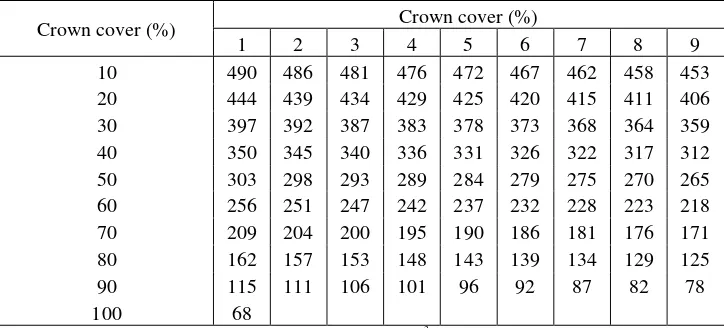
Table 8. Aerial stand volume table of teak wood using the SFNAP
Crown cover (%) Crown cover (%)
1 2 3 4 5 6 7 8 9
10 490 486 481 476 472 467 462 458 453
20 444 439 434 429 425 420 415 411 406
30 397 392 387 383 378 373 368 364 359
40 350 345 340 336 331 326 322 317 312
50 303 298 293 289 284 279 275 270 265
60 256 251 247 242 237 232 228 223 218
70 209 204 200 195 190 186 181 176 171
80 162 157 153 148 143 139 134 129 125
90 115 111 106 101 96 92 87 82 78
100 68
Remarks: The values inside the table express the stand volume (m3/ha).
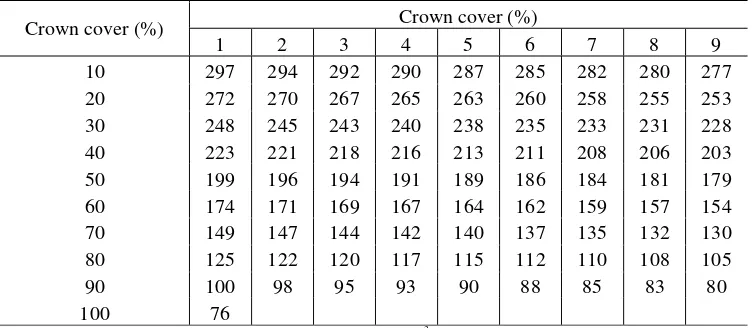
Table 9. Aerial stand volume table of teak wood using the CAP
Crown cover (%) Crown cover (%)
1 2 3 4 5 6 7 8 9
10 297 294 292 290 287 285 282 280 277
20 272 270 267 265 263 260 258 255 253
30 248 245 243 240 238 235 233 231 228
40 223 221 218 216 213 211 208 206 203
50 199 196 194 191 189 186 184 181 179
60 174 171 169 167 164 162 159 157 154
70 149 147 144 142 140 137 135 132 130
80 125 122 120 117 115 112 110 108 105
90 100 98 95 93 90 88 85 83 80
100 76
Remarks: The values inside the table express the stand volume (m3/ha).
Example: the volume of stand having crown cover 65% is 164 m3/ha
CONCLUSIONS AND RECOMMENDATIONS
Conclusions
Based on the results obtained in this study, the following conclusions were derived: 1. The SFNAPs are technically feasible to be used for estimating stand volume of teak
forest, through establishment of aerial stand volume table.
2. Either on the conventional aerial photo or small format non-metric aerial photograph the study found that there are a strong correlation between the stand volume and C, H,
D and N variables.
3. The most accurate model for estimating the stand volume are:
V = 54.2 – 0.469 C (r2 = 76.2%) for SFNAP, and
V = 32.4 – 0.246 C (r2 = 69.1%) for CAP
Recommendation
1. The research result obtained in this study is specific to the study area. The model verification in other site should be performed. The quality of photos must also be analyzed before it used at the operational scale.
ACKNOWLEDGEMENTS
The authors would like to extend sincerely appreciation to Ir. G. Haryuatmanto, Director of PT. Waindo SpecTerra, for his permission in using the small format aerial photograph for this research. Highly appreciation is extended to the anonymous reviewer for his inputs, corrections and comments.
The author also most grateful to Ir. Dyah Jayanti, MSc, (Perhutani, Jakarta) and Ir. Slamet Budiharto as KSPH Salatiga, for their help and permission in using SISDH-PDE data, conventional aerial photograph and field check in Gedangbecici, Randublatung.
LITERATURES CITED
Drapper, Norman and H. Smith, 1981. Applied regression analysis. Second edition. John Wiley & Sons. New York.
Effendi, D., 1998. Penggunaan regresi robust dalam pembentukan model pendugaan volume tegakan jati (Tectona grandis) melalui potret udara di KPH Jombang, Perum Perhutani Unit II Jawa Timur, Skripsi. Jurusan Manajemen Hutan Institut Pertanian Bogor. Tidak diterbitkan.
Haryuatmanto, G., I. Setiyawan, M. Helmi, 1995. Cost-Effective Mapping With a Small Format Aerial Photo for Coastal and Small Island Inventory, Waindo SpecTerra, PT. SEAMEO – BIOTROP, Bogor, Indonesia.
Jaya, I N.S. 1986. Pengantar Penafsiran Potret Udara di Bidang Kehutanan, Jurusan Manajemen Hutan, Fakultas Kehutanan, Institut Pertanian Bogor.
Jaya, I N.S. and A.B. Cahyono, 2001. Technical Study On The Use Of Small Format Non-metric Aerial Photograph For Forestry Field. Tropical Forest Management Journal 7(1) : 55-64.
Paine, D.P. 1981. Aerial Photography and Image Interpretation for Resource Management. John Willey & Son, Inc. Canada
Perum Perhutani, 1993. Buku Rencana Pengaturan Kelestarian Hutan (RPKH) Kelas Perusahaan Jati KPH Randublatung. Register Inventarisasi Hutan Jangka Perusahaan 1 Januari 1993 s/d 31 Desember 2002. Direksi Perum Perhutani. Jakarta Perum Perhutani and Fakultas Kehutanan IPB, 1998. Tabel Volume Udara Tegakan Hutan
Tanaman Jati di Jawa. Kerjasama antara Perum Perhutani dan Fakultas Kehutanan IPB. Bogor
Suar, A., 1993. Pendugaan volume tegakan jati (Tectona grandis L.f) di BKPH Cikampek, KPH Purwakarta melalui potret udara skala 1: 20.000. Skripsi Fakultas Kehutanan IPB. Tidak diterbitkan.
Warner, W.S., R. Graham and R.E. Read, 1996. Small Format Aerial Photography, Aerial Imaging Systems Ltd., Enschede, The Netherlands.
Trop. For. Manage. J. VII (2) : 63-73 (2001)
STUDY ON THE USE OF
SMALL FORMAT NON-METRIC AERIAL PHOTOS
FOR ESTABLISHING AERIAL TEAK STAND VOLUME TABLE
(
A case study in Randublatung Forest Management Unit,
PT. Perhutani Unit I, Central Java
)
AGUNG BUDI CAHYONO1), I NENGAH SURATI JAYA2) and BAMBANG SAPTO PRATOMOSUNU3)
ABSTRAK
Penelitian ini mengkaji tentang pemanfaatan foto udara non-metrik format kecil (SFNAP) guna menyusun tabel volume udara tegakan jati (aerial stand volume table of teak wood) di KPH Randublatung, Perum Perhutani Unit I, Jawa Tengah. Sebagai perbandingan, pengkajian terhadap penggunaan potret udara metrik konvensional (CAP) juga dilakukan. Hasil penelitian menunjukkan bahwa secara teknis SFNAP layak digunakan untuk mengestimasi potensi tegakan sebagaimana ditunjukkan oleh hasil tes statistik. Model terbaik untuk estimasi volume tegakan jati menggunakan SFNAP di lokasi penelitian adalah V = 52,4 – 0,469 C (r2 = 76,2%), sedangkan model terbaik menggunakan CAP adalah V = 32,4 – 0,246 C (r2 = 69,1%).
INTRODUCTION
During the last three decades, forest as a natural resource given a significant
contribution to the Indonesia’s economic growth. To keep its existence and sustainability,
it should be well managed. This forest resource can only be well managed when supported by accurate and reliable data that could be detected through forest inventory. Due to the vastness of the forest area, the terrestrial inventory method is usually cost consuming. Alternatively, the application of remote sensing technique through the application of aerial photographs and satellite imagery followed by adequate ground checking are more preferable. In Java, teak wood (Tectona grandis L.f) has been long time as a main forest product that consumed by most of population either for their life or for industrial intake. Randublatung forest management unit (Kesatuan Pemangkuan Hutan/KPH), is one of the concession areas of PT. Perhutani that recently sufferred from illegal cutting. To monitor and inventory the remaining forest stand in accurate and speedy manner, there is a need to use remote sensing technique, particularly using large scale of aerial photos.
1) Scientist and lecturer at the Geodetic Department, Sepuluh November Institute of Technology (ITS), Surabaya 2) Scientist and lecturer at the Faculty of Forestry, Bogor Agriculture University
Now, availability of non-metric cameras, which technically become more and more sophisticated, provided an opportunity that aerial photos with a small format could be able to substitute conventional aerial photos (CAP) usually taken with metric cameras.
To support the government programs in natural resources inventory (NRI), especially for production forest, now, PT. Perhutani had established forest mapping and inventory programs using SFNAP. The work presented in this research was a part of the work initiated by the cooperation between PT. Waindo SpecTerra and the Geodetic Engineering Department, Gadjah Mada University on Forest Mapping Project using small format aerial photos. It is expected that the result of SFNAP would be applicable in forest inventory, such as estimating stand or tree volumes.
The small format non-metric aerial photos (SFNAP) used in this study is aerial photos taken from small/light aircraft using 35 mm or 70 mm type camera and has standard picture format of 2.4 x 3.6 cm or 5.5 x 5.5 cm. Warner et al (1996) noted that small format aerial photography provides a low-cost source of aerial photo with simple technology. It could be applied when aerial photos are needed immediately at a low cost, e.g. disaster mitigation (flooding, earthquakes). Jaya and Cahyono (2001) found that the SFNAPs are feasible to be used for forest interpretation. In particular, planners, managers and decision-makers need an up-to-date data to monitor and control the developments in fast changing areas (e.g. urban and sub-urban areas). The small format image quality depend on: (1) the subject, which will have certain qualities, such as terrain contrast, lighting and atmospheric haze; (2) the camera lens quality; (3) the type of film used,
granularity and tonal quality; (4) the exposure and film processing; (5) the degree of
apparent image motion and (6) the print quality.
Objectives
The main objective of this study is to evaluate the technical applicability of Small Format Non-metric Aerial Photograph in establishing aerial stand volume table of teak forest in comparison with the CAP.
METHODS
Study area and data
Major of the study area is part located in Banjarrejo, Kradenan and Randublatung, Jati Districts, Regency of Blora, while the rest is located in Gabus District, Regency of Grobogan, Forest Management Unit (KPH) Randublatung Central Java. The areas extend
from 111°20’ to 111°28’ East longitude (Perum Perhutani, 1993), and from 7°10’ to 7°15’
South latitude. This research was conducted from February to August 2001.
Randublatung Forest Management Unit (Kesatuan Pemangkuan Hutan/KPH), Bekutuk and Ngliron Forest Division (Bagian Hutan / BH).
Tools and equipment used were light aircraft (KitFox™ series 5 voyager) with 3 passengers, camera Canon EOS 1000, stereoscope, parallax bar, micrometer wedge, crown density scale, measuring tape, compass, hagameter and GPS Garmin 38.
Data processing were used are Arc View for processing SDH-PDE, ERMapper 6,0, MapInfo 5, Ozy Explorer, AutoCAD 2000, Transform (Geodetic Department, UGM) for UTM - Polyeder transformation, Minitab 11 for statistic calculation, Excel and Microsoft Word 2000 for reporting.
General Procedures
SFNAP data acquisition
The procedure of data acquisition was adopted from the work of PT. Waindo SpecTerra in collaboration with the Geodetic Engineering Department, the University Gadjah Mada on Forest Mapping Project using small format aerial photos. According to Haryuatmanto (1995), the procedure of data collection using small format non-metric aerial photography technique, includes (1) data recording using 35 mm camera, (2) making ground control using GPS-Video and (3) photo acquisition. The specifications of SFNAP are as follows:
small format non-metric aerial photo 35 mm
Table 1. CAP plot sampling
Cutting/planting plot Year of planting
Table 2. SFNAP plot sampling
Cutting/planting plot Year of planting
To establish the regression model expressing the relationship between stand variables and stand volume, the plots interpreted in the SFNAP were also checked in the fields. The field measurements were done between April and June 2001. For 26 sample plots measured on the CAP, the field data were derived from the tally sheet collected by PT. Perhutani in 1991. It should be noted that the CAPs were taken 1992. The ground activities covered in this research are measurement of tree height, tree diameter, and counting of tree number per plot. The tree height from the base until top of the tree crown was measured using hagameter. The diameter of tree was measured at the breast height. These variables are used to predict the total tree volume based on Local Volume Table.
The sampling plots were selected using systematic sampling with random start. The 0.1-ha ground sample plots were laid out across the stand, in which the distance between plot was 200 m x 200 m. The coordinate of plot location was mapped using GPS.
Data analysis
(1) Data processing
Prior to establish the regression model, the field data were processed into stand volume per plot (m3/plot). Furthermore, the ground stand volume was treated as dependent variable (V), while the stand variables measured on the photos such as crown cover (C), stand height (H), crown diameter (D) and number of tree (N) were treated as independent variables.
(2) Establishment of the best regression model
The regression models examined in this study are simple and multiple regressions. To build the model of stand volume from aerial photo, it is necessary to select the most appropriate variables and model. Various researches found that the relationship between the stand volume and the stand variable were in the form of linear, logarithmic and or exponential model. In this study, selection of the model was based upon practical and statistical considerations. The best regression model is the model that explains the close relationship between predictor (dependent variable), y, and independent variable, x. During selection of the model, the best model should consider the fewer number of independent variables in the equation and the easiness level on measuring those independent variables in the photos.
RESULTS AND DISCUSSION
Coefficient correlation
Table 3. Simple regressions using CAP
Linear regression equation Coefficient correlation (r)
r table
(0.05)
r table
(0.01)
V = 32.4 – 0.246 C
R-Sq = 69.1% 0.831
0.374 0.478
V = 0,98 + 0.474 H
R-Sq = 43.3% 0.658
V = 3.93 + 1.46 D
R-Sq = 52.4% 0.724
V = 18.9 – 0.628 N
R-Sq = 51.2% 0.716
Table 4. Simple regressions using SFNAP
Linear regression equation Coefficient of correlation (r)
r table
(0.05)
r table
(0.01)
V = 54.2 – 0.469 C
R-Sq = 76.2% 0.873
0.381 0.487
V = -0.29 + 0.584 H
R-Sq = 36.2% 0.602
V = 3.77 + 1.34 D
R-Sq = 49.1% 0.601
V = 18.4 – 0.425 N
R-Sq = 59.7% 0.773
In Table 3 it was shown that the calculated r-values of C, H, D and N are all higher than r table both at the 95% (0.374) and 99% (0.478) confidence levels. These mean that the relationships between V and C, H, D or N measured from conventional aerial photo (CAP) are closely related at the 95% and 99% confidence levels.
and/or N is a little bit easier than measuring H. Using the SFNAP, the correlation between
D and V is also lower than the correlation between V and N; and V and C.
Table 5. Multiple regressions
Multiple Regression Coefficient of correlation
(r)
r table
(0.05)
r table
(0.01)
SFNAP V = 40.3 - 0.309 C - 0.070 N R-Sq = 65.4 %
0.808 0.381 0.487
LogV = 4.50 - 1.70 Log C - 0.100 LogN 0.633 4.25 Ln V = 4.51 - 0.0221 C - 0.00594 N 0.653
CAP V = 33.0 - 0.204 C - 0.363 N R-Sq = 52.0 %
0.721 0.374 0.487
Log V = 3.52 - 1.08 Log C - 0.393 Log N 0.496 4.23
Ln V = 4.04 - 0.0145 C - 0.0358 N 0.482
To compare their relationship, the use of multiple regression was also reformed. Table 5 shows that r-values of multiple regression derived either from CAP or SFNAP is higher than rtable. In comparison with the simple regression, the multiple regression in predicting using C and N variables decrease r-values from 0.873 to 0.808. The same pattern was also found on multiple regressions derived from the CAP, where the calculated r-values decrease significantly from 0.831 to 0.721. These results explained that the addition of N variable degraded the estimation accuracy. Ultimately, it could be concluded that the use of only C variable could provide better estimation.
In comparison with the previous research, Suar (1993) found that the best model for estimating teak stand volume in BKPH Cikampek, KPH Purwakarta is V = -10.2 + 0.169 N + 8.2D having r2 = 0.538, while Effendi (1998) found the best model for estimating teak stand volume in KPH Jombang is of V = 0.0013182 C0.989D2,5, having r2 = 0,851. The work of Perum Perhutani and Fakultas Kehutanan IPB (1998) in KPH Nganjuk, Madiun and Jombang, found that the best models were made using variables C and D. The above results coincided with the study results obtained in this study, in which the inclusion of C
always performs the best model.
Test for significance of regression
Table 6. F-test for significance of simple regression using CAP confidence level; F (0.01) = F table at 99% confidence level.
Table 7. F-test for significance of simple regression using SFNAP
Source DF SS MS Focal F (0.05) F (0.01) table at 95% confidence level; F (0.01) = F table at 99% confidence level.
concludes that the stand volume in the study site can be predicted by using crown cover (C), tree height (H) and crown diameter (D) measured on the SFNAP. The models are depicted in Table 4. Among these variables, the C variable was the most recommended variable for predicting stand volume through the SFNAP. The use of multiple regression could not be recommended since it reduces the accuracy.
The best model
For practical purposes, Jaya (1986) expressed that the best model should be simple; using only few numbers of independent variables and those variables should be easy to be measured. For practical reason, the easiest variables include C (crown cover) and N
(number of tree). Both C and N variables are easy to be measured providing consistent interpretation result. Based on r-values and F-test, the best models for the study site are:
V = 54.2 – 0.469 C for the SFNAP and
V = 32.4 – 0.246 C for the CAP
The aerial volume tables for these equations are shown in Tables 8 and 9.
Table 8. Aerial stand volume table of teak wood using the SFNAP
Crown cover (%) Crown cover (%)
1 2 3 4 5 6 7 8 9
10 490 486 481 476 472 467 462 458 453
20 444 439 434 429 425 420 415 411 406
30 397 392 387 383 378 373 368 364 359
40 350 345 340 336 331 326 322 317 312
50 303 298 293 289 284 279 275 270 265
60 256 251 247 242 237 232 228 223 218
70 209 204 200 195 190 186 181 176 171
80 162 157 153 148 143 139 134 129 125
90 115 111 106 101 96 92 87 82 78
100 68
Remarks: The values inside the table express the stand volume (m3/ha).
Table 9. Aerial stand volume table of teak wood using the CAP
Crown cover (%) Crown cover (%)
1 2 3 4 5 6 7 8 9
10 297 294 292 290 287 285 282 280 277
20 272 270 267 265 263 260 258 255 253
30 248 245 243 240 238 235 233 231 228
40 223 221 218 216 213 211 208 206 203
50 199 196 194 191 189 186 184 181 179
60 174 171 169 167 164 162 159 157 154
70 149 147 144 142 140 137 135 132 130
80 125 122 120 117 115 112 110 108 105
90 100 98 95 93 90 88 85 83 80
100 76
Remarks: The values inside the table express the stand volume (m3/ha).
Example: the volume of stand having crown cover 65% is 164 m3/ha
CONCLUSIONS AND RECOMMENDATIONS
Conclusions
Based on the results obtained in this study, the following conclusions were derived: 1. The SFNAPs are technically feasible to be used for estimating stand volume of teak
forest, through establishment of aerial stand volume table.
2. Either on the conventional aerial photo or small format non-metric aerial photograph the study found that there are a strong correlation between the stand volume and C, H,
D and N variables.
3. The most accurate model for estimating the stand volume are:
V = 54.2 – 0.469 C (r2 = 76.2%) for SFNAP, and
V = 32.4 – 0.246 C (r2 = 69.1%) for CAP
Recommendation
1. The research result obtained in this study is specific to the study area. The model verification in other site should be performed. The quality of photos must also be analyzed before it used at the operational scale.