i
UNIVERSITI TEKNIKAL MALAYSIA MELAKA
STUDY ON THERMAL GROWTH EFFECT ON MACHINERY
ALIGNMENT
This report submitted in accordance with requirement of the Universiti Teknikal Malaysia Melaka (UTEM) for the Bachelor Degree of Manufacturing Engineering
(Manufacturing Process) with Honours
By
SAFUL BAHARI BIN HAMZAH
FACULTY OF MANUFACTURING ENGINEERING
ii
UNIVERSITI TEKNIKAL MALAYSIA MELAKA
BORANG PENGESAHAN STATUS LAPORAN PROJEK SARJANA MUDA
TAJUK:
“ STUDENT ON THERMAL GROWTH EFFECT ON MACHINERY ALIGNMENT”
SESI PENGAJIAN:
2008/ 2009 Semest er 2
Saya SAIFUL BAHARI BIN HAMZAH
mengaku membenarkan laporan PSM ini disimpan di Perpust akaan Universit i Teknikal Malaysia Melaka (UTeM) dengan syarat -syarat kegunaan sepert i berikut :
1. Laporan PSM / t esis adalah hak milik Universit i Teknikal Malaysia Melaka dan penulis.
2. Perpust akaan Universit i Teknikal Malaysia Melaka dibenarkan membuat salinan unt uk t uj uan pengaj ian sahaj a dengan izin penulis.
3. Perpust akaan dibenarkan membuat salinan laporan PSM / t esis ini sebagai bahan pert ukaran ant ara inst it usi pengaj ian t inggi.
4. *Sila t andakan (√)
SULIT
TERHAD
⁄ TIDAK TERHAD
(Mengandungi maklumat yang berdar j ah keselamat an at au
kepent ingan Malaysia yang t ermakt ub di dalam AKTA RAHSIA RASMI 1972)
(Mengandungi maklumat TERHAD yang t elah dit ent ukan oleh organisasi/ badan di mana penyelidikan di j alankan)
LOT 1860, JALAN BARU,
iv
DECLARATION
I hereby, declared this report entitled “Study on thermal growth effect on machinery alignment” is the results of my own research except as cited in references.
Signature : ……….
Author’s Name : SAIFUL BAHARI BIN HAMZAH
v
APPROVAL
This report is submitted to the Faculty of Manufacturing Engineering of UTEM as partial fulfillment of the requirements for the degree of Bachelor of Manufacturing Engineering (Manufacturing Process) with Honours. The members of the supervisory committee are as follow:
vi
ABSTRACT
vii
ABSTRAK
viii
DEDICATION
Specially dedicated for my beloved father, my mother, and who are very
concerns, understanding patient and supporting. Thank you for everything to my
supervisor Mr. Mohd Shahir Bin Kasim. The work and success will never be achieved
ix
ACKNOWLEDGEMENT
In the name of ALLAH, The Most Gracious and The Most Merciful. Alhamdulillah, praise to ALLAH S.W.T that with His Blessing, had given me great patient and perseverance to complete this project paper successfully.
My heartfelt thanks and gratitude to my beloved advisor, Mr. Mohd Shahir Bin Kasim for all the exceptional assistance guidance and advice given throughout the preparation of this project paper. His undivided support and patient are greatly appreciated and remembered.
x
1.2 Problem Statement 6
1.3 Objective of the Research 7
1.4 Scope of Study 7
1.5 Structure of Study 8
1.5.1 Chapter 1: Introduction 8
1.5.2 Chapter 2: Literature Review 8
1.5.3 Chapter 3: Methodology 8
1.5.4 Chapter 4: Result and Analysis 9
1.5.5 Chapter 5: Discussion 9
xi
Page
2.0 LITERATURE REVIEW 12
2.1 Introduction of Alignment 12
2.1.1 Type of Alignment 13
2.1.2 Misalignment Deviation 14
2.1.3 To Find the Maximum Misalignment Deviation or Alignment Tolerance 15
2.1.4 Eight Basics to Align Machinery 17
2.1.5 Alignment Technique 18
2.2 Introduction of Vibration 20
2.2.1 What is Vibration 20
2.2.2 Time Period Sample 21
2.2.3 How Vibration Is Measured 23
2.2.3.1 Type of Force That Occur On Rotating Machinery 24
2.2.4 Transducer Selection 25
2.2.4.1 Velocity Transducer 26
2.2.5 Using Vibration Analysis to Detect Misalignment 27
2.2.6 Limit and Standard of Vibration 28
2.2.6.1 ISO 2372 Standard 28
2.3 Introduction of Thermal Growth 29
2.3.1 Thermal Compensation Target 30
3.0 METHODOLOGY 32
3.1 Objective of the Case Study Define 32
3.2 Equipment and Tool 33
3.2.1 Dial indicator 33
3.2.2 Mounting Hardware 33
3.2.3 Shim 34
3.2.4 Digital Vibration Detector 34
3.2.5 Alignment Machine Model 35
xii
Page
3.2.7 Digital Height Gauge 37
3.3 Flow Chart for Alignment Process 38
3.3.1 Flow Chart for Reverse Dial Indicator Alignment Process 39
3.4 Method of Alignment 40
3.4.1 Safety 40
3.4.2 Clean Up 40
3.4.3 Rough Soft Foot Correction 41
3.4.3.1 Measuring the Gap Condition around All of the Foot Bolt 41 3.4.3.2 Correcting the 'Soft Foot' Problem and Verifying to Eliminate 42
3.4.4 Correcting Indicator Sag 43
3.4.5 Rough Alignment 44
3.5 Vibration Data Collecting 46
3.5.1 Flow Chart for Generate Data 46
3.6 Alignment Technique 50
3.6.1 Reverse Dial indicator Method 50
3.6.2: Validity Rule 54
3.6.3 Tolerance of Alignment 54
3.6.4 Compensation Thermal Growth 55
3.6.5 Determining Correction or Amount of Shim 56
3.6.5.1 Vertical Movement 56
3.6.5.2 Horizontal Movement 57
xiii
Page
4.0 RESULT AND ANALYSIS 61
4.1 Soft Foot and Runout Value for Rough Alignment 61
4.2 Calculation Technique 62
4.2.1 Total Indicator Reading (TIR) Calculation 63
4.2.2 Vertical Movement 64
4.2.3 Horizontal Movement 65
4.3 Graphical and Modeling Alignment Technique 69
4.3.1 Side View 69
4.3.2 Top View 70
4.4 Results for Height and Vibration 71
4.4.1 Result for Temperature 3 Constant Whereas Temperature
Bearing 4 Was Variable Temperature 71
4.4.2 Result for Temperature 4 Constant Whereas Temperature
Bearing 3 Was Variable Temperature 80
5.0 DISCUSSION 89
5.1 Graphical and Modeling Technique with Thermal Growth 89
5.2 Energy Cost Saving and Labor Cost 92
5.3 Coupling Effect 93
5.4 Self Aligning Bearing 94
5.5 Motor Speed Effect 95
xiv
Page
6.0 CONCLUSION AND RECOMMENDATION 97
6.1 Conclusion 97
6.2 Recommendation 98
REFERENCES 100
APPENDICES 104
Appendix 1 105
Appendix 2 107
Appendix 3 109
Appendix 4 111
Appendix 5 113
xv
LIST OF TABLE
Page
Table 1.1: Planning chart for PSM 1 10
Table 1.2: Planning chart for PSM 2 11
Table 2.1: Finding the maximum misalignment deviation. 16 Table 2.2: Common time period in second by machine speed. 22 Table 2.3: The common Fmax setting for 1600 lines of resolution by machine. 22
Table 2.4: ISO 2372 Guidelines for machinery vibration severity
and machine classes. 28
Table 2.5: Growth factor (mil/in/0F) for common material. 31
Table 3.1: Specification of digital vibration. 35
Table 3.2: Motor specification. 35
Table 3.3: Infrared thermometer specification 36
Table 3.4: Acceptable radial runout limit 44
Table 3.5: Infrared radiation indicator 49
Table 3.6: Residual misalignment tolerance. 55
xvi
LIST OF FIGURE
Page
Figure 1.1: Misalignment condition 3
Figure 1.2: Angular mismatch 4
Figure 1.3: Parallel misalignment 4
Figure 1.4: Combined angular and parallel misalignment 5 Figure 1.5: Reverse dial indicator fixture and mounting 5
Figure 2.1: Misalignment type 14
Figure 2.2: Reverse rim dial method 19
Figure 2.3: Time waveform 21
Figure 2.4: Vibration amplitude 23
Figure 2.5: Vibration amplitude is expressed in four different ways:
peak to peak, peak,RMS (Root mean squared), and average. 23
Figure2.6: Vibration frequency 24
Figure 2.7: Static force 25
Figure 2.8: Dynamic force 25
Figure 2.9: Frequency versus response amplitude for various sensor types 26 Figure 2.10: Plot of sensitivity versus transducer 26
Figure 3.1: Dial indictor. 33
Figure 3.2: Shim 34
Figure 3.3: Digital vibration 34
Figure 3.4: Alignment machine model 35
Figure 3.5: Infrared thermometer 36
Figure 3.6: Digital height gauge 37
Figure 3.7: Measurement gap using feeler gauge 41
Figure 3.8: Special wedges for correction 42
xvii
Page
Figure 3.10: Indicator Sag 43
Figure 3.11: Correction indicator sag. 43
Figure 3.12: Position of dial indicator for runout measurement 44
Figure 3.13: Calibrated eyeball 45
Figure 3.14: Straightedge method 45
Figure 3.15: Taper and feeler gauge method 45
Figure 3.16: Position of bearing number 47
Figure 3.17: Direction of vibration collecting data 48 Figure 3.18: Alignment machine model with reverse indicator method. 50
Figure 3.19: Reverse indicator method 51
Figure 3.20: Dial Indicator reading 51
Figure 3.21: Machine layout for alignment calculator 52
Figure 3.22: The validity rule 54
Figure 3.23: Graph preparation for alignment 59
Figure 3.24: Solution for vertical alignment. 59
Figure 3.25: Solution for horizontal alignment 60
Figure 4.1: Position of distance D1, D2 and D3 62
xviii
Page
Figure 4.13: Graph average horizontal direction against temperature at bearing 4 83 Figure 4.14: Graph average horizontal direction against temperature at bearing 3 84 Figure 4.15: Graph average axial direction against temperature at bearing 4 85 Figure 4.16: Graph average axial direction against temperature at bearing 3 86
Figure 5.1: Graphical technique 89
Figure 5.2: Position of shaft when temperature increased 91
Figure 5.3: Flexible coupling 93
Figure 5.4: External self aligning bearing in pillow block mounting 94
Figure 5.5: External self aligning 95
Figure 5.6: External self aligning bearing with own center 95
Figure 6.1: Rigid coupling 99
xix
LIST OF EQUATIONS
Page
Equation 1: Misalignment deviation 17
Equation 2: Relationship frequency and time 21
Equation 3: Total sample period 21
Equation 4:Fmax setting 22
Equation 5:Thermal growth expansion 30
Equation 6: Vertical move at near foot (NF) 56
Equation 7: Vertical move at far foot (FF) 56
Equation 8: Horizontal move at near foot (NF) 57
Equation 9: Horizontal move at far foot (FF) 57
xx
LIST OF ABBREVIATIONS
CPM – Cycle per minutes FF – Far Foot
HA – Horizontal Angularity HO – Horizontal Offset Hz – Hertz
MTBF – Mean Time before Failure MTBM – Machine to be moved MTBS – Machine to be shim NF – Near Foot
RMS – Root Mean Square RPM – Revolution per minutes
TIRHM – Total Indicator Reading on Horizontal Moveable
TIRHS – Total Indicator Reading on Horizontal Stationery
TIRM – Total Indicator Reading on Moveable
TIRS – Total Indicator Reading on Stationery
1
CHAPTER 1
INTRODUCTION
This chapter describes the background research of shaft alignment, problem statement that induce the relationship of thermal growth effect on shaft alignment, objective of study also scope of study
1.1 Background of Study
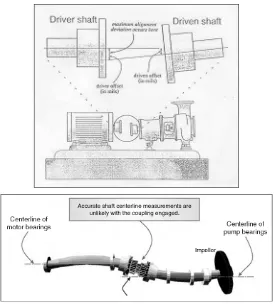
Shaft alignment is proper positioning of the shaft centerlines of the driver and driven component such pump, gearbox and airlock that make the machine drive train (Mobley.R.K, 1999). The basic alignment method are either shimming and/or moving the machine component. The objective of accurate alignment is to increase the life of rotating machine and to obtain the common axis of rotation at operating equilibrium for two shaft couple. To achieve proper alignment, machinery component commonly to fail must be operating within their design limit .It must accurately align to given result (Piotrowski.J, 2007):
a) Reduce excessive axial and radial forces on the bearing to insure longer bearing life and rotor stability under dynamic operating condition.
2
d) Minimize amount shaft bending from the point of power transmission in the coupling to the coupling end bearing.
e) Reduce power consumption.
f) Lower vibration level in machine casing, bearing housing and rotor.
3
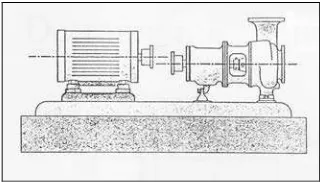
Figure 1.1: Misalignment condition.
Although the machinery has been aligned properly during installation or during maintenance, misalignment still can occurs in very short time potentially caused by foundation movement, accidentally bumping the machine with another equipment, thermal expansion, distortion from piping connection, loosened hold-down nut, expended ground, rusting of shim and crack experienced at coupling, seal and bearing. The misalignment symptoms are (Piotrowski.J, 2007):
a) Premature bearing, seal, shaft, or coupling failures.
b) Elevated temperatures at or near the bearings or high discharge oil temperatures. c) Excessive amount of lubricant leakage at the bearing seals.
d) Certain types of flexible couplings will exhibit higher than normal temperatures when running or will be hot immediately after the unit is shut down. If the coupling is an electrometric type, look for rubber powder inside the coupling shroud.
4
f) Unusually high number of coupling failures or them wears quickly. The shafts are breaking or cracking at or close to the inboard bearings or coupling hubs.
g) Excessive amounts of grease or oil on the inside of the coupling guard.
h) Loose foundation bolts, typically caused by a ‘‘soft foot’’ condition, are exacerbated by misalignment.
i) Loose or broken coupling bolts. This is frequently due to improperly torque the coupling bolts and aggravated by a misalignment condition.
In alignment plant, has both offset and angular component covered four alignment parameter which are horizontal angularity (HA), the horizontal offset (HO), vertical angularity (VA) and vertical offset (VO). But in general misalignment problem, the common discussed are (Piotrowski.J, 2007):
a) Angular mismatch, if centerlines of the two shafts were extended, would cross one another rather being superimposed or running along common line.
Figure 1.2: Angular mismatch.
b) Parallel misalignment, which centerlines of two shafts are parallel but in the same line.
5 c) Combined angular and parallel misalignment
Figure 1.4: Combined angular and parallel misalignment.
Shaft misalignment may highly induce a thermal effect especially at shaft and bearing which causes rapid wear of machine bearing. The misalignment can be measure by the amount of offset and angularity which exists between them. The offset can be determined from the distance between the two rotational centerline either horizontal or vertical directions whereas angularity refer to angle between two centerlines.
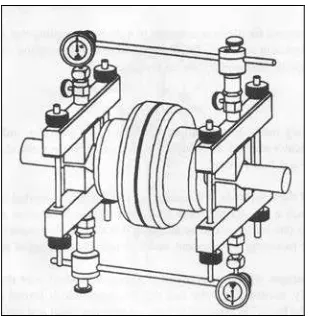
In alignment technique, the Figure 1.5 shows reverse indicator method (also knowing as indicator-reverse method) was used to solve alignment problem. Reverse indicator method using dial gauge indicator measure offset at two points and the amount of horizontal and vertical correction for offset and angularity is calculated. (Mobley.R.K, 1999).