22
ExhaustHeating coil Copper
Quartz boat Boat holder
Control
H2
Temperature Pressure
Ar
Mass Flow
Controller
A Study of the Effect of Thermal Annealing on the Morphology of Copper Foils as Catalyst for Graphene Growth
Kasman
Jurusan Fisika FMIPA UNTAD
ABSTRAK
Telah dilakukan penelitian tentang pengaruh “thermal annealing” terhadap morphology pada tembaga (Cu) sebagai katalis penumbuh graphene. Penelitian ini bertujuan untuk menemukan suatu kondisi optimal untuk mempersiapkan katalis tersebut pada penumbuhan
graphene. Dalam penelitian ini, foil tembaga telah diteliti dengan memvariasikan suhu annealing, waktu annealing dan laju gas hydrogen.
Dari hasil penelitian didapatkan bahwa kondisi optimal adalah annealing pada suhu 900 oC selama 10 menit dengan laju aliran hydrogen
sebesar 100 sccm. Selain itu, penelitian “pre-thermal annealing” telah juga dilakukan untuk menguji perubahan sifat-sifat struktur dan
morphology tembaga tersebut. Dari hasil penelitian ditemukan bahwa tembaga tersebut memiliki “nanocrystalline cubic structure” yang baik,
di mana didominasi oleh (100) dengan ukuran crystal ~200 nm. Penelitian ini juga menunjukkan bahwa gas hydrogen efektif dalam
mereduksi impurity dari oksidasi tembaga. Dan juga, annealing pada suhu 900 oC ke atas, sampel tersebut memiliki morphology yang halus
pada seluruh permukaannya dan grain-grain berukuran ~ 88 µm.
Kata kunci : Foil tembaga, Thermal annealing, Ukuran crystal, and Ukuran grain.
1. Introduction
There are a few options for catalysts to be used for graphene growth, such as, Ni, Pd, Ru, Ir and Cu, which have been reported in the literature [1]. The most well studied and promising catalysts are nickel and copper due to their ready availability, and they have attracted extensive interest in the last three years since the report of large-area graphene thin films for conductive and transparent electrodes by Kim et al.[2,3,4].
The preference for copper catalysts is due to a few reasons. Firstly, the Cu/C binary phase diagram shows a low carbon solubility [5,6] which limits the amount of segregated C on the catalyst surface and hence precludes the growth of additional graphene layers from the bottom growth interface [7]. Secondly, the absence of a copper carbide line compound [7]; and, thirdly, wet etchant
selectivity to graphene [8]. The quality of the resulting graphene is greatly influenced by the morphological and crystallite properties of the catalyst which can be refined by thermal annealing. To ensure high quality graphene deposition, this treatment serves two main functions. Firstly, the catalytic activity of copper can be increased by removing the native oxides, i.e. tenorite (CuO) and cuprite (Cu2O) [9], which may cover the as-received Cu surface. To remove the oxides, the as-received copper must be annealed by introducing hydrogen as a reducing gas [10]. Secondly, by increasing the Cu grain size and rearranging the surface morphology the growth of large graphene flakes can be facilitated [11].
2 Experimental Setup
.
23
A kind of copper, i.e. commercial copper foil (99.98 % purity; 25 µm thick), was employed for studying the effects of thermal annealing on its microstructure, by varying annealing temperature (700-950 °C), annealing time (10-90 min) and hydrogen flow rate (10-200 sccm). All these experiments were conducted in an Atomate CVD furnace (Fig. 1) by introducing a mixture of H2/Ar (50 and 100 sccm, respectively) gas under a pressure of 500 mTorr, except for the study of the variation of hydrogen flow rate. The introduction of hydrogen gas is desired to reduce copper oxides which may occur on the surface, while argon gas is applied to remove H2O steam as reaction products or unwanted gases. Properties of the studied samples were characterised by using X-ray diffraction (XRD) for the crystal structure and scanning electron microscopy (SEM) for the morphological surface.
3 Results and Discussion
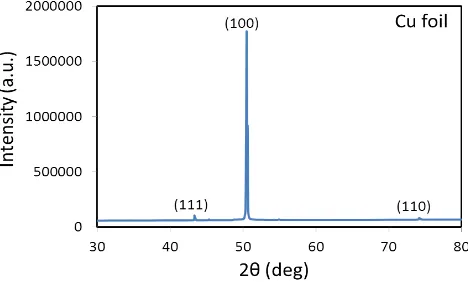
XRD measurements were used to study the effect of annealing on the microstructure of copper substrate. In this technique, a CuKα radiation source (λ = 1.54056 Å) was employed and the diffraction patterns were recorded by varying diffraction angle (2θ) in the range 30˚ to 80˚. XRD patterns of the as-received copper foil (Fig. 2) with three major peaks at 2θ (degrees) values of 43.4°, 50.6° and 74.2° corresponding to reflections from the (111),
(100) and (110) planes are well defined. All the diffraction peaks measured in the 2θ range correspond to the face -centered cubic (FCC) structure of copper with lattice constant a = 3.615 Å and is in good agreement with the standard data card (JCPDS Card No. 85-1326) value [12]. The sharpness of the diffraction peaks suggests that the substrate is well crystallized. Moreover, the absence of copper oxide (i.e. CuO, Cu2O) peaks indicates the high quality of prepared samples.
Figure 2 XRD spectra of the as-received Cu foil
3.1 Effect of Annealing Temperature
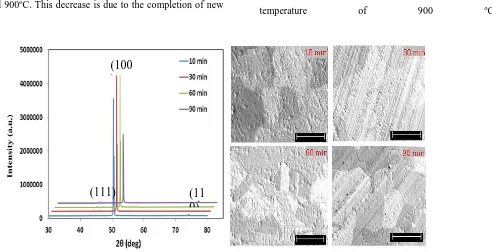
Four different annealing temperatures (700, 800, 900, 950 oC) for a fixed time of 10 minutes were employed to study the effect of annealing temperature on the microstructure of copper substrate. These samples were characterised by using XRD (Fig. 3a) and SEM (Fig. 3b).
Figure 3 (a) XRD profiles and (b) SEM images (scale bar: 100 µm) of the copper foils annealed at different temperatures.
700
oC
800
oC
900
oC
950
oC
(100)
(111) (110)
24
Figure 3a shows XRD profiles of the as-received and annealed copper foils with three major reflections from (111), (100), and (110) planes at the angle of 43.4°, 50.6° and 74.2°, respectively. These peaks are identified on the as-received sample relating to the diffraction peaks of pure copper, and an extra peak on all annealed samples resulting from an impurity material. Comparing with the intensities of (111) and (110) peaks in the annealed samples, those of the (100) peak are very strong. This significant difference indicates that the film is preferentially aligned in the [100] direction. In the (100) plane, the peaks on the samples annealed at 800 and 900 oC are stronger that those of the samples annealed at 700 and 950 oC. This observation is due to a re-crystallisation of the (100) plane in which some sub-grains coalesce to form a new grain, as clearly seen in Figure 3b on the 800 o
C annealed sample. In this sample, the coalesced sub-grains are clearly observed with a size of around 100 µm. Moreover, the (100) peak of the sample annealed at 950 oC is slightly weaker than that of the samples annealed at 800 and 900oC. This decrease is due to the completion of new
grain formation which the shape of grain structure is more regularly oriented. In addition to these peaks, a low peak at 2θ value of 45.4o is detected indicating the presence of an impurity on it.
Figure 3b reveals the surface morphological features of the all samples recorded by SEM with magnification 50,000x. From the micrographs, it is seen that the samples annealed at 700 oC do not have an observable grain size. However, as the annealing temperature increases, the grain size grows significantly. In fact, at temperatures of 800 and 900 oC, grain structures with uniform coverage of the surface are well defined but with randomly oriented morphology. A grain shape with regular orientation is observed at 950 oC and the grain dimension is around 80 µm.
3.2 Effect of Annealing Time
In order to study the effect of annealing time on the microstructure of copper catalysts, the copper foil was further studied by annealing for various annealing times (10, 30, 60 and 90 minutes) at a selected annealing
temperature of 900 oC.
Figure 4 (a) XRD profiles and (b) SEM images (scale bar: 100 µm) of the copper foils annealed for different times.
Figure 4a shows that the diffraction peaks of the (111) and (110) planes are very weak, while the diffraction peak of (100) plane is significantly stronger. The weakness of the peaks indicates that the film content of these planes
is much less than that of (100) plane, as discussed previously. Additionally, the (100) diffraction peak of the 90-min annealed sample is slightly weaker than that of the
(11
0)
(100
)
25
other annealing times. The decrease of this intensity results from the completion of recrystallization.
Figure 4b shows the morphological surface of the samples using SEM with a magnification of 50,000x. From these observations, there is no significant difference on the grain size of 900 oC annealed copper foils for the different times. However, there is a slight morphological difference which is observable. For 10 and 30 minutes, the surfaces appear rough and some grain sizes are not well-defined. Whereas, for 60 and 90 minutes the surfaces appear quite smooth and all grain sizes are well defined.
3.3 Effect of Hydrogen Flow Rate
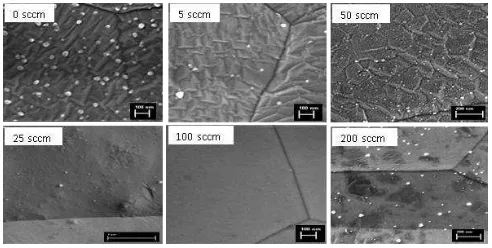
To determine the influence of hydrogen gas on the formation of morphological structure on copper‟s surface, copper substrate was studied by annealing under various flow rates of 0, 5, 25, 50, 100 and 200 sccm with a fixed annealing temperature and time of 900 oC and 10 minutes, respectively. The goal of this study is to find an optimal hydrogen flow rate for resulting in a smooth surface of the substrates.
Figure 5 SEM images of copper foils annealed at 900 oC
for 10 minutes under different flow rates of hydrogen gas. Figure 5 reveals SEM images of copper foils annealed by introducing different hydrogen flow rates at a fixed temperature and time of 900 oC and 10 minutes, respectively. Rises in the hydrogen flow rate leads to the structure of the surface changing such that the structure enlarges and also coalesces resulting in a smoother surface, excepting the 200 sccm-treated foil. The foils introduced with 0 sccm and 5 sccm show a structure with slightly similar shape and size, but with more
contaminants on the foil treated in the hydrogen-free atmosphere. By increasing the hydrogen flux to 25 sccm, some structures coalesce with increase in size. When the flux is increased futher, it is clear that a smooth surface appears due to the completion of structure coalescence. However, the 200 sccm-treated copper foil shows a growth of new structures with various shapes and sizes resulting in a rough surface. This observation indicates that the optimal condition to prepare the copper foil as catalyst for graphene growth is by annealing at the temperature of 900 oC for 10 minutes under the hydrogen flow rate of 100 sccm.
Considering the SEM observations on the hydrogen-treated substrates, it can be summarised that the 900 oC-annealed Cu foils show an enhanced grain growth in increased H2 flow rate due to removal of impurities that “pin” the grain boundary diffusion.
3.4 Grain Sizes and Crystallite
Copper is a polycrystalline material composed of aggregates of many small, different types of crystals joined at boundaries. The aggregations of individual crystals are called “grains” and the boundaries between them are “the grain boundaries”. Grain size and the corresponding spatial distribution of grain boundaries have an important impact on the morphology of copper surface. When annealing, the morphology can change to be smooth with much better uniformity in grain and even the grain size becomes bigger [13]. The planar grain size can be estimated by using the standard intercept count method of ASTM E112 [14], which is based on the number of grain boundary intersections per unit length.
26
cos
9
.
0
D
(1)
where, λ is the wavelength of the incident X-rays (0.154056 nm for Cu Kα1), β the half width of diffraction peak measured in radians, and θ the diffraction angle. In this study, the calculation of crystallite sizes was carried
out on the greatest preferential orientation of copper substrate. From the above XRD patterns in Figures 3a and 4a, the greatest degrees of crystallographic orientation is the (100) plane. The average grain and crystallite sizes calculated are plotted in Figure 6.
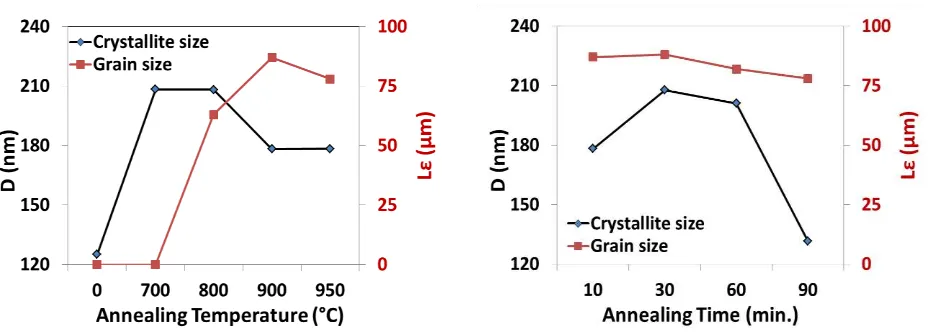
Figure 6 Crystallite and grain sizes on Cu foil as a function of (a) annealing temperature and (b) annealing time.
Figure 6 shows that the grain sizes significantly increase after annealing beyond 800 oC for the fixed time, but there is no significant change for various times. The average grain size resulted is ~ 88 µm. Moreover, for various temperatures the crystallite sizes significantly increase compared with their original size, while for various times they sharply decrease when annealed for the longer time of 90 minutes. The average crystallite size resulted is ~ 200 nm. These results show that annealing provides larger crystallites compared to the original size. Also, the grains are well defined after annealing above 700 oC. The formed grain sizes do not show a significant change by increasing the annealing temperatures and times.
4 Conclusion
This paper has presented a study of the effect of thermal annealing on the morphology of copper foils as catalyst for graphene growth. As-received copper foil was annealed with various temperatures, times, hydrogen flow rate for studying the change of structural and morphological properties. The foil was annealed: initially at 700-950 oC
for a fixed time and hydrogen flow rate of 10 minutes and 50 sccm, respectively, then for 10 to 90 minutes at the selected temperature 900 oC and a fixed hydrogen flow rate of 50 sccm, and finally under various hydrogen flow rates of 0, 5, 25, 50, 100 and 200 sccm by selecting the temperature and time of 900 oC and 10 minutes. Structural properties were studied by means of XRD and SEM. The XRD results revealed that the copper substrate has a good nanocrystalline cubic structure, dominated by (100) planes. Moreover, the absence of copper oxide peaks on the annealed copper under hydrogen atmosphere indicates that the reducing gas effectively removes the copper oxide impurities. The SEM results show that the samples annealed at beyond 900 oC have a smooth surface morphology with uniform coverage and large grain size around 80 µm. An optimal hydrogen flow rate of 100 sccm for smoothing the copper foil surface was determined.
ACKNOWLEDGEMENT
27
the Center for Organic Electronics (COE) for useful discussions and support during this work, especially my supervisor, Prof. Dr. Paul dastoor, and Co-supervisors, Dr. Warwick Belcher and Dr. Xiaojing Zhou.
REFERENCES
1. Mattevi, C., H. Kima and M. Chhowalla, A review of chemical vapour deposition of graphene on copper. J. Mater. Chem., 2010. 21: p. 3324-3334.
2. Kim, K.S., Y. Zhao, H. Jang, S. Y. Lee, J. M. Kim, K. S. kim, J. H. Ahn, P. Kim, J. Y. Choi, and B. H. Hong, Large-scale pattern growth of graphene films for stretchable transparent electrodes. Nature, 2009.
457(7230): p. 706-710.
3. Li, X., Y. Zhu, W. Cai, M. Borysiak, B. Han, D. Chen, R. D. Piner, L. Colombo and R. S. Ruof, Transfer of large-area graphene films for high-performance transparent conductive electrodes. Nano Lett., 2009. 9(12): p. 4359-4363.
4. Bae, S., H. K. Kim, Y. Lee, X. Xu, J.-S. Park, Y. Zheng, J. Balakrishnan, D. Im, T. Lei, Y. Song, Y. J. Kim, K. S. Kim, B. Özyilmaz, J. -H. Ahn, B. H. Hong, and S. Iijima, 30 inch roll-based production of high-quality graphene films for flexible transparent electrodes. Nat. Nanotech., 2010.
5. Bhaviripudi, S., X. Jia, M. S. Dresselhaus, and J. Kong, Role of kinetic factors in chemical vapor deposition synthesis of uniform large area graphene using copper catalyst. Nano Lett., 2010. 10: p. 4128. 6. Lopez, G.A., and E. J. Mittemeijer, The solubility of
C in solid Cu. Scripta Mater., 2004. 51(1): p. 1-5. 7. Li, X., W. Cai, L. Colombo, and R. S. Ruoff,
Evolution of graphene growth on Ni and Cu by carbon isotope labeling. Nano Lett., 2009. 9(12): p. 4268-4272.
8. Li, X., W. Cai, I. Jung, J. An, D. Yang, A.
Velamakanni, R. Piner, L. Colombo, and R. S. Ruoff, Synthesis, characterization, and properties of large-area graphene films. ECS Transactions, 2009. 19(5): p. 41-52.
9. Yoon, K.H., W. J. Choi and D. H. Kang,
Photoelectrochemical properties of copper oxide thin films coated on a n-Si substrate. Thin Solid Films, 2000. 372: p. 250-256.
10. Wlasny, I., P. Dabrowski, M. Rogala, P. J. Kowalczyk, I. Pasternak, W. Strupinski, J. M. Baranowski, and Z. Klusek, Role of graphene defects in corrosion on graphene-coated Cu(111) surface. App. Phys. Lett, 2013. 102(111601): p. 1.
11. Mattevi, C., H. Kim and M. Chhowalla, A review of chemical vapour deposition of graphene on copper. J. Mater. Chem., 2011. 21(10): p. 3324-3334.
12. Swanson, T., Powder diffraction data. National Bureau Standard, 1953. Circ. 539(I): p. 15.
13. Rajesh, D., R. R. Chandrakanth and C. S. Sunandana, Annealing effects on the properties of copper selenide thin films for thermoelectric a pplications. J. Appl. Phys., 2013. 4(5): p. 65-71.
14. ASTM, Standard test methods for determining average grain size, 2012, MC Master University: West Conshohocken.