Hybrid RSM-fuzzy modeling for hardness prediction of TiAlN coatings
1, 5
A.S.M. Jaya,
2M.R. Muhamad,
3M.N.A. Rahman,
4Z.A.F.M. Napiah
1Fac. of Info. & Comm. Tech., 2Centre of Graduate Studies, 3
Fac. of Manuf. Eng., 4Fac. of Electronic & Comp. Eng. Universiti Teknikal Malaysia Melaka
Hang Tuah Jaya, 76100, Durian Tunggal, Melaka, Malaysia
[email protected], [email protected], [email protected], [email protected]
5
S.Z.M. Hashim,
5H. Haron
5Soft Computing Research Group (SCRG) Fac. of Computer Sciences & Information System
Universiti Teknologi Malaysia 81310, UTM, Skudai
Johor, Malaysia
[email protected], [email protected]
Abstract— In this paper, a new approach in predicting the hardness of Titanium Aluminum Nitrite (TiAlN) coatings using hybrid RSM-fuzzy model is implemented. TiAlN coatings are usually used in high-speed machining due to its excellent surface hardness and wear resistance. The TiAlN coatings were produced using Physical Vapor Deposition (PVD) magnetron sputtering process. A statistical design of experiment called Response Surface Methodology (RSM) was used in collecting optimized data. The fuzzy rules were constructed using actual experimental data. Meanwhile, the hardness values were generated using the RSM hardness model. Triangular shape of membership functions were used for inputs as well as output. The substrate sputtering power, bias voltage and temperature were selected as the input parameters and the coating hardness as an output of the process. The results of hybrid RSM-fuzzy model were compared against the experimental result and fuzzy single model based on the percentage error, mean square error (MSE), co-efficient determination (R2) and model accuracy. The result indicated that the hybrid RSM-fuzzy model obtained the better result compared to the fuzzy single model. The hybrid model with seven triangular membership functions gave an excellent result with respective average percentage error, MSE, R2 and model accuracy were 11.5%, 1.09, 0.989 and 88.49%. The good performance of the hybrid model showed that the RSM hardness model could be embedded in fuzzy rule-based model to assist in generating more fuzzy rules in order to obtain better prediction result.
Keywords- hybrid RSM-fuzzy modeling; hardness; TiAlN coatings; PVD magnetron sputtering
I. INTRODUCTION
In high-speed machining process, the cutting tool is consistently dealing with high localized stress at the tool tip and high temperature which exceeds 800°C. In this process too, the cutting tool slides off the chip along the rake face and the newly cut workpiece surface [1]. These conditions are causing tool wear, reducing the cutting tool performances and quality of parts and deteriorating the tool life. Therefore, the hardness on the cutting tool surface is very important in order to reduce the tool wear.
The hardness performance can be improved by applying the thin film coating on the cutting tool. The main purpose
of the thin film coating application is to improve the tool surface properties while maintaining its bulks properties. One of the general coating process in applying thin film for hard coating purpose is PVD magnetron sputtering.
In PVD magnetron sputtering, process parameters like sputtering power, substrate bias voltage, substrate temperature, gas pressure and turntable speed influence the coating performances [2-5]. These conditions have caused limitations especially in the process of applying the coating technology in a new area. Due to these conditions too, trial and error experiments have to be conducted in order to suit the parameters with the material used. This has resulted in the increase of coating process cost and more intricate process of customization in coating.
The issues of cost and customization in coating process could be addressed by developing process model. By using the model, the prediction of output responses and optimization of parameters could be obtained. In order to predict and optimize the coating responses, various techniques like design of experiments [6], neural network [7], and fuzzy logic [8] could be applied. The design of experiments technique like Taguchi, full factorial and Response Surface Method (RSM) are generally used to collect optimum and minimum number of experimental data [9]. However, if Taguchi technique is used, it is quite difficult to detect the interaction effect of nonlinear process [10]. On the other hand, if full factorial technique is applied, it is only suitable for optimization [11]. Meanwhile, the neural network experiment design is not very competent in generalizing data if it is not trained properly and the available training data is inadequate.[12]. Nevertheless, the fuzzy logic develops the fuzzy rules based on actual data or expert suggestion. However, the nonlinear conditions in coating process sometimes may cause the expert suggestion inaccurate. This also leads the fuzzy rules become imprecise due to limited data collection from the coating experiment.
performance would be better compared to single prediction fuzzy model.
II. EXPERIMENTAL DETAILS
A. Material and Method
In this study, the experiment was run in unbalanced PVD magnetron sputtering system made by VACTEC Korea model VTC PVD 1000. Fig. 1 shows the PVD magnetron sputtering system. The coating chamber has two vertically mounted TiAl alloys which were selected as coating material. The chemical compositions of the TiAl alloy were titanium and aluminum with even percentage. The cutting tool inserts were hold in substrate holders with adjustable planetary rotation. Before the coating process, the surface of tungsten carbide cutting tool insert was cleaned with alcohol bath in an ultrasonic cleaner. After a 20- minute-bathing, the substrates were dried and then loaded in the rotating substrate holder. The rotation speed was set at 5 rpm. Then, an inert gas, Argon was pumped into the chamber with controlled gas pressure. Argon was used to produce electron. The nitrogen gas was also pumped in as a reactive gas. The substrate was coated with the alloy in the presence of nitrogen gases.
Figure 1. PVD unbalanced magnetron sputtering system VACTEC Korea model VTC PVD 1000.
TABLE I. THE EXPERIMENT SETTING
Step Process Details Setting
1st Substrate ion Cleaning
-Ion source power -Argon pressure -Substrate bias -Time
0.24 kV/ 0.4 A 5.5 x 10⁻³ mbar -200V
30 mins
2nd TiAl interlayer Coating
-Ar pressure -Time
4.0 x 10⁻³ mbar 5 mins (0.2 μm)
3rd TiAlN deposition
-N2 pressure
-Ar pressure -Time
0.4 x 10⁻³ mbar 4.0x 10⁻³ mbar 90 mins
The coating process consisted of substrate ion cleaning, deposition of interlayer coating of TiAl and deposition of TiAlN coating. In order to produce better adhesion, the impurity on the substrate surface was removed through the
substrate ion cleaning process. The coefficient of thermal expansion gradient between the insert and TiAlN coatings was minimized through the interlayer coating deposition of TiAl. Then, the coating process was done in the presence of nitrogen gas to produce TiAlN. The detail process settings of the three stages are shown in Table 1. A design of experiment technique called Response Surface Modeling (RSM) centre cubic design using Design Expert software version 7.03 was used to develop the experimental matrix. After the experiment, the influences of sputter power, bias voltage and substrate temperature on the coating hardness were analyzed.
B. Hardness Measurement
Figure 2. NanoTest nano-indentation system
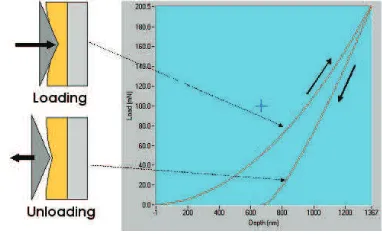
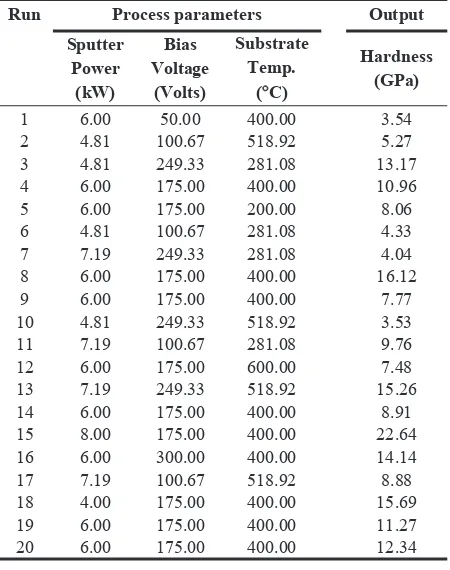
In this study, the hardness of TiAlN was measured using nano-indentation test. In nano-indentation system as shown in Fig. 2, the hardness measuring process was done by indenting a specimen by a load from a very small set value to a maximum set value using a high precision instrument. Every load and displacement reading was recorded continuously. The mechanical properties of thin films coatings can be derived from the measure load-displacement loading/unloading curve through appropriate data analysis. A usual loading/unloading curve is shown in Fig. 3. This curve is used to calculate the hardness and Young modulus as published by Oliver and Pharr [13]. For this study, all of the samples were tested using Berkovitch indenter with maximum load set at 50mN. The dwell time at this load was set at 10 seconds. For each sample, six measurements were taken and the average value was calculated to be used as the hardness value for the particular sample. Table II shows the input process parameter and experimental result of TiAlN coatings hardness.
TABLE II. PROCESS PARAMETERS AND EXPERIMENTAL RESULT OF
TIALNCOATINGS HARDNESS
Run Process parameters Output Sputter
III. MODELING PROCESSES
A. Response Surface Modeling (RSM)
RSM is a collection of mathematical and statistical techniques to model and analyze problems in which responses (output) are influenced by several input variables [14]. The relationship between the input parameters and output responses is defined using regression analysis in polynomial equation form. A regression is used to describe the data collected based on an estimated response variable, y, and one or more input variables x1, x2, . . ., xi. The
polynomial equation can be of a linear or non-linear equation depends on behavior of the model. Equations (1) and (2) are examples of first-order and second-order polynomial equations, respectively.
ε
where y is output response, x is input variable andε is error.
The approximating function will become the first-order model if the relationship can be explained by a linear function. Otherwise, it is a second-order model if there is curvature in the relationship. The model can only be used to describe the relationship within the range of the independent variables specified during the development of the function.
A least square technique is used to minimize the residual error measured by the sum of square deviations between the actual and the estimated responses to ensure the best polynomial equation was selected.
In this work, the regression coefficients such as the coefficients of the model variables including the intercept or constant terms were calculated. However, the model needs to be tested for statistical significance. The analysis of variance approach (ANOVA) was used to test the statistical significance. The tests for significance of the regression model, significance of individual model coefficient and lack of fit were calculated.
From this work, a quadratic polynomial equation representing the hardness model with respect to substrate temperature, substrate bias, and sputter power was developed and given as in (3).
where P is sputter power, V is substrate bias voltage and T is substrate temperature.
B. Fuzzy Logic
Fuzzy logic is decided as a set of mathematical principles for knowledge representation based on degree of membership rather than on crisp membership on classical binary logic [15]. The theory of fuzzy logic is derived based on fuzzy set theory. It uses the degree of membership and degree of truth to deal with the multi-valued situation instead just black and white. The multi-value situation varies continuously from zero (not a member) to one (absolutely a member). The exact response value (e.g. 90 GPa) can be allocated to subjective linguistic term (e.g. hard) via a fuzzy set theory. On the other hand, the linguistic term also can be defined with exact mathematical meaning. Fuzzy logic system consists three parts which are fuzzification, inference system where the fuzzy ruled-based is developed and defuzzification.
In fuzzification, the crisp values of variables become fuzzy values. In this model, the triangular shape membership function was selected. Triangular shape is usually used in fuzzy modeling and one of its characteristics is, it increases and decreases gradually with only one definite value.
fuzzy set input POWER and output HARDNESS are shown in Fig. 4 and Fig. 5, respectively.
4 4.5 5 5.5 6 6.5 7 7.5 8
0 0.2 0.4 0.6 0.8 1
power
D
e
gr
ee
of
m
em
ber
s
hi
p
VL L M H VH
Figure 4. POWER membership function.
0 5 10 15 20 25
0 0.2 0.4 0.6 0.8 1
Hardness
D
e
g
ree
of
m
em
ber
s
hi
p
MS VS S M H VH MH
Figure 5. HARDNESS membership function.
In fuzzy rule-based development, the rules can be constructed based on actual experimental data or expert suggestion. A fuzzy rule can be defined as a conditional statement in the form of:
IF x is A, AND yis B, THEN z is C
where x,y and zare linguistic variables, and A, B and C are linguistic values. As the following, a set of 15 rules were developed based on the actual experimental hardness values. Amount of 6 repeated point from experiment were divided to get an average value.
R1 If (P is M) and (V is VL) and (T is M) then (H is S), R2 If (P is L) and (V is L) and (T is H) then (H is VS), R3 If (P is L) and (V is H) and (T is L) then (H is VS), R4 If (P is M) and (V is M) and (T is M) then (H is M), R5 If (P is M) and (V is M) and (T is VL) then (H is S), R6 If (P is L) and (V is L) and (T is L) then (H is VS), R7 If (P is H) and (V is H) and (T is L) then (H is S), R8 If (P is L) and (V is VH) and (T is VH) then (H is S), R9 If (P is H) and (V is L) and (T is L) then (H is S), R10 If (P is M) and (V is M) and (T is VH) then (H is M), R11 If (P is H) and (V is H) and (T is H) then (H is S), R12 If (P is VH) and (V is M) and (T is M) then (H is S), R13 If (P is M) and (V is VH) and (T is M) then (H is VS), R14 If (P is H) and (V is L) and (T is H) then (H is H), R15 If (P is VL) and (V is M) and (T is M) then (H is VH).
Defuzzification is the conversion of a fuzzy quantity to a precise quantity. This is a contradict of fuzzification [16]. There are seven methods that are available in the literatures that were used by the researchers for defuzzifying methods namely centroid, weight average, mean of max, center of sum, centre of largest area, first (or last) of maxima method. The selection of the method is important and it greatly influences the speed and the accuracy of the model. In this model, centroid of area (coa) defuzzification method was used as it is widely accepted and capable in giving more accurate result.
C. RSM-Fuzzy Rule-Based Modeling
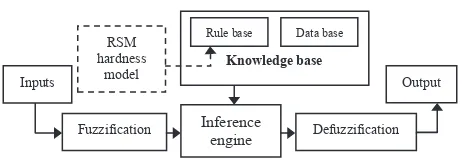
Figure 6. Framework of hybrid RSM-fuzzy model.
In constraints of experimental cost, the number of collected data to construct the fuzzy rules is limited. The limited rules are causing the model not too robust and inaccurate. In this study, we used the developed RSM hardness model to generate more hardness result in purpose of rules construction. The framework of hybrid RSM-fuzzy model is shown in Fig. 6. The steps of the process are listed below:
Step 1: List all 125 combination point of input parameters within the experimental ranges.
Step 2: Find the possible combination of input parameters located within the RSM model ranges. In this case, the hardness RSM model is only valid within these input parameters’ ranges: the sputtering power, P (4.8-7.2kW), substrate bias voltage, V (100-175V) and substrate temperature, T (285-518 C). This range was obtained based on the parameters value only in the RSM cubic design.
Step 3: By using the RSM hardness model, generate the hardness values using the selected point of parameters.
Step 4: Identify and change the parameters and hardness values to fuzzy membership function expression. From the interaction, we can find new additional rules.
Step 5: Add the additional rules into fuzzy inference system and we get new fuzzy rule-based model.
RSM hardness
model
Fuzzification Inference Defuzzification
engine
Inputs Output
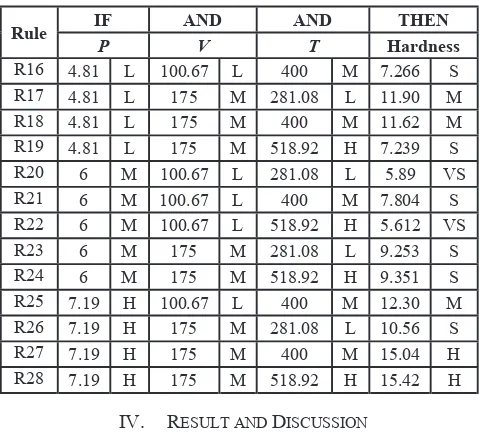
In this work, RSM model is embedded to the fuzzy rule-based to assist in generating extra rules. The new additional hardness values and rules for seven output membership functions are shown in Table III. All of the steps were repeated with five and nine membership functions.
TABLE III. THE NEW ADDITIONAL RULES GENERATED USING THE
IV. RESULT AND DISCUSSION
In this study, the following measures were used to calculate the model performances. The percentage error (
δ
) in (4) was used to observe the gap between actual and the hybrid models for individual value. The mean squared error (MSE) in (5) was used to quantify the difference between predicted and actual values. Meanwhile, the co-efficient determination (R2) in (6) was calculated in order to see how well the future output response is likely to be predicted by the model. Lastly, the prediction accuracy (A) in (7) was computed to determine the accuracy of the models.where
n
is number of testing data,v
ais experimental valueand
v
pis predicted value.In validating the performances of the hybrid models, three testing dataset from separated experiment were used. From Table IV, the hardness values for the hybrid RSM-fuzzy model was compared with the single RSM-fuzzy model. Both models were developed with five, seven and nine triangular shapes of output membership function.
The results show that the RSM-fuzzy models giving less percentage error compared to fuzzy model. The RSM-fuzzy model which used seven triangular shape output membership functions gives the smallest average of percentage error with only 11.5%.
TABLE IV. COMPARISON OF ACTUAL EXPERIMENTAL TESTING RESULT
Meanwhile, Table V shows the MSE, R2 and accuracy of the hybrid model. Once again, the hybrid RSM-fuzzy model indicates the less MSE, higher R2 and more accurate prediction model compared to the fuzzy model. The RSM-fuzzy with seven triangular output membership functions gives the smallest MSE with 1.09. The hybrid model with seven triangular membership functions also shows the highest R2 and model prediction accuracy with 0.989 and 88.49%, respectively.
TABLE V. MSE,R2
AND MODEL ACCURACY OF RSM-FUZZY MODEL
MFs Performance Measures
V. CONCLUSION
In this study, the hybrid RSM-fuzzy model was used in predicting the hardness of TiAlN coatings. The rule-based was constructed based on the collected experimental data and generated RSM hardness model result. The RSM hardness model was used to assist in expanding the number of rules. The input parameters were the sputtering power, substrate bias voltage and substrate temperature with the hardness of TiAlN coatings as the output response. The triangular shapes were selected as membership function for input and output fuzzy set with respective number of membership function were five and (five, seven and nine). The centroid area method was selected in defuzzification. The RSM-fuzzy rule-based model was validated with three experimental dataset. The results in terms of the percentage error, MSE, co-efficient determination and model accuracy were compared with single fuzzy model. The results have shown that:
• The hybrid RSM-fuzzy model gave less average of
percentage error compared to fuzzy single model.
• The hybrid model with seven outputs MF indicated the
smallest average of percentage error with 11.5%.
• The hybrid model also showed less MSE, higher R2 and
more accurate in prediction compared to fuzzy single model.
• The hybrid model with seven outputs MF indicated the
smallest MSE, highest R2 and percentage of accuracy
with 1.09, 0.989 and 88.49% respectively.
• Thus, the RSM hardness model can be used in producing
more fuzzy rules by generating more hardness values to compensate the limited number of experimental result.
• The hybrid RSM-fuzzy model is a good alternative to
predict the hardness of TiAlN coating in PVD magnetron sputtering process.
ACKNOWLEDGMENT
The authors are grateful to Ministry of Higher Education (MOHE), Universiti Teknikal Malaysia Melaka (UTeM) and Universiti Teknologi Malaysia (UTM) for data and financial support.
REFERENCES
[1] S. Kalpakjian and S. Schmid, Manufacturing
Engineering and Technology, 5th ed. Jurong, Singapore: Prentice Hall, 2006.
[2] H. C. Jiang, W. L. Zhang, W. X. Zhang, and B. Peng, "Effects of argon pressure on magnetic properties and low-field magneto striction of amorphousTbFe films," Physica B, vol. 405, pp. 834-838, 2010.
[3] A. R. Md Nizam, "Modelling of Physical Vapur
Deposition (PVD) Process on Cutting Tool using Response Surface Methodology (RSM)." vol. PhD: Coventry University, 2010.
[4] P. L. Sun, C. H. Hsu, S. H. Liu, C. Y. Su, and C. K.
Lin, "Analysis on microstructure and characteristics of TiAlN/CrN nano-multilayer films deposited by cathodic arc deposition," Thin Solid Films, 2010.
[5] T. Zhou, P. Nie, X. Cai, and P. K. Chu, "Influence of N2 partial pressure on mechanical properties of (Ti,Al)N films deposited by reactive magnetron sputtering," Vacuum, vol. 83, pp. 1057-1059, 2009.
[6] G. Xiao and Z. Zhu, "Friction materials
development by using DOE/RSM and artificial neural network," Tribology International, vol. 43, pp. 218-227, 2010.
[7] H. Cetinel, H. Ozturk, E. Celik, and B. Karlik,
"Artificial neural network-based prediction technique for wear loss quantities in Mo coating,"
Wear, vol. 26, pp. 1064-1068, 2006.
[8] R. Manaila, A. Devenyi, D. Biro, L. David, P. B.
Barna, and A. Kovacs, "Multilayer TiAlN coatings with composition gradient," Surface & Coatings Technology, vol. 151-152, pp. 21-25, 2002.
[9] F. Karacan, U. Ozden, and S. Karacan,
"Optimization of manufacturing conditions for activated carbon from Turkish lignite by chemical activation using response surface methodology "
Applied Thermal Engineering, vol. 27, pp. 1212-1218, 2007.
[10] S. Bisgaard and N. T. Diamond, "An Analysis of
Taguchi’s Method of Confirmatory Trials," 1990.
[11] M. J. Anderson and P. J. Whitcomb, DOE
Simplified: Practical Tools for Effective Experimentation. Portland, OR: Productivity Press, 2000.
[12] F. A. N. Fernandes and L. M. F. Lona, "Neural
network application in polymerization process,"
Brazilian Journal of Chemical Engineering, vol. 22, pp. 401-418, 2005.
[13] W. C. Oliver and G. M. Pharr, "An improved
technique for determining hardness and elastic modulus using load and displacementsensing indentation experiments," Material Research, vol. 7, pp. 1564-1583, 1992.
[14] D. C. Montgomery, Design and Analysis of
Experiments, 6th ed. New Jersey: John Wiley and Sons, 2005.
[15] L. A. Zadeh, "Fuzzy Sets," Information and
Control, vol. 8, pp. 338-353, 1965.
[16] T. J. Ross, Fuzzy logic with engineering