K2
164
Evolution of covariance in the
mammalian skull
Benedikt Hallgrimsson, Daniel E. Lieberman*, Nathan M. Young†, Trish Parsons and Steven Wat
Department of Cell Biolog y, and Bone and Joint Institute, University of Calgary, 3330 Hospital Drive NW, Calgary, Alverta T2N 4N1, Canada, *Department of Anthropolog y, Harvard University, 11 Divinity Avenue, Cambridge, MA 02138, USA, †Department of Surgery, Stanford University, Stanford, CA 94305–5148, USA
Abstract. The skull is a developmentally complex and highly integrated structure. Inte-gration, which is manifested as covariance among structures, enables the skull and associated soft tissues to maintain function both across ontogeny within individuals and across the ranges of size and shape variation among individuals. Integration also con-tributes to evolvability by structuring the phenotypic expression of genetic variation. We argue that the pattern of covariation seen in complex phenotypes such as the skull results from the overlaying of variation introduced by developmental and environmental factors at different stages of development. Much like a palimpsest, the covariation structure of an adult skull represents the summed imprint of a succession of effects, each of which leaves a distinctive covariation signal determined by the specifi c set of developmental interactions involved. Covariance evolves either by altering the variance of one of these sequential effects or through the introduction of a novel covariance producing effect. Either way is consistent with the notion that evolutionary change occurs through tinkering. We illustrate these principles through analyses of how genetic perturbations acting at different developmental stages (embryonic, fetal, and postnatal) infl uence the covariance structure of adult mouse skulls. As predicted by the model, the results illus-trate the intimate relationship between the modulation of variance and the expression of covariance. The results also demonstrate that covariance patterns have a complex relationship to the underlying developmental architecture, thus highlighting problems with making inferences about developmental relationships (e.g. modularity) based on covariation.
2007 Tinkering: the microevolution of development. Wiley, Chichester (Novartis Foundation Sympo-sium 284) p ••–••
I mean by this expression (correlated variation) that the whole organization is so tied together during its growth and development, that when slight variations in any one part occur, and are accumulated through natural selection, other parts become modifi ed. This is a very important subject, most imperfectly under-stood, and do doubt wholly different classes of facts may be here easily confounded together.
K2 Integration is a ubiquitous feature of complex organisms (Olson & Miller 1958).
The concept of integration captures the idea that the parts of an organism in a population do not vary independently and that the degrees of non-independence vary among sets of parts. Integration is refl ected in the predictable shape transfor-mations that take place during growth, the existence of predictable size-shape relationships among adult structures, and the maintenance of appropriate size relationships among structures that function together (e.g. the upper and lower jaw or limbs perform across a range of overall body sizes). As the above quote and the fairly substantial discussion of correlated variation in The Origin of Species illus-trates, Darwin clearly appreciated this phenomenon and understood its evolution-ary implications. Quantitative analysis of integration dates from the beginning of the modern synthesis, with the debate centring on the existence of developmental or genetic factors affecting overall size versus the size of individual parts (Castle 1929, Wright 1932). Olson and Miller’s (1958) systematic treatment defi ned the modern study of morphological integration and developed the thesis that correla-tions between structures refl ect shared developmental origins or function. Picking up from Olson and Miler, Cheverud (1982, 1988, 1995, 1996) placed the study of integration in a quantitative genetics framework. In a series of papers Cheverud developed his general thesis that through selection acting on the genetic and developmental determinants of pleiotropy, functional integration leads to genetic integration which, in turn, leads to developmental integration.
Although not explicitly discussed in Jacob (1977), integration is a predicted outcome of tinkering that it leads to modularity. As formulated by Jacob (1977), natural selection essentially takes advantage of existing variation to modify devel-opmental pathways. Tinkering helps account not only for why evolved things tend not to be hopeless monsters, but also for the widespread existence of pleiotropy, linkage, and epigenesis—all of which lead to integration. A common manifestation of such integration is modularity. The concept of modularity in organismal structure and development (Wagner 1995, 1996) has provided a theoretical frame-work that has since guided the study of integration (Hallgrimsson et al 2002, Klingenberg et al 2003, Klingenberg & Zaklan 2000, Magwene 2001, Young & Hallgrimsson 2005). As Wagner has pointed out, this idea has three parallel origins: as semi-autonomous parts of an organisms (Raff 1996); as distinct com-ponents of genetic networks (Gerhart & Kirschner 1997); and as parts of organ-isms composed of traits that covary because of genetic pleiotropy and developmental interactions (Wagner 1995, 1996). It is this form of modularity, that Wagner & Mezey (2003) term ‘variational modularity’ that provides the current conceptual framework for understanding integration in organismal structure.
Modularity is a central concept for evolutionary developmental biology and it provides a clear conceptual framework for understanding integration and its rela-tionship to tinkering. Covariation structure is essential in complex organisms
cmp12.indd 165
K2
because of the need to maintain appropriate size and shape relationships among structures across ontogeny and ranges of phenotypic variation. Covariation struc-ture emerges when genetic or environmental sources of variation affect some structures and not others. If all structures are equally affected, then there is inte-gration, but it is not structured. This might happen for instance if size (and iso-metric scaling) were the only determinant of covariation. On the other hand, if structures are affected randomly, there is no integration. So, covariation structure refl ects the organization of organisms into sets of structures or traits that share developmental or genetic infl uences. In other words, covariation structure is deter-mined by the (variational) modularity of the organism. Modularity also links inte-gration to tinkering and evolvability (Schlosser & Wagner 2003). As noted above, the partitioning of organisms into variational modules reduces the probability that a mutation which enhances function for one trait has deleterious effects on others.
Despite this solid foundation of theory and much empirical work, little is known about how the modular organization of development actually generates covariation structure in complex phenotypes. In this paper, we present a developmental model for understanding covariation structure in the context of tinkering. We argue that covariation is produced by variation in developmental processes that affect aspects of the phenotype unequally. For complex structures, there can be many such pro-cesses, so the eventual covariation structure produced represents the sequential (or time-overlapping) overlay of many such developmental processes. Changes in covariation structure are produced in two ways. Most commonly, an alteration in the variance of one of these covariation-generating processes will produce an altered covariation structure and a change in overall integration. Variation in these processes is essential since without variation there is no covariation and the amount of variation expressed in particular processes determines covariation structure.
Focusing on the covariation structure of the mouse skull, we make the following argument:
1. Integration in the skull (and many other complex structures) is produced by a limited, tractable number of key developmental processes.
2. Covariance structure is the summed effect produced by the variances of these covariance-generating processes.
3. Changes in variance in covariance-generating developmental processes can produce radically different covariance structures.
4. Changes in variance can also increase or decrease the overall magnitude of integration.
K2 and integration interact although changes in the variance of developmental
pro-cesses need not involve canalization. It also shows that patterns of phenotypic integration have a complex and sometimes indecipherable relationship to the underlying variational modularity that generated them. This does not mean that patterns of phenotypic integration cannot be used to study modularity, but rather that additional information, such as that provided by known developmental per-turbations, may be needed to test hypotheses about the developmental determi-nants of modularity. Most importantly, this model clarifi es how covariation structure evolves by alterations to developmental determinants of phenotypic variation. In so doing, our model shows the central importance of key develop-mental processes in structuring the genotype–phenotype map.
The palimpsest model of integration of the skull
To generate covariance among cranial structures, developmental processes must either affect the entire skull or some portions and not others. Taking a broad view, we can make several hypotheses about the main processes that fulfi l these criteria during cranial development (Plate 1). The list below is not meant to be exhaustive, but it is meant to capture the most important covariance-generating processes in the skull.
A. Neural crest migration
Much of the mesenchyme of the head is derived from neural crest that origi-nates at the tips of the neural folds and migrates ventrally alongside the neural tube towards the face and anterior basicranium (Hall & Horstadius 1988). The remainder is derived from somites or head somitomeres. The bones of the face, the anterior cranial base and the anterior cranial vault (frontal bone) are formed from neural crest while the posterior cranial base and posterior cranial vault are derived from mesoderm ( Jiang et al 2002, Noden & Trainor 2005). Genetic factors that infl uence only the neural crest or only the mesoderm derived mesenchyme and its subsequent proliferation and differentiation would cause covariation among the structures derived from each of these origins.
B. Neural crest patterning and proliferation
Within the neural crest-derived mesenchyme, regions corresponding to the branchial arches as well as subregions within the branchial arches are patterned by the combinatorial expression of members of the Dlx homeobox gene family (Depew et al 2002a, Kraus & Lufkin 2006). Subsequently, the fates of these regions vary as subtly different, albeit overlapping, series of developmental genetic events play out on the regionally patterned mesenchyme (Depew et al 2002b). Differences in the local regulation of cell proliferation within the facial
cmp12.indd 167
K2
mesenchyme enabled by this patterning are key to successful formation of the face and also for producing species-specifi c facial morphology (Brugmann et al 2006, Helms et al 2005). Structures derived from these regions or subregions thus have common genetic or epigenetic infl uences that are either not shared or act differently on other regions. Variation in these common infl uences will cause covariation among structures derived from specifi c regions of the facial mesenchyme.
C. The fusion of the facial prominences
The face forms from prominences that grow outwards around the oropharyn-geal membrane. There are initially fi ve prominences—the midline frontonasal process and the paired maxillary and mandibular processes (Plate 2). The fron-tonasal prominence splits into a medial and lateral nasal prominence on either side of the nasal pits. The formation of the primary palate involves fusion fi rst between the medial and lateral nasal prominences and then between the lateral nasal prominence and the maxillary prominence ( Jiang et al 2006). In mice, this takes place between GD 9.5 and GD 12 (Wang & Diewert 1992). This process involves the coordination of growth by mesenchymal proliferation within these prominences and their fusion via the growth of fi lopodial interdigitations at the epithelial seam and subsequent apoptosis or epithelial–mesenchymal transfor-mation of the seam itself ( Jiang et al 2006). The fusion of the facial prominences produces a physical contact between the previously separate outgrowths and changes the subsequent dynamic of facial growth and morphogenesis. Varia-tion in the timing, relative degree of outgrowth of the prominences and their subsequent degree of physical contact could thus infl uence the subsequent growth of the face. Genetic variations that infl uence the fusion of the face could thus contribute to covariation among facial structures.
D. Mesenchymal condensation and differentiation
K2 species-specifi c morphology of individual bones (Hall 2005). Genetic variation
in the regulation of these processes would produce condensation specifi c varia-tion that would produce covariavaria-tion within regions derived from particular condensations or among regions that share regulatory infl uences. This is the level at which the Atchley-Hall model for developmental units or modularity in the mouse mandible was formulated (Atchley & Hall 1991), which has led to considerable work on the covariation structure of this complex structure (Cheverud et al 2004, Ehrich et al 2003, Klingenberg et al 2003, 2004, Mezey et al 2000).
E. Cartilage growth
The bones of the skull form via two distinct mechanisms of ossifi cation. The chondrocranium, which consists of the basicranium and the capsules around the sensory capsules, forms via endochondral ossifi cation. Here, the mesen-chymal condensations differentiate into hyaline cartilage which subsequently undergoes a process of ossifi cation. The viscerocranium also consists initially of cartilaginous elements that form within the branchial arches. The remainder of the skull consists of the cranial vault bones and bones that form around the viscerocranial elements in the face. In both of these cases, the mesenchymal condensations differentiate directly into osteoblasts and form bone directly via intramembranous ossifi cation. The regulation of growth in bones from these two origins appears to be quite different. While the ossifi cation and growth of membranous bone seems largely driven by the induction and mechanical infl uences from surrounding soft tissues (Opperman 2000, Spector et al 2002, Wilkie & Morriss-Kay 2001, Yu et al 2001), bones of endochondral origins display intrinsic growth which is expressed initially in the interstitial growth of the hyaline cartilage and subsequently in the growth of the cranial synchon-droses at specifi c joints between bones of endochondral origin (Cohen et al 1985, Kreiborg et al 1993). Cartilage growth thus has genetic regulatory infl u-ences that are shared among endochondral elements but not with elements which form through intramembranous ossifi cation. Since the bones of the skull become physically adjacent and thus infl uence each others growth, this variation is transmitted from the chondrocranium to the rest of the skull (Hallgrimsson et al 2006). These infl uences, however, are secondary or epi-genetic. The regulation of cartilage growth is thus likely to be a very important determinant of cranial covariation structure.
F. Brain growth
The brain is the largest organ in the skulls of most mammals and its growth is the primary driver for the growth of the cranial vault ( Jiang et al 2002). The brain also exerts a lesser infl uence on the growth of the cranial base (Biegert
cmp12.indd 169
K2
1963, Enlow 1990, Lieberman & McCarthy 1999). The growth of the brain thus exerts an infl uence on some skeletal elements and not others and exerts its infl uence unequally on those that are affected. Variation in brain growth thus translates into covariation among the elements that it infl uences and thus into cranial covariation structure.
G. Muscle–bone interactions
Epigenetic interactions between muscle and bone in the skull is frequently cited as a cause of covariation among skeletal elements (Cheverud 1982, Hallgrimsson et al 2004, Willmore et al 2006a). The mechanical effects of muscle activity are known to infl uence bone growth (Herring 1993). Mechani-cal effects on bone growth are not absent during prenatal development (Delaere & Dhem 1999, Hall & Herring 1990, Herring & Lakars 1982), but are likely to increase substantially in importance once mastication begins. Therefore, bones that share muscle attachments or are in regions in which the loads pro-duced by particular activities such as mastication will share common epigenetic infl uences that are produced by muscle activity. Such effects would produce covariation among structures that share infl uences (e.g. by particular muscles), or are similarly infl uenced by the dispersal of mechanical forces during activi-ties like mastication (Zelditch et al 2006).
H. Somatic growth
A central thread in analyses of integration has been the relationship between the overall determinants of growth and the determinants of growth of particu-lar structures within the organism (Castle 1929, Hallgrimsson et al 2002, Wright 1932). Variation in the overall control of growth should cause covaria-tion among all structures. However, size-related covariacovaria-tion is much more complex than that for two reasons. One is that there are multiple determinants of overall growth and these determinants may affect the growth of individual structures unequally. The regulation of growth varies across ontogeny with growth hormone playing a more important role for somatic growth postnatally in mice while performing a variety of other developmental functions during fetal growth (Waters & Kaye 2002). The other is that many structures do not covary isometrically with overall size. In some cases, such as early ontogeny in many organisms, these relationships are nonlinear as well. The allometric relationship between individual structures and overall size creates an axis of covariation that is often a dominant feature of the covariation structure of a population. This is true in for hominoid cranial variation (Frost et al 2003) as well as for inbred strains of mice (Hallgrimsson et al 2004) and is probably common in any population that exhibits signifi cant variation in body size. Allometric covariation produced by variation in size is thus a major determi-nant of cranial covariation structure.
1 1
K2 The developmental palimpsest and the evolution of covariance
The list of is covariance generating processes above is not exhaustive. It is also an oversimplifi cation in presenting an atomistic view of the development of a complex structure like the skull. It does, however, present a mechanistic account of the development of integration that leads to predictions about how mutations alter covariance structure and how natural selection acts on development to infl uence covariance. It also leads to a better understanding of the limitations of inference about development from patterns of phenotypic variation.
The discussion of the potential covariance generating processes above suggests that developmental processes leave a succession of covariation imprints on the overall covariation structure. A key insight is that it is variation in these processes that produces covariance among the structures that they infl uence. No matter how important brain growth is as a determinant of neurocranial growth, if all individu-als exhibit the same rate and amount of brain growth, then the infl uence of this factor on neurocranial growth will be the same in all individuals and the covari-ance generated by brain growth will be zero. If individuals in a population vary greatly in brain growth, then small and large brain sizes will be associated with low and high values for the measures of neurocranial growth that are infl uenced by brain growth. Thus, high variance in brain growth produces high integration among neurocranial structures. Importantly, the actual effect of brain growth on the neurocranium is the same in both cases. The difference is the magnitude of variance in brain growth. Thus, variance in covariance-generating development processes produces covariation at later developmental stages.
This insight leads to a prediction about the developmental basis for evolutionary changes in covariance structures. If variance in central developmental processes produces integration, then covariation structures evolve via changes to the vari-ances of these covariation generating processes. Any change in the variance of one of the processes relative to the variances of other relevant processes should alter covariance structure. Whether such changes increase or decrease morphological integration overall depends on which process is affected, whether its variance is increased or decreased and what its relative contribution to the covariance struc-ture is in the ancestral or wild-type population. If the variance of a process that is the major determinant of covariance in the ancestral population is increased, then integration will also increase. The reason for this is that the proportion of the total variance explained by the axis of covariation (e.g. a principal component) that corresponds to this major developmental process will increase, leaving less variation to be explained by the less important factors. When a developmental process that contributes very little to the covariance structure in the ancestral population increases dramatically in variance, the opposite would occur and inte-gration will decrease. This happens because an axis of covariation that explained
cmp12.indd 171
K2
only a minor portion of the covariance structure in the ancestral population is increased in its relative importance. The major determinants of covariance are still there, but the previously unimportant factor is now relatively more important, consequently distributing the total variance more evenly across a larger number of factors, producing a more disintegrated phenotypic covariance structure.
In the following section, we demonstrate aspects of this model through analyses of several mutants that infl uence the development of the mouse skull.
Mouse models for integration of the skull
The palimpsest model for the development of covariance structure makes several testable predictions. One is that a mutation that increases the variance of one of these key developmental processes should also alter the covariance structure. A second prediction is that, such a mutation should also increase or decrease overall integration. The direction of the change depends on the relative importance of the process in determining covariance structure. To test these predictions, we exam-ined the effect of three mutations, each of which perturb one of the hypothesized processes on phenotypic variance and covariance structure.
A/WySn Mice and the outgrowth of the facial prominences
A/WySn mice are homozygous for two mutations that interact epistatically to produce an elevated risk for failure of fusion of the primary palate or cleft lip ( Juriloff et al 2001). Although the development of fi lopodial attachments at the epithelial seems is reduced in these mice (Forbes et al 1989), the primary morpho-logical fi nding is that the outgrowth of the facial prominences is reduced or delayed during the formation of the face (Wang & Diewert 1992, Wang et al 1995). One of these factors is known to be a mutation of the Wnt9b gene while the other remains unknown ( Juriloff et al 2006). Wnt9b is expressed in the facial mesen-chyme and is strongly implicated as regulating mesenchymal proliferation ( Jiang et al 2006).
In A/WySn mice, at least on of the mutations that increases cleft lip susceptibil-ity does so by perturbing the outgrowth of the facial prominences prior and during their fusion to form the primary palate. We thus asked the question of whether variability of facial process outgrowth is increased in these mice and, if so, whether the adult covariance structure is signifi cantly altered. As we do not yet have the two loci segregating on an A/WySn genetic background, we compared A/WySn mice to C57BL/6J mice, another inbred strain that does not develop cleft lip and has been used as the comparison in prior studies of these mice (Hallgrimsson et al 2004, Juriloff et al 2001, Wang & Diewert 1992, Wang et al 1995).
K2 To determine whether the variation in the outgrowth of the facial prominences
is increased in A/WySn mice, we performed morphometric analyses on mouse embryos aged 9.5 to 12.0 days post-conception. We collected embryos (n= 82 for A/WySn and n= 50 for C57BL/6J), fi xed them in Bouin’s solution and obtained 3D computed microtomography scans of each embryo. From surface renders of the microCT data, we digitized 52 3D landmarks shown in Plate 2C and subjected these to Procrustes superimposition. All embryos were staged by counting tail somites. Since the embryos used in this study span a period during which shape changes signifi cantly, we standardized the Procrustes data to the 16 tail somite stage. Shape variances were compared using Levene’s test for the Procrustes dis-tance as described previously (Hallgrimsson et al 2006).
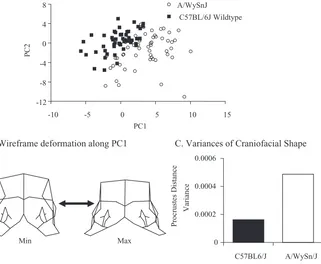
As shown in Fig. 1A–B, the comparison of A/WySn and C57BL/6J embryos reveals a signifi cant difference in shape. A/WySn embryos exhibit defi cient out-growth of the maxillary and frontonasal prominences. Our results are consistent with those reported for a 2D comparison of multiple clefting and non-clefting strains which show that A/WySn are delayed in the shape progression of the face relative to both age and tail somite stage. More importantly, the comparison of shape variance by Levene’s test reveals that the outgrowth of the facial promi-nences in A/WySn mice is also signifi cantly more variable (Fig. 1C).
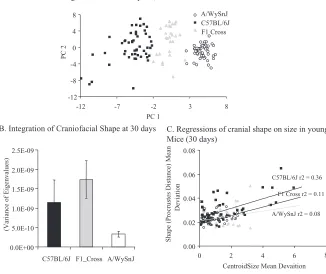
Based on the increase in the variance of facial prominence outgrowth in A/ WySn mice, the palimpsest model would predict that the covariance structure of adult A/WySn mice would be signifi cantly altered and that the overall level of inte-gration should be altered as well. As reported previously (Hallgrimsson et al 2004), young adult A/WySn mice show a dramatically different covariation structure than C57Bl/6J mice (Fig. 2). The matrix correlation between the strains is only 0.24 which is lower than between related species of primates (Marroig & Cheverud 2001) and well below the resampled 95% confi dence intervals of the matrices for the two strains. Morphological integration is much lower in A/WySn mice than in C57BL/6J mice as determined by resampling the scaled variance of the eigenvalues (Wagner 1989, Willmore et al 2006b) (Fig. 2B). Interestingly, the relationship between cranial shape and size is signifi cantly reduced (Fig. 2C). We don’t know how impor-tant a determinant outgrowth and fusion of the facial prominences is of the covaria-tion structure of the mouse skull. However, this fi nding of a less integrated adult covariance structure would be expected if this process normally contributes very little to integration but is increased in its relative importance in A/WySn mice due to the elevated variance of facial prominence outgrowth.
The brachymorph mutation and cartilage growth
The brachymorph (bm) phenotype results from an autosomal recessive mutation in the phosphoadenosine phosphosulfate synthetase 2 gene (Papss2) (Kurima et al
4 4
cmp12.indd 173
K2
1998). This gene codes for an enzyme involved in the sulfation pathway, catalysing the synthesis of adenosine-phosphosulfate (APS) and the subsequent phosphoryla-tion of APS to produce phosphoadenosine-phosphosulfate (PAPS). Within the Golgi apparatus, PAPS is a sulfate donor for a variety of proteins including gly-cosaminoglycans (GAGs). The mutation is a base pair substitution which causes a Gly to Arg substitution within the APS-kinase domain of the protein and thus interferes with the second of the two functions of the enzyme (Kurima et al 1998). The result is a dramatic decrease in the availability of PAPS and thus in the sul-fation of GAGs (Orkin et al 1976). The cartilage extracellular matrix of bm/bm mice is therefore affected in that GAGs are undersulfated and thus less negatively
x
A. Plot of PC1 against PC2 for stage-standardized Procrustes Data
C. Variances of Craniofacial Shape
FIG. 1. Comparison of cranial mean shape and variance for shape for A/WySn and C57BL/6J embryos aged GD 9.5–12 days. The Procrustes data were standardized to the 16 tail somite stage. (A) Plot of PC2 against PC1 for PCA analysis based on the stage-standardized data. The groups are signifi cantly different in shape by Goodall’s F-test (P < 0.001). (B) Wireframe deformation along the 1st
PC which captures much of the difference between the two groups. (C) The shape variances for the two groups measured as the variances of the Procrustes dis-tances from the within-group mean. The observed difference is 0.000324. The 95% upper bound on the observed difference is 0.000162. The two variances are signifi cantly different at
K2 charged, making the proteoglycan aggregates smaller in size and less abundant
(Orkin et al 1976). As a result of this altered extracellular matrix, the growth of cartilage is dramatically reduced thus all skeletal elements that depend on cartilage growth are abnormally small. In the skull, the direct effects of the mutation should be confi ned to the chondrocranium because the growth of dermatocranial ele-ments does not depend directly on cartilage growth (Kaufman & Bard 1999). The palimpsest model thus predicts that if the variance of cartilage growth is increased by this mutation, the covariation structure should be altered and, depending on the importance of this process in determining covariation structure, the level of overall morphological integration should be altered as well.
We do not have a direct measure of the variance of cartilage growth for these mice. However, we have measured the overall shape variance in an adult sample
A. Plot of PC1 against PC2 for A/WySnJ, C57BL/6J and thir F1 cross.
-12
C. Regressions of cranial shape on size in young Mice (30 days)
B. Integration of Craniofacial Shape at 30 days
0.0E+00
FIG. 2. Comparisons of adult A/WySnJ mice to C57BL/6J mice at 30 days of age. (A) PCA plot comparing the two strains with their F1 cross. The groups are signifi cantly different in shape using Goodall’s F-test (P< 0.01). (B) Regressions of craniofacial shape (the Procrustes distance from the within group mean shape) against cranial size (centroid size). A lower pro-portion of the total variance in shape is explained by size in A/WySnJ mice. (C) Craniofacial integration showing that A/WySnJ mice have reduced craniofacial integration.
cmp12.indd 175
K2
B. Wireframe deformation along PC1 A. Plot of PC1 against PC2
-3
D. Comparison of Covariance Structure (lateral view)
i. Brachymorph (variance of scaled eigenvalues* 10
5 )
PC2 (15%)
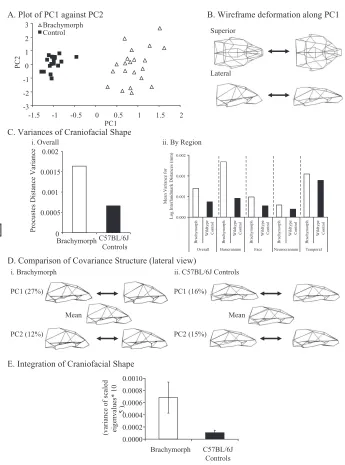
FIG. 3. Comparisons of adult brachymorph homozygotes to wild-type C57BL/6J mice at >90 days of age. (A) PCA plot comparing the two groups. (B) Wireframe deformation representing the shape change along PC1. (C,i) Comparing variances for overall craniofacial shape for the two groups; (C,ii) broken down by cranial region. (D) Comparison of the signifi cantly different covariance structures of the two groups. (E) Comparing morphological integration as measured by the variances of the eigenvalues for the two groups.
K2 of bm/bm homozygotes on a C57BL/6J background (n = 21) and a sample of
C57BL/6J controls (n= 19) (Hallgrimsson et al 2006) (Fig. 2A). All individuals were over 90 days in age. Analysis of this sample shows that the brachymorph mutation is associated with a dramatic increase in morphological variance (Fig. 2B); the Procrustes mean deviations, after adjustment for sex differences within groups, are signifi cantly higher in the brachymorph group compared to the wild-type whether the statistical analysis is based on Levene’s test (df = 39, F = 29, P< 0.001) or the permutation test (observed ∆V = 0.00097, 1600 permutations, P< 0.001). Further, the largest difference in shape variances were found in cranial regions of endochondral origin (Hallgrimsson et al 2006) (Fig. 2C).
A comparison of the variance covariance matrices for the two groups reveals that the bm mutation radically alters covariance structure. The matrix correlation between the two matrices is only 0.33 (Fig. 2D). Interestingly, morphological integration is dramatically increased as determined by resampling the scaled vari-ance of the eigenvalues (Fig. 2E). Coupled with the increased varivari-ance for shape of the endochondral portion of the skull, this result would be predicted by the model if the growth of the endochondral portion of the skull is normally a large contributor to the overall covariance structure. The increase in the variance of this process thus increases the already high proportion of the variance that is explained by this axis of covariation.
The mceph mutation and brain growth
Homozygous mceph (megencephaly) mutants have expanded but normally shaped brains from generalized neural cell hypertrophy generated by a single recessive autosomal mutation, an 11 bp deletion in the Kcna1 gene (Diez et al 2003, Petersson et al 2003). Brain size is normal at birth, but increases more rapidly than in the wild-type and is increased in our sample by 30% on average by 90 days of age. Since brain growth is one of the main hypothesized integrating processes in the cranium, we predicted that if the variance of brain growth is also increased in these mice, the covariance structure will be altered. Moreover, if brain growth is a major determinant of covariation structure, overall integration will be increased.
We tested these predictions using a sample of mice carrying the mceph mutation on a mixed C57BL/6J*Balbc/ByJ background obtained from the Jackson Labora-tory. We obtained heterozygote * homozygote mating pairs. F1 offspring were genotyped by PCR (primers: TTG TGT CGG TCA TGG TCA TC [forward], GCC CAG GGT AAT GAA ATA AGG [reverse]), and gel bands were sequenced for a subsample due to the small difference between fragment lengths. We obtained and scanned a sample of 26 mceph/mecph homozygotes and 25 heterozyogotes which we used as controls. As further outgroup controls, we compared these mice also to C57BL/6J wild-type mice of the same age (n= 30).
cmp12.indd 177
K2
To determine changes in mean brain size and the variance of brain size, we obtained virtual endocasts from computed microtomography scans and calculated their volumes (Fig. 4A). Both the mean endocranial volumes and, importantly, the variance of endocranial volume are signifi cantly higher in the mceph homozygotes than in either the heterozygote or C57BL/6J controls (ANOVA, P< 0.01, Levene’s test ANOVA for variance, P < 0.01). Brain growth is thus increased and more variable in the mceph homozygotes.
As predicted, this increase in the variance of brain growth is also associated with a radically altered covariance structure (Fig. 4). The matrix correlation between the variance covariance matrices of the Procrustes coordinates for the mceph homozygote and heterozygote samples is 0.34, which is signifi cantly below the resampled 95% confi dence intervals of the matrices for the two strains. The overall phenotypic variance in mceph homozygotes is signifi cantly greater than in the heterozygote and C57BL/6J wild-type samples (Levene’s test ANOVA for Procrustes distance, P< 0.01). Finally, morphological integration is substantially and signifi cantly increased in the mceph homozygotes as determined by resampling the scaled variances of the eigenvalues (Fig. 4).
Together, these results show that the mceph mutation alters the cranial covaria-tion structure by increasing the variance of brain size which, because of the cor-related responses to brain size throughout the skull, produces both an alteration in covariance structure and a signifi cant increase in overall morphological integration.
Discussion and conclusion
The relationship between genetic and phenotypic variation is so complex that it is necessary to consider and analyse development in order to understand evolutionary changes. There are two major ways in which development complicates the geno-type-phenotype map. One is the through the modulation of the amount of varia-tion. This is captured through the study of phenomena such as canalization or developmental stability. The other is through structuring or biasing the direction of variation. This latter aspect is captured through the study of phenomena like developmental constraints or morphological integration. The palimpsest model for the evolution of integration shows how intimately connected the modulation of the amount of variation is to the structuring of the direction of variance. Changes in covariance—or variation structure—are produced by altering the variance of developmental processes that affect structures differentially. The covariance struc-ture of some complex morphological system like the skull is really the summed effect of the relative variances of all covariance-generating processes.
K2
B. Wireframe deformations along PC1 and PC2 A. Plot of PC1 against PC2
C. Variances of Craniofacial Shape
D. Means with standard deviations for Endocranial Volume
FIG. 4. Comparisons of adult mceph homozygotes to heterozygotes and C57BL/6J mice at 90 days of age. (A) PCA plot comparing the three groups. (B) The wireframe deformations that correspond to the shape changes along PC1 and PC2. These components are not signifi cantly distinct from one another and so should be interpreted as representing equivalent axes of a two dimensional plane of variation. (C) Comparing variances from craniofacial shape. The mceph
homozygotes have signifi cantly higher variances as determined by the delta variance permuta-tion test in Simple 3D (Sheets 2004). (mceph/mceph vs. mceph/+: deltaV = 0.001, P< 0.000625, 1600 permutations, mceph/mceph vs C57BL/6J wild-type = deltaV = 0.00097, P< 0.000625, 1600 permutations). (D) Means and standard deviations for endocranial volumes for the three groups. The variances are signifi cantly different as determined by Levene’s test ANOVA (P< 0.01). (E) A comparison of morphological integration for the three groups. The mceph/ mceph groups is signifi cantly more integrated than the other two groups as determined by resam-pling the variances of the scaled eigenvalues for 1000 iterations (P< 0.001).
cmp12.indd 179
K2
Hallgrimsson et al 2004, Hallgrimsson et al 2002 Magwene 2001). Wagner and colleagues have distinguished between the use of terms ‘variation’ and ‘variability’. Accordingly, ‘variation’ refers to the observed sets of differences among individu-als, and ‘variability’, to the propensity to exhibit variation (Wagner et al 1997). This is relevant here because the object of study—patterns of variability like modularity—are properties of individual developmental systems and are products of the architecture of development. Covariation structure, however, is a property of a population that is infl uenced by the relative variances of covariance generating processes. As the results presented above show, the covariation structure of a sample can be altered radically by a single mutation. Yet, the architecture of indi-vidual developmental systems is the same in the sense that the potential interac-tions that would generate a covariance structure in a natural population are all there. The potential interaction between brain size and basicranial shape are pre-sumably present in all the strains analysed here, but this is the dominant determi-nant of covariation only in the mceph homozygotes because of the increased variance in brain growth in this group.
This is not to say that patterns of covariation are uninformative about underly-ing developmental relationships. A strikunderly-ing result that comes out of comparative analyses of covariation structure in related species is how conservative covariation structure can be (Goswami 2006b, Marroig & Cheverud 2001, Young 2004, Young & Hallgrimsson 2005). The palimpsest model and our analysis of how specifi c mutations infl uence integration patterns, however, tells us that this conservation of integration patterns across related species is not due to the conservation of the developmental interactions that produce the covariation patterns. Covariation structure can change while those interactions remain the same. Instead, it shows that the variances of those covariance generating processes are remarkably con-stant in terms of their relative magnitudes across species. So, when cranial covariation structure is similar, this means that variation in endochondral growth or brain growth are contributing equally to the covariation structures of those populations.
K2 and clf2 mutations in A/WySn mice, also produce large shifts in the phenotypic
mean. Mutations of large phenotypic effect are almost always highly deleterious and thus are very unlikely to occur with suffi ciently high frequency in natural populations to produce the massive shifts in covariation structure that we report here.
These results, however, are relevant for understanding the evolution of covari-ance in natural populations. They imply that when a change in covaricovari-ance structure is seen, this means that the proportional magnitudes of the variances of the pro-cesses producing that covariance structure have been altered. So, if the covariation structure of the scapula is altered in a species with an unusually large deltoid muscle, this change probably refl ects the relatively increased integrating infl uence of the deltoid muscle. When the covariance structure of the skull is altered in dwarfed forms, this may refl ect the relatively larger infl uence of brain growth because of the allometric relationship between brain and body size. By arguing that the evolution of covariance thus refl ects increases or decreases in the variances of integrating processes, we are making an argument that is very much in the spirit of Jacob’s vision of ‘evolution by tinkering’ ( Jacob 1977). In most cases, the evolu-tion of covariance thus takes place through tinkering with the relative variances of processes that are already present.
This cannot always be the case, though. The appearance of novel structures or processes can also alter covariance. For example, a change in patterning might divide a block of tissue or some other developmental module into regions with distinct developmental-genetic infl uences. Once this happens, subsequent changes might build on the initial patterning change and add to the variation that is specifi c to each region. When existing structures such as segments or appendages are duplicated and subsequently diverge, then the covariance matrix of interest changes to include the novel structures. Within the matrix, new infl uences that are particu-lar to the novel structure will alter the matrix as a whole. As in other areas, the subject of evolutionary novelty creates a set of distinct and interesting questions (Muller & Newman 2005) that are beyond the scope of this paper. The implication of the palimpsest model for how evolutionary novelty alters covariance structure is simply that such events produce new covariance generating processes and that their relative variances will determine their infl uence on the covariance structure of interest.
An important implication of the palimpsest model for cranial covariation is the power of focusing on key developmental process level determinants of phenotypic variability. Although the development of the mammalian skull is very complex, we argue here and elsewhere (Hallgrímsson et al 2007) that signifi cant axes of covaria-tion are generated by epigenetic interaccovaria-tions among components of the skull. We argue that increasing or decreasing the amount of cartilage growth would act on a particular axis of morphological covariation. Similarly, increasing or decreasing
cmp12.indd 181
K2
the size of the brain would produce a particular axis of covariation. A full test of this proposition would compare different mutations that affect a particular process against the prediction that all would produce variation along the same axis of covariation.
If correct, our suggestion that cranial variation is driven by a fi nite set of key processes provides a framework with which to cut through the overwhelming complexity of head development to arrive at an understanding of how the expres-sion of variation in the skull is structured by development. For instance, we can ask how the growth of the brain infl uences the shape of the skull. To understand that relationship, it may not matter how the brain increases in size. This undoubt-edly matters in terms of the evolutionary explanation for increased brain size, but it probably does not matter for understanding the shape consequences of increased brain size for the skull. Similarly, the overall growth of cartilage in the skull can be regulated through many developmental pathways, each of which in turn is infl uenced by multiple genes. In terms of understanding how the skull changes shape, the relevant level of explanation is the interaction between chondrocranial growth and the rest of the skull. Similar arguments could be made about all of the developmental processes discussed above as well as some others that are not dis-cussed here. We thus argue that a focus on key developmental processes underlying the development of a complex structure provides a framework for understanding how development structures the expression of phenotype.
Acknowledgements
This work was supported by National Science and Engineering grant 238992–02, Canadian Foundation for Innovation grant #3923, Alberta Innovation and Science grant #URSI-01–103-RI, Canadian Institutes of Health grant 131625 and Genome Canada grant (to B.H.), American School of Prehistoric Research (DEL).
References
Atchley WR, Hall BK 1991 A model for development and evolution of complex morphological structures. Biol Rev 66:101–157
Biegert J 1963 The evaluation of characteristics of the skull, hands and feet for primate taxonomy. In: SL Washburn (ed) Classifi cation and human evolution. Chicago, Aldine, p 116–145
Brugmann SA, Kim J, Helms JA 2006 Looking different: Understanding diversity in facial form. Am J Med Genet A 140:2521–2529
Castle WE 1929 The further study of size inheritance with special reference to the existence of genes for size characters. J Exp Zool 53:421–454
Cheverud JM 1982 Phenotypic, genetic, and environmental integration in the cranium Evolu-tion 36:499–516
K2 Cheverud JM 1995 Morphological integration in the saddle-back tamarin (Saguinus fuscicollis)
cranium. Am Nat 145:63–89
Cheverud JM 1996 Developmental integration and the evolution of pleiotropy. Am Zool 36:44–50
Cheverud JM, Ehrich TH, Vaughn TT, Koreishi SF, Linsey RB, Pletscher LS 2004 Pleiotropic effects on mandibular morphology II: differential epistasis and genetic variation in morpho-logical integration. J Exp Zoolog B Mol Dev Evol 302:424–435
Cohen MM Jr, Walker GF, Phillips C 1985 A morphometric analysis of the craniofacial con-fi guration in achondroplasia. J Craniofac Genet Dev Biol Suppl 1:139–165
Delaere O, Dhem A 1999 Prenatal development of the human pelvis and acetabulum. Acta Orthop Belg 65:255–260
Depew MJ, Lufkin T, Rubenstein JL 2002a Specifi cation of jaw subdivisions by Dlx genes. Science 298:381–385
Depew M, Tucker A, Sharpe P 2002b Craniofacial Development. In: Rossant J, Tam P (eds) Mouse Development: Patterning, Morphogenesis, and Organigenesis. Academic Press, p 421–498
Diez M, Schweinhardt P, Petersson et al 2003 MRI and in situ hybridization reveal early dis-turbances in brain size and gene expression in the megencephalic (mceph/mceph) mouse. Eur J Neurosci 18:3218–3230
Ehrich TH, Vaughn TT, Koreishi SF, Linsey RB, Pletscher LS, Cheverud JM 2003 Pleiotropic effects on mandibular morphology I. Developmental morphological integration and differ-ential dominance. J Exp Zoolog B Mol Dev Evol 296:58–79
Enlow DH 1990 Facial growth. Philadelphia, Saunders
Forbes DP, Steffek AJ, Klepacki M 1989 Reduced epithelial surface activity is related to a higher incidence of facial clefting in A/WySn mice. J Craniofac Genet Dev Biol 9:271–283 Frost SR, Marcus LF, Bookstein FL, Reddy DP, Delson E 2003 Cranial allometry,
phylogeog-raphy, and systematics of large-bodied papionins (primates: Cercopithecinae) inferred from geometric morphometric analysis of landmark data. Anat Rec 275A:1048–1072
Gerhart J, Kirschner M 1997 Cells, embryos, and evolution: toward a cellular and developmen-tal understanding of phenotypic variation and evolutionary adaptability. Blackwell Science, Malden, MA
Goswami A 2006a Cranial Modularity Shifts during Mammalian Evolution. Am Nat 168:270–280
Goswami A 2006b Morphological integration in the carnivoran skull. Evolution Int J Org Evolution 60:169–183
Hall BK 2005 Bones and cartilage: developmental and evolutionary skeletal biology. Elsevier Academic Press, Australia, San Diego, CA
Hall BK, Herring SW 1990 Paralysis and growth of the musculoskeletal system in the embry-onic chick. J Morphol 206:45–56
Hall BK, Horstadius S 1988 The Neural Crest. Oxford University Press, London
Hallgrimsson B, Willmore K, Hall BK 2002 Canalization, developmental stability, and morphological integration in primate limbs. Yearb Phys Anthropol 45:131–158
Hallgrimsson B, Dorval CJ, Zelditch ML, German RZ 2004 Craniofacial variability and mor-phological integration in mice susceptible to cleft lip and palate. J Anat 205:501–517 Hallgrimsson B, Willmore K, Dorval C, Cooper DML 2004 Craniofacial variability and
modu-larity in macaques and mice. J Exp Zool B Mol Dev Evol 302B:207–225
Hallgrimsson B, Brown JJY, Ford-Hutchinson AF, Sheets HD, Zelditch ML, Jirik FR 2006 The brachymorph mouse and the developmental-genetic basis for canalization and morpho-logical integration. Evol Dev 8:61–73
Hallgrimsson B, Lieberman DE, Liu W, Ford-Hutchinson AF, Jirik FR 2007 Epigenetic Inter-actions and the Structure of Phenotypic Variation in the Cranium. Evol Dev 9:76–91
6 7
cmp12.indd 183
K2
Helms JA, Cordero D, Tapadia MD 2005 New insights into craniofacial morphogenesis. Devel-opment 132:851–861
Herring S 1993 Formation of the vertebrate face: Epigenetic and functional infl uences. Am Zool 33:472–483
Herring SW, Lakars TC 1982 Craniofacial development in the absence of muscle contraction. J Craniofac Genet Dev Biol 1:341–357
Jacob F 1977 Evolution and tinkering. Science 196:1161–1166
Jiang R, Bush JO, Lidral AC 2006 Development of the upper lip: morphogenetic and molecular mechanisms. Dev Dyn 235:1152–1166
Jiang X, Iseki S, Maxson RE, Sucov HM, Morriss-Kay GM 2002 Tissue origins and interactions in the mammalian skull vault. Dev Biol 241:106–116
Juriloff DM, Harris MJ, Brown CJ 2001 Unravelling the complex genetics of cleft lip in the mouse model. Mamm Genome 12:426–435
Juriloff DM, Harris MJ, McMahon AP, Carroll TJ, Lidral AC 2006 Wnt9b is the mutated gene involved in multifactorial nonsyndromic cleft lip with or without cleft palate in A/WySn mice, as confi rmed by a genetic complementation test. Birth Defects Res A Clin Mol Teratol 76:574–579
Kaufman MH, Bard JBL 1999 The anatomical basis of mouse development. Academic Press, San Diego
Klingenberg CP, Zaklan SD 2000 Morphological integration between developmental compart-ments in the Drosophila wing. Evolution 54:1273–1285
Klingenberg CP, Mebus K, Auffray JC 2003 Developmental integration in a complex morpho-logical structure: how distinct are the modules in the mouse mandible? Evol Dev 5:522–531
Klingenberg CP, Leamy LJ, Cheverud JM 2004 Integration and modularity of quantitative trait locus effects on geometric shape in the mouse mandible. Genetics 166:1909–1921
Kraus P, Lufkin T 2006 Dlx homeobox gene control of mammalian limb and craniofacial development. Am J Med Genet A 140:1366–1374
Kreiborg S, Marsh JL, Cohen MM Jr et al 1993 Comparative three-dimensional analysis of CT-scans of the calvaria and cranial base in Apert and Crouzon syndromes. J Craniomaxil-lofac Surg 21:181–188
Kurima K, Warman ML, Krishnan S et al 1998 A member of a family of sulfate-activating enzymes causes murine brachymorphism. Proc Natl Acad Sci USA 95:8681–8685
Lieberman DE, McCarthy RC 1999 The ontogeny of cranial base angulation in humans and chimpanzees and its implications for reconstructing pharyngeal dimensions. J Hum Evol 36:487–517
Magwene PM 2001 New tools for studying integration and modularity. Evolution 55: 1734–1745
Marroig G, Cheverud JM 2001 A comparison of phenotypic variation and covariation patterns and the role of phylogeny, ecology, and ontogeny during cranial evolution of new world monkeys. Evolution 55:2576–2600
Mezey JG, Cheverud JM, Wagner GP 2000 Is the genotype-phenotype map modular? A statisti-cal approach using mouse quantitative trait loci data. Genetics 156:305–311
Muller GB, Newman SA 2005 The innovation triad: an EvoDevo agenda. J Exp Zoolog B Mol Dev Evol 304:487–503
Noden DM, Trainor PA 2005 Relations and interactions between cranial mesoderm and neural crest populations. J Anat 207:575–601
Olson EC, Miller RA 1958 Morphological Integration. University of Chicago Press, Chicago
K2 Orkin RW, Pratt RM, Martin GR 1976 Undersulfated chondroitin sulfate in the cartilage matrix
of brachymorphic mice. Dev Biol 50:82–94
Petersson S, Persson AS, Johansen JE et al 2003 Truncation of the Shaker-like voltage-gated potassium channel, Kv1.1, causes megencephaly. Eur J Neurosci 18:3231–3240
Raff RA 1996 The Shape of Life. University of Chicago Press, Chicago
Schlosser G, Wagner GP 2003 Introduction: The Modularity Concept in Developmental and Evolutionary Biology. In: Schlosser G, Wagner GP (eds) Modularity in Development and Evolution. University of Chicago Press, Chicago, p 1–11
Sheets HD 2004 IMP Simple3D
Spector JA, Greenwald JA, Warren SM, et al 2002 Dura mater biology: autocrine and paracrine effects of fi broblast growth factor 2. Plast Reconstr Surg 109:645–654
Wagner GP 1989 A comparative study of morphological integration in Apis mellifera (Insecta, Hymenoptera). Z zool Syst Evolut Forsch 28:48–61
Wagner GP 1995 Adaptation and the modular design of organisms. In: Morán F, Merelo JJ, Chacón P (eds) Advances in Artifi cial Life. Springer Verlag, Berlin, p 317–328
Wagner GP 1996 Homologues, natural kinds and the evolution of modularity. Am Zool 36:36–43
Wagner GP, Booth G, Bagheri-Chaichian H 1997 A population genetic theory of canalization. Evolution 51:329–347
Wagner GP, Mezey JG 2003 The role of genetic architecture constraints in the origin of varia-tional modularity. In: Schlosser G, Wanger GP (eds) Modularity in Development and Evolu-tion. University of Chicago Press, Chicago, p 338–358
Wang K-Y, Diewert VM 1992 A morphometric analysis of craniofacial growth in cleft lip and noncleft mice. J Craniofac Genet Dev Biol 12:141–154
Wang KY, Juriloff DM, Diewert VM 1995 Defi cient and delayed primary palatal fusion and mesenchymal bridge formation in cleft lip-liable strains of mice. J Craniofac Genet Dev Biol 15:99–116
Waters MJ, Kaye PL 2002 The role of growth hormone in fetal development. Growth Horm IGF Res 12:137–146
Wilkie AO, Morriss-Kay GM 2001 Genetics of craniofacial development and malformation. Nat Rev Genet 2:458–468
Willmore KE, Leamy L, Hallgrimsson B 2006a Effects of developmental and functional inter-actions on mouse cranial variability through late ontogeny. Evol Dev 8:550–567
Willmore KE, Zelditch ML, Young N, Ah-Seng A, Lozanoff S, Hallgrimsson B 2006b Canali-zation and developmental stability in the brachyrrhine mouse. J Anat 208:361–372 Wright S 1932 General, group and special size factors. Genet Med 15:603–619
Young N 2004 Modularity and integration in the hominoid scapula. J Exp Zoolog B Mol Dev Evol 302:226–240
Young NM, Hallgrimsson B 2005 Serial homology and the evolution of mammalian limb covariation structure. Evolution 59:2691–2704
Yu JC, Lucas JH, Fryberg K, Borke JL 2001 Extrinsic tension results in FGF-2 release, mem-brane permeability change, and intracellular Ca++ increase in immature cranial sutures. J Craniofac Surg 12:391–398
Zelditch ML, Mezey J, Sheets HD, Lundrigan BL, Garland T Jr 2006 Developmental regulation of skull morphology II: ontogenetic dynamics of covariance. Evol Dev 8:46–60
DISCUSSION
Weiss: You said that if the cranium is bigger you get more fl exion. This is a fi nding within species. Are you also saying that there is a constraint based on their
8
cmp12.indd 185
K2
evolutionary history that they have a certain basic shape? There could be multiple pathways to get the same basic shape: this must have been constrained in some way so that the alternatives for each of the components (brain and face) don’t end up each with a viable structure but that doesn’t ‘fi t’ the other structure. The traits can’t evolve totally independently so they are compatible with each other. Yet your analysis shows them to vary, in your experimental animals, independently. Can you clarify how you think that happens?
Hallgrimsson: The argument I am making is about the appropriate level of evo-lutionary explanation if we want to know the developmental determinants of cra-niofacial shape. If you are asking why the brain is bigger, there is a different set of answers. But if you are asking why the skull is shaped the way it is in animals that have large brains, then what matters is the developmental interaction that increased brain size produces, not a specifi c developmental determinant that will increase brain size. There is a level of epigenetic interaction there which we understand: the relationship between brain size and the shape of the skull. The lower levels are interesting but we can forget about them for the purposes of that particular explanation.
Lieberman: These components are already deeply constrained by the general structure of skulls. Brains have to sit on cranial bases and inside the neurocran-ium, and faces have to grow forwards. These architectural spatial relation-ships constrain the way in which bones grow, limiting the number of ways these units interact in the fi rst place. The system constrains how variation can interact.
Cheverud: The constraint is even directional: the cranial base will be formed before the face. It is not a two-way thing. The face has to adjust.
Budd: Why did you choose to call these three components of the skull ‘modules’?
Hallgrimsson: They are modules by virtue of the dominant infl uences of particu-lar developmental processes. For instance, the basicranium is primarily endochon-dral in origin.
Budd: So it is a developmental defi nition.
Hallgrimsson: We are making assumptions about the major developmental infl u-ences acting on particular regions of the skull.
Lieberman: There is also a classic paper showing that in terms of the various structures of the skull, these units do actually behave as units (Chevrud 1982).
K2 Coates: You appear to have the data to look at other possible modules where you
might expect to fi nd separation of variation, such as within the mandibular arch, or derivatives of other visceral arches.
Hallgrimsson: This is a diffi cult thing to do. We have done that in outbred mice and have tried to replicate Jim Chevrud’s studies on primates. The covariation structure of the mouse skull seems to be quite different from primates, however. We detect the chondrocranial module, but the base and neurocranium don’t sepa-rate out so much. The problem is the number of potential modular developmental processes. The importance of each of these processes in different species can vary, which would produce a different covariance. If we see similarity in covariance structure this is not because these developmental systems are not capable of pro-ducing different covariance structures, it will probably because the variance with associated with the different tends to be similar across species.
Hanken: Even the most ardent selectionist wouldn’t deny that in any generation variation is limited. This in itself doesn’t have any signifi cance for evolution. It is whether over evolutionary time the developmental system will still limit variation in a predictable way despite strong selection to do otherwise. Yesterday we learned that the covariance matrix itself is subject to selection. Where is there great sig-nifi cance here for microevolution or macroevolution, given that it is artifi cial strains looking over short numbers of generations, and the features themselves are subject to selection?
Cheverud: The alleles that we are sampling the effects of are drawn from the base population of all mice, which was a mixed population of different subspecies. They are natural alleles that are drawn from populations. The affects of the alleles aren’t so unnatural; the unnaturalness of the population is in its allele frequencies, designed to be powerful for gene mapping. The gene frequencies are ideal for mapping.
Stern: I would take issue with the statement that the alleles are ‘natural’. They are alleles that survive an inbreeding process in a laboratory. We have no idea whether that represents a biased subset of alleles.
Lieberman: True enough. But one idea behind it was not to look at particular alleles, but rather to try to do an experiment in which we modifi ed the relative size and shape of a particular skull. The only other way people have tended to do this is to do general comparative analyses of different organisms. The problem with that type of analysis is you don’t know what all the other effects are that are taking place.
Hallgrimsson: The mouse models we are using don’t give the complete answers. It is one way of approaching the question. The advantage we have is that we know what the developmental process is. If you want to do this in an outbred mouse you would come up with some interesting morphometric results, but they would be
cmp12.indd 187
K2
hard to interpret. The relationship between the growth of the brain and the length of face and basalicranium is an interesting one, because this can be tested.
Wilkins: I was intrigued by you saying that the developmental architecture remained the same. I would say that developmental processes remain the same on the whole, but the genetic architecture is presumably subtly different in these mutants. Would you agree with this distinction?
Hallgrimsson: Yes.
Brakefi eld: Do you think you would see a lot of mutant–environment interactions if you did the whole study in a different setting? Presumably these animals are reared in a favourable environment. Would you see different patterns if you were to rear the same series of mutants in different temperatures or a more natural diet?
Cheverud: In the US that would probably be illegal.
Lieberman: Someone needs to do release some C57BL onto an island somewhere!
Brakefi eld: How robust is your interpretation of phenomena such as integration if you also take an environmental axis into account?
Hallgrimsson: If you introduce environmental variance, you are introducing covariation.
Jernvall: This is something that we have seen with teeth. Every time there is a knockout or a mouse with experimentally altered level of gene expression, variance goes through the roof. This raises the question if you keep breeding these mutant strains does the variance go down?
Hallgrimsson: No one has done this.
Hall: With the brachymorph mutant you said the integration was much higher. I assumed this was because brachymorph had been inbred for some time.
Hallgrimsson: The brachymorphs and the C57 controls should differ only in the presence of the brachymorph mutation. The same is true for the other models in which the comparison is to littermate siblings that are not carrying the mutation. So there should be no difference in inbreeding between the mutants and controls in any of the studies that I talked about.
K2 all the centres of ossifi cation and the cartilaginous partitions between them. There
are as many as eight centres of ossifi cation involved here. As we go from front to back we can see changes in these units going from associations with the face to associations with the cranium. This again makes me wonder about the reality of units, and whether or not there is a different kind of integration going on here.
Hallgrimsson: That was the point of my preface in which I was superimposing these different developmental processes. There is a large number of developmental processes that leave covariation signatures. All you need is for a process to affect some structures and not others for this to infl uence the covariation structure. Since you have many of these in the skull, there is a complex series of overlaying covaria-tion structures. When you are looking at the adult covariacovaria-tion structure, whether or not you can pick up on these depends on how strong they are.
Oxnard: I am talking about primates, but it seems they can be picked up strongly once you look for them. If you assume you have a module you won’t fi nd continuity.
Hallgrimsson: The corollary to that is when you do this sort of analysis you get an uninterpretable matrix in which there doesn’t appear to be a pattern. It doesn’t mean development isn’t modular. It means not enough of the modules are impor-tant enough to leave a strong enough imprint.
Oxnard: This leads to something else. One has to use anatomy to defi ne points to do morphometrics. People argue about these points. For example, the base and apex of the styloid process are commonly used as such points. The styloid process, however, comprises as many as four centres of ossifi cation. Which centres are actually fused into the fi nal adult styloid process is quite variable. Therefore the points based upon it may well not be developmentally homologous. Such points may be different things in different animals.
Lieberman: Earlier you described the general structure and development of the mammalian skull. One interesting point is that the kinds of covariance interactions seen in the mice are surprisingly similar to the ones seen across humans. This tells us that the basic construction of the skull is more-or-less the same in different creatures. They are altered in similar ways leading to only so many kinds of variation.
R Raff: I speak from total ignorance on this topic. Supposing you select for horns, and get horned mice. What is likely to happen? Will you be breaking some constraints?
Hallgrimsson: Then you have introduced a new covariance determining process. Chris Klingenberg and one of his students have done a morphometric analysis of sheep with and without horns. The covariance structure is dominated by the horns if they are there.
Ackermann: Part of the point in getting an alteration in the covariance structure is that this may itself be an indicator of selection. Having a relatively stable
covari-cmp12.indd 189
K2
ance structure across early development, or changes in covariation early in devel-opment, might be indicative of the action of non-random process. You should be able to test for this.
Lieberman: It would be interesting to look at these covariation structures over ontogeny.
Ackermann: You would have to do it on a population level.
Cheverud: There are very few such populations around, but there are some.
Reference
K2 malian skull.
bins.indd 1
K2