Submitted: January 01, 2014 Accepted: January 10, 2014 Published: May 10, 2014
Corresponding Author: Sugeng Heri Suseno, Department of Aquatic Products Technology, Bogor Agricultural University, Bogor Agricultural University (Dramaga Campus), Jl. Agatis, Bogor West Java, Indonesia, Tel.: +62 251) 8622909-8622906; Fax: (+62 251) 8622907
Inventory and Characterization of Sardine (
Sardinella
Sp.) Oil from Java Island-Indonesia
Sugeng Heri Suseno, Jeny Ernawati Tambunan, Bustami Ibrahim and Saraswati
Department of Aquatic Products Technology, Bogor Agricultural University, Bogor Agricultural University (Dramaga Campus), Jl. Agatis, Bogor West Java, Indonesia
Abstract: Parameter of fish oil quality could be observed from an omega-3 fatty acid content, antioxidant activity, Peroxide Value (PV), Free Fatty Acid (FFA) value, total oxidation (totox) value, density and viscosity, level of toxicity and its heavy metals content. This study aimed to determine the quality of sardine oils which was obtained as by product of fish meal and fish canning industry. Sardine A and B had different fatty acid composition. Based on toxicity test, it was known that sardine oil B (572.02 ppm) had higher toxicity than sardine oil A (726.03 ppm). Heavy metal analysis results showed that sardine oil A had Pb concentration at 0.118 ppm, it passed a standard limit (≤0.1 ppm) and it might be harmful for consumption. Peroxides value of sardine oil A and B was 13.33 meq/kg and 5.00 meq/kg, respectively. The highest FFA value was sardine oil B (3.948%) then followed by sardine oil A (0.423%). Value of p-anisidine of sardine oil A and B was 1.09 and 0.88 meq/kg. The highest totox value was sardine oil A (27.76 meq/kg) then followed by sardine oil B (10.88 meq/kg). Viscosity of sample B (270 cPs) was higher than A (69 cPs) and sample B (1.02 g/cm3) was denser than sample A (0.92 g/cm3).
Keywords: By products, chemical quality, omega-3, physical quality, sardine oil, Sardinella sp
INTRODUCTION
Omega-3 fatty acids especially EPA (Eicosapentaenoic acid) and DHA (Docosahexaenoic acid) can affect human health. The mentioned fatty acids are needed in the development of the brain and the retina (Spector, 1999; Crawford et al., 1999), the development of the premature baby brain (Uauy and Hoffman, 2000), prevent variety of cancer disease (Terry, 2003; Hardman, 2004), lowering side effects of chemotherapy on cancer patients (Hardman, 2004), prevent atherosclerosis and give positive impacts on lipid metabolism (Mori et al., 1999), lowering the depressive symptoms (Tiemeier, 2003), fix tolerance against glucose on diabetics (Mori et al., 1999) and prevent lupus and athritis (Jolly et al., 2001).
One of fish species which has a great potential as a source of omega-3 in Indonesia was sardines (Sardinella sp.). Sardine is included to high fatty fish with a various fat content. The different of fat content depend on the size, maturity, season and food. Sardine oil which usually found in Indonesia is a byproduct of fish meal and fish canning industry, it has not been optimized as a source of an omega-3 fatty acid. Yunizal (2002) recorded that in 1996 the number of sardine oils as by product from fish processing industry was about 4,300 tons. According to Khoddami et al. (2009), mostly sardine oil contained high concentration of omega-3. Characterization of sardine oil is important, because it can be a consideration for further use.
MATERIALS AND METHODS
Materials and equipments: The main material that
used in this study was sardine oils from fish meal and fish canning industry in Muncar (East Java) and Pekalongan (Central Java). Other materials which used were 96% ethanol, phenolphthalein indicator, KOH 0.1 N, chloroform, glacial acetic acid, saturated solution of potassium iodida, aquades, 1% starch, Na2S203 0.1 N, isooctane, p-anisidine reagent, (hexana) and the materials which used for fatty acid composition analysis.
Some equipments whice were used in this study were alumunium foil, stop watch, digital scale, burettes, glasses, UV-Vis spectrophotometer 2500 (LaboMed), gas chromatography GC 2010 plus AFA PC
(SHIMADZU), syringe 10 μL, water bath, analytical
scale and micro pipette.
1996), density analysis which according to BSN (1992), viscosity analysis (O'Brien et al., 2000), toxicity analysis which according to Meyer et al. (1982) and heavy metal content (BSN, 2009).
RESULTS AND DISCUSSION
Fatty acid composition: Based on the data obtained,
the composition of the fatty acids in sample A was dominated by saturated fatty acids/SFA (28.96%) then followed by polyunsaturated fatty acid/PUFA (26.79%). Fatty acid composition of sample B was similar to the sample A, it was dominated by SFA (31.16%) then followed by PUFA (24.21%). Its monounsaturated fatty acid/MUFA was 15.96%. The fatty acid compositions are difference between one species to another species. The different composition of fatty acid depend on various factors such as temperature, season, place of growing, fish species, age, sex and dietary habits (Saito et al., 1997; Bandarra
et al., 1997; Tanakol et al., 1999). Fatty acid composition of sample A and B is shown in Table 1.
Palmitic acid was the highest SFA in sample A (15.90%) and also sample B (16.81%). Both samples containing C16:0, but its content in sample A was fewer compared than sample B. It showed that there was a difference in the ability of the fatty acids biosynthesis and the intake of fatty acids which were consumed by
fish (Iverson et al., 2002). Oleic acid dominated the MUFA content of sample B (8.61%) and it was about 8.43% in sample A.
Based on Table 1, the percentage of EPA+DHA of sampe A and B was 22.77 and 19.62%, respectively. The content of omega-3 fatty acids in fish are not the result of pure synthesis in fish body, but it can be caused by food intake of fish such phytoplankton, zooplankton, algae, copepods and shellfish which are known contain omega-3 (Ackman, 1980). Environmental parameters also affect the composition of the unsaturated fatty acid compounds (Ould et al., 2003). Meanwhile, the content of PUFA on sample a (26.79%) was higher than sample B (24.21%).
Antioxidant activity: Rancimat method was used in
this study. The principle of this test is the process of oxidation is accelerated by the presence of air flow and heat (temperature was 100°C). Induction time is measured as the time required reaching the end point of oxidation associated with a detectable level of rancidity or sudden changes in the level of oxidation and is usually associated with the shelf life of the product (Pressa-Owens et al., 1995). Test results of antioxidant activity can be seen in Table 2.
Based on the data obtained, sample A had shorter induction time (0.18 h) than sample B (4.085 h). The longer induction time indicated that the sample had
Table 1: Fatty acid composition of sardine (Sardinella sp.) oil
Fatty acid
Result (%w/w)
---A B
Lauric Acid, C12:0 Myristic Acid, C14:0 Pentadecanoic Acid, C15:0 Palmitic Acid, C16:0 Heptadecanoic Acid, C17:0 Stearic Acid, C18:0 Arachidic Acid, C20:0 Heneicosanoic acid, C21:0 Behenic Acid, C22:0 Tricosanoic Acid, C23:0
ƸSFA
Miristoleic Acid, C14:1 Palmitoleic Acid, C16:1 Elaidic Acid, C18:1n9t Oleic Acid, C18:1n9c Cis-11-Eicosenoic Acid C20:1 Erucic Acid, C22:1n9 Acid Nervonat, C24:1
ƸMUFA
Linolelaidic Acid, C18:2n9t Linoleic Acid, C18:2n6c
ϒ-Linoleic Acid, C18:3n6 Linoleic Acid, C18:3n3
Cis-11,14-Eicosedienoic Acid C20:2 Cis-8,11,14-Eicosetrienoic Acid, C20:3n6 Cis-11,14,17-Eicosetrienoic Acid C20:3n3 Arachidonic Acid, C20:4n6
Cis-5,8,11,14,17-Eicosapentaenoic Acid, C20:5n3 Cis-4,7,10,13,16,19-Docosahexaenoic Acid, C22:6n3
Table 2: Antioxidant activity of sardine oil
Sample Induction time (h)
A 0.18±0.00
B 4.08±0.12
(A) Sardines Muncar and (B) Sardines Pekalongan
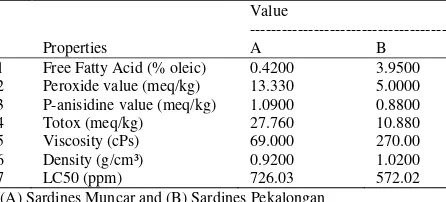
Table 3: Physico-chemical characterteristic of sardine (Sardinella
sp.) oil
Properties
Value
---A B
1 Free Fatty Acid (% oleic) 0.4200 3.9500 2 Peroxide value (meq/kg) 13.330 5.0000 3 P-anisidine value (meq/kg) 1.0900 0.8800 4 Totox (meq/kg) 27.760 10.880 5 Viscosity (cPs) 69.000 270.00 6 Density (g/cm³) 0.9200 1.0200 7 LC50 (ppm) 726.03 572.02 (A) Sardines Muncar and (B) Sardines Pekalongan
better stability, since it can be inferred, the antioxidant activity of sample B was better than sample A. If it is compared to the PUFA content of sardine oils, sample B has a lower PUFA than A, so sample A is potential to be oxidized rapidly.
Peroxide value: Result of peroxide value analysis can be seen in Table 3. Peroxide value of sample A and B was 13.33 meq/kg and 5.00 meq/kg. The lower peroxide value means the better the quality of fish oil. Peroxide value in the fish oil should be valued at about
≤5.00 meq/kg (IFOS, 2011). Huss (1998) stated that the
content of unsaturated fatty acid compounds in fish oil can stimulate the onset of oxidative damage and the speed of oxidation of fish oil is higher than other types of fat or oil. Based on data, PUFA content of sample A was greater than sample B, it meant that sample A was more labile than B, so it can be oxidized faster and then formed peroxide products. Some factors which can enhance oxidation process are the presence of oxygen, peroxydase enzymes, heat, radiation (light) and the presence of monovalent or bivalent ion (Kusnandar, 2011).
P-anisidine value: P-anisidine value indicates the
estimation of the further decomposition of fat/oil which is induced by advanced oxidation (Irianto and Giyatmi, 2009). Result of p-anisidine value can be seen in Table 3. The value of anisidine in sample A (1.09 meq/kg) was higher than sample B (0.88 meq/kg). The value of p-anisidine should be lower than 15 meq/kg (IFOS, 2011).
Free fatty acid: The formation of free fatty acids
occurs due to hydrolysis and oxidation of oil which is caused by the presence of free radicals and parsing double bonds during heating (Paul and Mittal, 1997). Free fatty acid value of samples is shown in Table 3. Free fatty acid value of sample A and B was 0.42 and 3.95%. Free fatty acid value of fish oil should be lower than 1.5% (IFOS, 2011). An indication of the degree of
hydrolysis occurs in oil can be determined by free fatty acid content (Berger, 1997). Results showed that the value of free fatty acid in sample A didn't match to standard but the value of free fatty acid in sample B appropriated to standard limit.
Total oxidation (TOTOX) value: Total oxidation is
the summation between the twice of peroxide value and p-anisidin value.
The totox value in sample A and B was 27.76 meq/kg and 10.88%, respectively. Fish oil should have a totox value which is lower or equal to 20 meq/kg (IFOS, 2011). The total oxidation value can be used to measure the progressivity of deterioration process that occurs in oil and provides information on the formation of primary as well as secondary oxidation products (Hamilton and Rossell, 1986).
Density: Density is the amount of a substance on a
volume unit. Density of sample B was 1.02 g/cm3 while the density of sample A was 0.92 g/cm3. The higher density value indicated the more components were contained in the sample. Marcia et al. (2002) stated that temperature and shear rate will effect to changes in the density and the viscosity of the CPO (Crude Palm Oil). The density of CPO tended to decrease when temperature was increasing. However, changes in density because of temperature changes are relatively smaller compared to its viscosity changes.
Viscosity: Matuszek (1997) stated that the force
required to start fluid flow on certain speed is related to the fluid viscosity. Based on Table 3, viscosity value of sample B was higher than sample A. The viscosity value of sample B was 270 cPs while viscosity value of sample A was 69 cPs. Similar conditions also occur in the density value of the two samples of fish oil. Gentry (2013) stated that the viscosity of the fluid was caused by changes in temperature; the viscosity of the fluid will decrease with increasing temperature. Sample A was predicted had been exposed to very high temperature during process, so it can affect the lower value of viscosity.
Toxicity: Toxicity analysis can be used as an
introduction on research that leads to cytotoxic assay (Meyer et al., 1982). Parameter used to indicate the presence of a compound which has biological activity that can cause the death of Artemia salina (Meyer et al., 1982). The result of BSLT (Brine Shrimp Lethal Test) can be seen in Table 3. It was known that sample B was more toxic than B. LC 50 value of sample A and B was 726.03 and 572.02 ppm.
Heavy metal: Heavy metals are harmful for body,
Table 4: Heavy metal content of sardine (Sardinella sp.) oil
Sample
Heavy metal
---
Standard
Cd Pb Ni As Hg
A <0.005 0.118 0.051 0.0720 0.003 ≤0.1 ppm
B <0.005 0.095 0.018 <0.005 0.008 ≤0.1 ppm (A) Sardines Muncar and (B) Sardines Pekalongan
damage the lungs, kidneys and other vital organs (Darmono, 1995). Based on research results, most of heavy metals concentration in fish oil is still lower than standard limit (<0.01 ppm), except the Pb concentration in sample A. So it may be concluded that both of samples were relatively safe for consumption (Table 4).
CONCLUSION
Sardine oil A and B had different fatty acid composition. Based on toxicity test, it was known that sample B was more toxic than sample A. Heavy metal testing result showed that both of samples were harmless and a safe for consumption because of the heavy metals content was under limit standard (≤0.1 ppm). The highest peroxides can be found in sample A (13.33 meq/kg). The highest FFA value was in sample B (3.95%). The highest p-anisidin value and totox value can be found in sample A (1.093 meq/kg and 27.76 meq/kg). Refining and purification process can be done to improve the quality fish oil, so it can give the value-added to the fish oil as fish meal and fish canning industry by product which has great potential as a source of omega-3.
ACKNOWLEDGMENT
We would like to give thanks to Directorate General of Higher Education, Ministry of Education and Culture of Republic Indonesia who gave their support by funding this research. This study completion would not have been possible without the assistance of many people who gave their support. To them I would like to convey my heartfelt gratitude and sincere appreciation.
REFERENCES
Ackman, R.G., 1980. Fish Lipids. In: Connell, J.J. (Ed.), Advances in Fish Science and Technology. Fishing News Books, Farham, Surrey, pp: 86-103. AOAC, 1999. Official Method of Analysis of the
Association of Official Analytical of Chemist. Association of Analytical Chemist, Inc., Arlington, Virginia, USA.
AOAC, 2000. Official Methods of Analysis of the Association of Official Analytical of Chemist. 17th Edn., Association of Analytical Chemist, Inc., Washington, USA.
Bandarra, M.N., I. Batista, M.L. Nunes, J.M. Empis and W.W. Christie, 1997. Seasonal changes in lipid composition of sardine (Sardina pilchardus). J. Food Sci., 62: 40.
Beirao, A.R.B. and M.G. Bernardo-Gil, 2005. Antioxidant from Lavandula luisieri. Retrieved form: http://www.enpromer2005.eq.ufrj.br. (Accessed on: September 2, 2011)
Berger, K.G., 1997. Industrial frying. Int. News Fats, Oils Relat. Mater., 8: 812-814.
BSN, 1992. Food and Drinks Test SNI 01-2891-1992. Indonesian National Standardization Organization, Jakarta.
BSN, 2009. Maximum Limit of Heavy Metal Impurities in Food SNI No 7387:2009. Indonesian National Standardization Organization, Jakarta.
Crawford, M.A., M. Bloom, C. Leigh Broadhurst, W.F. Schmidt, S.C. Cunnane, C. Galli, K. Ghebremeskel, F. Linseisen, J. Lloyd-Smith and J. Parkington, 1999. Evidence for the unique function of decosahexaenoic acid during the evolution of the modern hominid brain. Lipids, 34: S39-S45. Darmono, 1995. Metals in Biological Systems. UI
Press, Jakarta.
Gentry, 2013. Viscosity of Bio-diesel Fuels. http://www.lasalle.edu/~gentry/C331/Lab.%20Bio diesel.%20Viscosity.pdf (Accessed on: December 20, 2013).
Hamilton, R.S. and J.B. Rossell, 1986. Analysis of oils and fats. Elsevier Applied Science, London, pp: 23-32.
Hardman, W.E., 2004. N-3 fatty acids to augment cancer therapy. J. Nutr., 134: 3427S-3430S.
Huss, H., 1998. Fresh fish quality and quality changes. FAO, Rome, Italy.
IFOS, 2011. Fish oil purity standards. Retrieved form:
http://www.omegavia.com/best-fish-oil-supplement-3/. (Accessed on: June 27, 2013) Irianto, H.E. and S. Giyatmi, 2009. Fish Processing
Technology. Universitas Terbuka, Jakarta (ID). Iverson, S.J., K.J. Frost and S.L.C. Lang, 2002. Fat
content and fatty acid composition of forage fish and invertebrates in Prince William Sound, Alaska: Factors contributing to among and within species variability. Mar. Ecol-Prog. Ser., 241: 161-181. Jolly, C.A., A. Muthukumar, C. P. R. Avula, T. Dean
and G. Fernandes, 2001. Life span is prolonged in food-restricted autoimmune-prone (NZB × NZW) F (1) mice fed a diet enriched with (n-3) fatty acids. J. Nutr., 131(10): 2753-2760.
Khoddami, A., A. Ariffin, J. Bakar and Ghazali, 2009. Fatty acid profile of the oil extracted from fish waste (head, intestine and liver) (Sardinella lemuru). World Appl. Sci., 7(1): 127-131.
Kusnandar, F., 2011. Food Chemistry: Macro Components. Dian Rakyat, Jakarta (ID).
Matuszek, T., 1997. Rheological Properties of Food System. In: Z.E. Sikorski (Ed.), Chemical and Functional Properties of Food Components. Technomic Publishing Co., Inc., Lancaster, PA, pp: 169-189.
Meyer, B.N., N.R. Ferigni, J.E. Putnam, L.B. Ja Cobsen, D.E. Nichols and J.L. McLaughlin, 1982. Brine shrimp: A convenient general bioassay for active plant constituen. Planta. Med., 45(5): 31-4. Mori, T.A., Q.B. Danny Q Bao, B. Valerie, I.B.
Puddey, G.F. Watts and L.J. Beilin, 1999. Dietary fish as a major component of a weight-loss diet: Effect on serum lipids, Glucose and insulin metabolism in overweight hypertensive subjects. Am. J. Clin. Nutr., 70(5): 817-825.
O'Brien, R.D., W.E. Farr, P.J. Wan, 2000. Introduction to Fats and Oils Technology. AOCS Press, Champaign, Illinois.
Ould, E.K.M.V., G. Barnathan, Y. Siau, J. Miralles and E. M. Gaydou, 2003. Fatty acid distribution in muscle, liver and gonads of rays (Dasyatis marmorata, Rhinobatos cemiculus and Rhinoptera marginata) from the East Tropical Atlantic Ocean. J. Agr. Food. Chem., 51: 1942-1947.
Paul, S. and G.S. Mittal, 1997. Regulating the use of degraded oil/fat in deep-fat/oil food frying. Crit. Rev. Food Sci. Nutr., 37(7): 635-662.
Perrin, J.L., 1996. Determination of Alteration. In: Karleskind, A. and J.P. Wolff (Eds.), Oils and Fats. Manual Vol. 2. Manual Lavoisier Publishing, Paris. (France)
Pressa-Owens, S., M.C. Lopez-Sabater and M. Rivero-Urgell, 1995. Shelf-life prediction of an infant formula using an accelerated stability test (rancimat). J. Agr. Food Chem., 43: 2879-2882. Saito, H., K. Ishihara and T. Murase, 1997. The fatty
acid composition in tuna (bonito, Euthynnus pelamis) caught at tree defferent localities from tropics to temperete. J. Sci. Food. Agr., 73: 53-59. Spector, A.A., 1999. Essentiality of fatty acids. Lipids,
34: S1-S3.
Tanakol, R., Z. Yazici, E. Sener and E. Sencer, 1999. Fatty acid composition of 19 species of fish from the Black Sea and the Marmara Sea. Lipids, 34: 291-297.
Terry, P.D., 2003. Intakes of fish and marine fatty acids and the risks or cancer of the breast and prostate and of other hormone-related cancers: A review of the epidemiologic evidence. Am. J. Clin. Nutr., 77(3): 532-543.
Tiemeier, H., 2003. Plasma fatty acid composition and depression are associated in the elderly: The Rotterdam study. Am. J. Clin. Nutr., 78(1): 40-46. Uauy, R. and D.R. Hoffman, 2000. Essential fat
requirements of pretem infants. Am. J. Clin. Nutr., 71(1): 245S-250S.
Watson, C.A., 1994. Official and Standardized Methods of Analysis. 3rd Edn., The Royal Society of Chemistry, Cambridge (UK).