Kinetic Study of Free Fatty Acid Adsorption Using Adsorbent in
Sardine (Sardinella sp.) Oil Refining
Sugeng Heri Suseno1, Ayu Fitri Izaki2, Pipih Suptijah3, Agoes Mardiono Jacoeb4, Saraswati5
1
Fisheries and Marine Sciences Faculty, Bogor Agricultural University Jl. Agatis, Dramaga 16680 (Bogor, Indonesia)
2
Fisheries and Marine Sciences Faculty, Bogor Agricultural University Jl. Agatis, Dramaga 16680 (Bogor, Indonesia)
3
Fisheries and Marine Sciences Faculty, Bogor Agricultural University Jl. Agatis, Dramaga 16680 (Bogor, Indonesia)
4
Fisheries and Marine Sciences Faculty, Bogor Agricultural University Jl. Agatis, Dramaga 16680 (Bogor, Indonesia)
5
Fisheries and Marine Sciences Faculty, Bogor Agricultural University Jl. Agatis, Dramaga 16680 (Bogor, Indonesia)
_________________________________________________________________________________
ABSTRACT—In Fish oil can be produced from fish meal industry by-products, but its fish oil has uninteresting color and high free fatty acids content so it needs to be purified. This study aimed to determine fatty acid profile of sardine oil, to determine free fatty acid adsorption kinetics model, and to determine sardine oil clarity after purification. Pseudo second order (k2) of attapulgite, bentonite, and chitosan treatment was 0.0344 g mg-1min-1, 0.0222 g mg-1min-1, and 0.0460 g mg-1min-1, respectively. The equilibrum adsorption capacity (qs) of attapulgite, bentonite, and chitosan treatment was 56.53 mg/gram, 42.40 mg/gram, and 47.11 mg/gram. The external film mass-transfer coefficient (KsA) was 0.0018 mL/s for attapulgite treatment, 0.0015 mL/s for chitosan treatment, and 0.0013 mL/s for bentonite treatment. The intraparticular diffusion coefficient (Kw) was 0.1542 mg mL-1 min-0.5 for attalpugite treatment, 0.1285 mg mL-1 min-0.5 for chitosan treatment, and 0.1156 mg mL-1 min-0.5 for bentonite treatment. Clarity for all treated fish oil increase with the increasing of adsorption time, and the equilibrum point has been reached at 60 minutes. Results indicated that attapulgite was the best adsorbent than chitosan and bentonite for free fatty acid removal from sardine oil.
Keywords—adsorption, free fatty acid, kinetics model, purification, pseudo-second order, sardine oil
_________________________________________________________________________________
1.
INTRODUCTIONFish oil is an important source of polyunsaturated fatty acids (PUFA), especially eicosapentanoic acid (EPA, 20:5
ω=3) and docosahexaenoic acid (DHA, 22:6 ω=3) as beneficial for physiological activity. The content of EPA and DHA in fish oil varies at 5-26% and 6-26% of total fatty acids [2]. EPA is beneficial for the heart and cardiovascular healthy, while DHA is beneficial for pregnancy, newborn development , nerve and brain development [10].
Fish oils in Indonesia are generally derived from fish meal industry or canned fish industry by products. Utilization of fish oil that obtained from fish meal industry is very limited, because of its low quality of fish oil, e.g. oil unattractive color and its high level in free fatty acid. This is due to the raw materials which are used in fish meal industry are fish with low quality, or the head, skin, and viscera which are removed from the fish canning industry. Damaged fats in low quality fish can increase its free fatty acids content [8]. Therefore, to optimize utilization of fish oil which derived from fish meal industry, it needs to be purified by some treatments.
bentonite, and chitosan in fish oil purification are still limited. Sathivel et al. [17] stated that the study of fish oil purification was only focused in removing impurities from fish oil, on the other hand, the information of kinetic studies in imputity adsorption is important to produce the most effective process in terms of both quality and economy. The purpose of this study was to determine sardine oil fatty acid profile, to determine the kinetics model of adsorption process in decreasing levels of free fatty acids, and to determine sardine oil clarity after purification process using adsorbent.
2.
MATERIALS AND METHODS2.1 Materials and Equipments
Materials used in this study were sardine oil as fish meal industry by product and adsorbents such as chitosan, attapulgite, and bentonite. Materials used for the analysis included 96% neutral alcohol, PP indicator (phenolphthalein) 1%, KOH 0.1 N, n-hexane, and materials for fatty acid analysis using gas chromatography (GC).
Equipments used for the refining process were erlenmeyer glass, pipette, digital scales, aluminum foil, magnetic stirrer, magnetic stirring bar, stop watch, and high-speed refrigerated centrifuge HIMAC (HITACHI CR 21G). Some equipments used in the analysis were burette, electric stove, gas chromatography instrument (Shimadzu GC2010), and UV-VIS spectrophotometer (UV-2500 RS LaboMed).
2.2 Scope of Research
This research was conducted in three stages, i.e. characterization of sardine oil as raw material, preliminary study, and primary study. Characterization of sardine oil was done by analyzing fatty acid profiles using GC and free fatty acids (FFA) content. Fish oil quality were observed after refining process including free fatty acid levels, and levels of fish oil clarity.
2.2.1 Fish Oil Refining
Preliminary research was done in the form of fish oil refining using adsorbents to determine the best adsorbent concentration. The best adsorbent concentration was used in the primary study. About 10 grams of unrefined sardine oil was put into erlenmeyer glass and adsorbent (chitosan, attapulgite, and bentonite) with a concentration of 1%, 3%, and 5% was added to weighed sardine oil. Adsorption process was performed with constant stirring using a magnetic stirrer at room temperature for 20 minutes, then a mixture of sardine oil and adsorbent was centrifuged (10,000 rpm, 10 º C for 10 minutes) to separate the adsorbent. FFA analysis was conducted to see the best concentration of adsorbent which give good quality. Treatment in preliminary study was performed in three replicates.
The primary study was done to obtain a kinetic model of each adsorption process using adsorbent with choosen concentration. About 50 grams of sardine oil was put into erlenmeyer and adsorbent (chitosan, attapulgite, and bentonite) with the choosen concentration was added to the weighed sardine oil. Adsorption process was performed with constant stirring using a magnetic stirrer at room temperature. All treatments were conducted for 100 minutes. Free fatty acid level was analyzed in a sample which was refined for 0 minute, 20 minutes, 40 minutes, 60 minutes, 80 minutes, and 100 minutes. Refined sardine oil was then centrifuged (10,000 rpm, 10ºC for 10 minutes) to separate the adsorbent from fish oil. Final quality of refined fish oil was analyzed, and quality parameter were free fatty acids ( FFA ) and the level of clarity.
2.2.3 Analysis of Fish Oil Quality
Some analysis conducted in this study were fatty acid profile analysis using gas chromatography [4] with no. method 969.33, free fatty acid analysis [5] with no. method Ca 5a-40, and the oil clarity test [3].
2.2.4 Data Analysis
Result of refining process was statistically processed using SPSS software version 16.0 to see the regression parameter coefficients, percent significance (confidence interval), and the pattern of interaction of factors that significantly influence the response. Tukey test was used to see significant effects of factors. Study of free fatty acid adsorption kinetics in this research was according to the pseudo second order Ho [11]. Transforming the data to the
pseudo second order model was done to determine kinetic parameters, i.e. k2 (constant rate of pseudo second order) and
3.
RESULT AND DISCUSSIONS3.1 The Sardine Oil Fatty Acid Profile
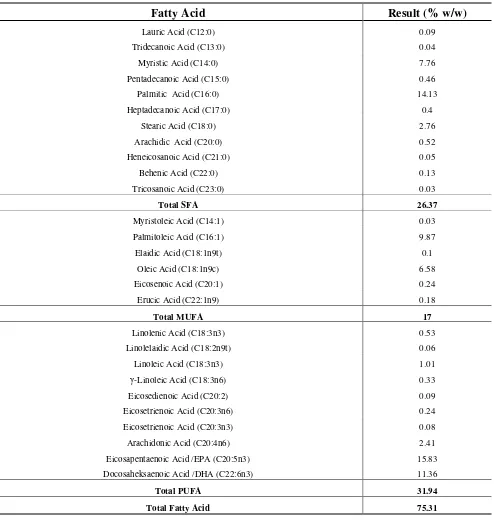
Fish oil contained varied fatty acids with the dominant fatty acids werer unsaturated carbon atom number 20 (C20) and 22 (C22). The dominant fatty acids belong to a group of omega-3 fatty acids. Results of fatty acid profile analysis of
fish oil from fishmeal industry’s by products presented in Table1.
Table 1: Fatty acid composition of unrefined sardine oil
Fatty Acid
Result (% w/w)
Lauric Acid (C12:0) 0.09
Tridecanoic Acid (C13:0) 0.04
Myristic Acid (C14:0) 7.76
Pentadecanoic Acid (C15:0) 0.46
Palmitic Acid (C16:0) 14.13
Heptadecanoic Acid (C17:0) 0.4
Stearic Acid (C18:0) 2.76
Arachidic Acid (C20:0) 0.52
Heneicosanoic Acid (C21:0) 0.05
Behenic Acid (C22:0) 0.13
Tricosanoic Acid (C23:0) 0.03
Total SFA 26.37
Myristoleic Acid (C14:1) 0.03
Palmitoleic Acid (C16:1) 9.87
Elaidic Acid (C18:1n9t) 0.1
Oleic Acid (C18:1n9c) 6.58
Eicosenoic Acid (C20:1) 0.24
Erucic Acid (C22:1n9) 0.18
Total MUFA 17
Linolenic Acid (C18:3n3) 0.53
Linolelaidic Acid (C18:2n9t) 0.06
Linoleic Acid (C18:3n3) 1.01
γ-Linoleic Acid (C18:3n6) 0.33
Eicosedienoic Acid (C20:2) 0.09
Eicosetrienoic Acid (C20:3n6) 0.24
Eicosetrienoic Acid (C20:3n3) 0.08
Arachidonic Acid (C20:4n6) 2.41
Eicosapentaenoic Acid /EPA (C20:5n3) 15.83
Docosaheksaenoic Acid /DHA (C22:6n3) 11.36
Total PUFA 31.94
Total Fatty Acid 75.31
3.2 Free Fatty Acid (FFA)
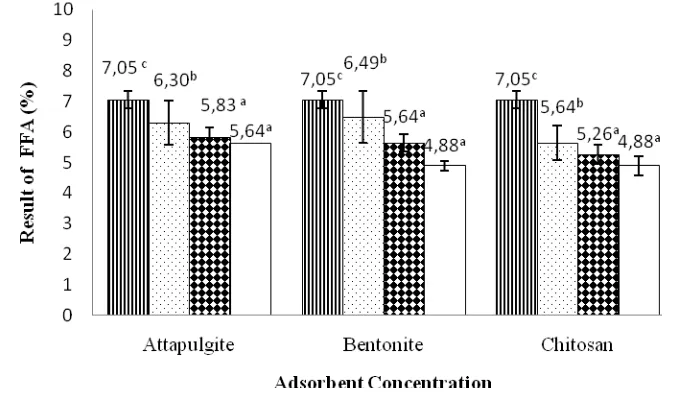
Levels of free fatty acids is one of the indicators used to assess the quality of fish oil. Free fatty acids produced when the hydrolysis of the triglyceride, and the fatty acids are apart from the glycerol structure [1]. Result of preliminary study can be seen in Figure 1.
Note : = addition of 0% adsorbent (control), = addition 1% of adsorbent, = addition of 3% adsorbent, and = addition of 5% adsorbent
Superscript a, b, c = significantly different to the concentration of adsorbent (p<0,05)
Figure 1: The Value of Free Fish Oil Fatty Acids with The Addition of Various Adsorbents at Different Concentrations
Based on the results, after the addition of the adsorbent with concentration of 0%, 1%, 3% and 5% in refining process (stirring for 20 minutes), fatty acids decreased, with a percentage of 10.64 to 20% for attapulgite treatment, 7.94 to 30.78% for bentonite treatment, and from 20 to 30.78% for chitosan treatmen. ANOVA analysis showed that the addition of adsorbent with different concentrations provided a significantly different effect on the value of free fatty acids. Tukey's test results showed that the concentration of 0% was significantly different adsorbents with a concentration of 1, 3 and 5%, while the concentration of 3% was not significantly different from the concentration of 5%. Therefore, the best treatment to reduce FFA content in the preliminary study was the addition of adsorbent concentration of 3%.
3.3 Kinetics Study of Free Fatty Acid Adsorption in Sardine Oil Refining
Kinetics model determination of free fatty acid adsorption in fish oil refining was done by adsorption of the time difference. Determination of the time difference was used to determine how fast the adsorption process takes place. The observation was based on the graph by making the relationship between percent reduction of FFA versus time. The graph is shown in Figure 2.
Note : = attapulgite, = bentonite, = chitosan
Figure 2: Effect of Adsorption Time on Reduction of FFA (%)
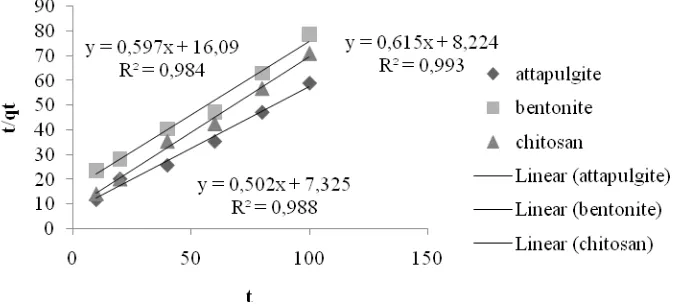
Adsorption model change over time requires a kinetic model approach. From the data obtained in Figure 2, the adsorption kinetics studies performed with reference to the pseudo second-order kinetics model of Ho [11]. Table of kinetics calculation results using pseudo second-order kinetics model of Ho [11] is shown in Figure 3. Based on Figure 3, the line equation of y = mx + b could be obtained. The equation used to calculate k2 and qe . The kinetic parameters calculation results can be seen in Table 2
Table 2: Comparison of kinetic parameters on each adsorbent
Adsorbent
Pseudo Second-order Ho (2006)
k2 H qe2
R2
qe.exp
(g mg-1min-1) (g mg-1min-1) (mg g-1) (mg g-1)
Attapulgite 0.0344 0.1365 1.992 0.988 1.692
Bentonite 0.0222 0.0622 1.675 0.984 1.269
Chitosan 0.046 0.1216 1.626 0.993 1.410
Adsorbent
Kadirvelu et al. (2000)
KsA Kw qs
(mL s-1) (mg mL-1
min-0.5)
(mg g-1)
Attapulgite 0.0018 0.1542 56.53
Bentonite 0.0013 0.1156 42.40
Chitosan 0.0015 0.1285 47.11
Note : k2 = pseudo second-order adsorption rate
h = Initial adsorption rate
qe2 = amount of free fatty acids are adsorbed at equilibrium pseudo second-order
qe.exp = amount of free fatty acids are adsorbed at equilibrium results study
KsA = the external film mass-transfer coefficient
Kw = intraparticular diffusion coefficient
Figure 3: Ho Pseudo second-order model kinetics
Table 2 shows some differences in kinetic parameters of attapulgite, bentonite and chitosan treatment. Two pseudo
order kinetics model has a very strong correlation (close to 1) with R2 values above 0.95 in the third adsorbent.
Therefore, the pseudo second-order kinetic model can explain the adsorption of free fatty acids in fish oil by a third adsorbent. Ho kinetics model based on the concentration of adsorbate on the adsorbent [6]. Table 2 shows that the adsorption of free fatty acids in fish oil using attapulgite had a pseudo second-order adsorption constant (k2) of 0.0344 g
mg-1min-1, adsorption by bentonite has k2 of 0.0222 g mg-1min-1, and adsorption by chitosan has k2 of 0.0460 g mg-1min-1.
Initial adsorption rate (h) of attapulgite, bentonite, and chitosan treatment were 0.1365 g mg-1min-1, 0.0622 g mg-1min-1,
and 0.1216 g mg-1min-1, respectively. Attapulgite treatment had the highest value of qe2 than bentonite and chitosan
treatment which was equal to 1.992 mg/g, whereas the bentonite treatment was 1.675 mg/g and chitosan treatment was
1.626 mg /g. The value qe2 was not different from the value qe.exp research . This suggests that the attapulgite has the
largest adsorption capacity.
Based on Table 2, attapulgite treatment had the highest of equilibrium adsorption capacity (qs) than bentonite and
chitosan treatment, with the value of the adsorption of the FFA using this adsorbent was 56.53 mg/g, whereas the qs
values for bentonite and chitosan treatment were 42.40 mg/g and 47.11 mg/g. Si and Mg oxide structures on the surface of attapulgite can increase the adsorption capacity [9]. Many factors affect the adsorption capacity are initial adsorbate concentration, temperature, pH value, particle size, dose, and the characteristic of the solute [11]. These factors may also affect the adsorption rate constant of the adsorption process. Differences in adsorption capacity can also occur by the different types of adsorbents used. Different types of adsorbents have different polarity, the active surface, surface area, porosity, particle size, pH, and different of water content [20].
According to Mittal et al. [15], the steps involved in the adsorption of organic or inorganic compounds included: the external film mass transfer phase, is when an adsorbate transports into the external surface of the adsorbent, the intraparticular difussion phase, is when an adsorbate transports within the pores of the adsorbent except for a small amount of adsorption, it occurs in external surface, and the adsorption of adsorbate in the interior surface of the adsorbent. Ho and McKay [12] observed during the adsorption process occurs, there are four distinct stages, that are transport of adsorbate from the liquid phase (solution) surrounding the adsorbent particle surface (the first stage can be ignored if the system is perfectly agitate); external diffusion (second stage), the diffusion of intra-particles (the third stage), and the physical or chemical surface reaction (fourth stage), but only the external films diffusion and intraparticel difussion which are considered can control the adsorption kinetic.
KsA values (the external film mass-transfer coefficient) depends on the concentration gradient between the adsorbate and the surface of the liquid phase adsorbent [16]. Table 2 shows the highest value of KsA is shown in attapulgite adsorbent treatment, and its value was 0.0018 mL/s, followed by chitosan treatment at 0.0015 mL/s, and bentonite treatment at 0.0013 mL/s. On a study of Sathivel and Prinyawiwatkul (2004), a value of KsA for chitosan treatment was 0.001 mL/s, activated carbon treatment was 0.001 mL/s, active earth treatment was 0,001 mL/s. According to Toro and Mendez [19], the external film mass-transfer coefficient is influenced by several factors, such as the magnitude of the driving force for the FFA, the adsorbent surface interaction with other lipids, as well as the interaction of FFA with other oil components in the liquid phase and on the surface of the adsorbent. Highest value of intraparticular diffusion
coefficient (Kw) at Table 2 indicated by attapulgite treatment. Kw value for attapulgite treatment was 0.1542 mg mL-1
min-0.5, chitosan treatment was 0.1285 mg mL-1min-0.5, and bentonite treatment was 0.1156 mg mL-1min-0.5. This suggests
3.4 Clarity of Fish Oil
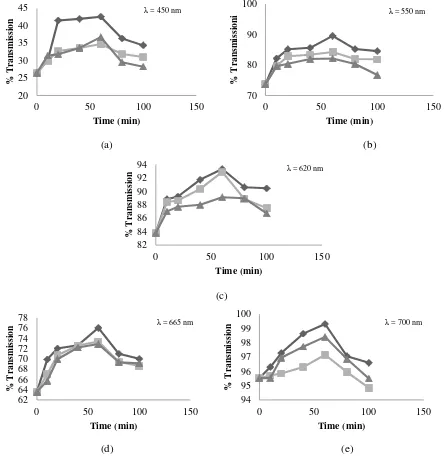
Measurement of fish oil clarity in the study conducted at a wavelength of 450, 550, 620, 665 and 700 nm. Results of fish oil clarity expressed by percent transmission can be seen in Figure 4. Based on figure 4, it can be inferred that the value of clarity (percent transmission) at all wave increased with the increasing of adsorption time to a maximum in the 60th minute. It had happened to all adsorbent (attapulgite, bentonite, and chitosan) treatment. Therefore, it was estimated that 60th minute of adsorption time was a equilibrium condition and it can limit the ability of the adsorbent to absorb impurities that affect the color or clarity of the fish oil.
(a) (b)
Figure 4 also shows that from three types of adsorbents, attapulgite is the most effective adsorbent which gave the highest light transmission on fish oil. Attapulgite has very good colloidal properties, that is easily dispersible, resistant to high temperature, resistant to salt and alkaline, has a high adsorption power, and able to remove the color. Attapulgite ability to perform bleaching mainly due to large surface area and low capacity of displacement cation [13].
4.
CONCLUSIONObtaining from fish meal industry, this sardine oil contained 26.37% of saturated fatty acids (SFA), 17% of monounsaturated fatty acids (MUFA), and 31.94% polyunsaturated fatty acids (PUFA). Polyunsaturated fatty acids were dominated by EPA and DHA, and its value was 15.83% and 11.36%, respectively.
The longer of adsorption time was in a row with the more free fatty acids were adsorbed. Equilibrium point in free fatty acids adsorption has been reached at 60 minutes. The best free fatty adsorption capacity can be shown in a treatment using attalpugite as adsorbent, and its adsorption capacity value was 56.53 mg / g.
Clarity value (percent transmission) of each treated fish oil will increase, with the increasing of adsorption time until the 60th minute. Sardine oil which was adsorbed by attapulgite showed better clarity than chitosan and bentonite.
5.
REFERENCES[1] Ahmadi K., Mushollaeni W., “Chemical Activation of Natural Zeolite for Fish Oil Refining which Obtained
from Fishmeal Processing Industry with Lemuru (Sardinella ongiceps) as Raw Material”, Indonesial
Agriculture Technology, vol. 8, no. 2, pp 71-79, 2007
[2] Alkio M., Gonzales C., Jantti M., Aaltonen O., “Purification of Polyunsaturated Fatty Acid Esters from Tuna
Oil with Supercritical Fluid Chromatography”, Journal of American Oil Chemist Society, vol. 77, no. 3, pp
315-321, 2000
[3] [AOAC] Association of Official Analytical Chemist, Official Methods of Analysis of The Association of
Official Analytical Chemist, AOAC Int, Washington, 1995
[4] [AOAC] Association of Official Analytical Chemist, Official Method of Analysis of the Association of Official
Analytical of Chemist, Association of Analytical Chemist, inc, Virginia, 2005
[5] [AOCS] American Oil Chemists' Society, Free Fatty Acids In: Official Methods and Recommended Practices of
the American Oil Chemists Society, Vol 5a. 5th ed, AOCS Press, Champaign, 1998
[6] Bulut E., Ozacar M., Sengil A.I., Adsorption of Malachite Green onto Bentonite : Equilibrium and Kinetics
Studies and Process Design, Microsporous and Mesoporous Materials, vol. 115, pp 234-256, 2008
[7] Edward F., the health benefits of omega 3, 6, 9 fatty acids and EPA & DHA,
http://globalhealingcenter.com/natural-health/, Accessed in Sep 8th 2013, 2013
[8] Estiasih T., Fish Oil : Technology and Its Application for Food and Healthy, Graha Ilmu,Yogyakarta, 2009
[9] Gerstl Z., Yaron B., “Stability of Parathion on Attapulgite as Affected by Structural and Hydration Changes”,
Clay and Clay Minerals, vol. 29, pp 53-59, 1981
[10]Hjaltason B., Epax A.S., Haraldsson G.G., “Fish oil and lipids from marine sources”, In: Modifying Lipids for
Use in Food, Frank D. Gunstone, ed, Woodhead Publishing Limited, Cambridge, 2006
[11]Ho Y.S., “Review of Second-Order Models for Adsorption Systems”, Journal of Hazard Material, vol. 136, pp
681–689, 2006
[12]Ho Y.S., McKay G., “Kinetic Models for The Sorption of Dye from Aqueous Solution by Wood”, Trans
Institution of Chemical Engineers, vol. 76, pp 183–191, 1998
[13]Huang J., Liu Y., Liu Y., Wang X., “Effects of Attapulgite Pore Size Distribution on Soybean Oil Bleaching”,
Journal of American Oil Chemist Society, vol. 84, pp 687-692, 2007
[14]Kadirvelu K., Faur-Brasquet C., Le Cloirec P., “Removal of Cu(II), Pb(II), and Ni(II) by Adsorption onto
Activated Carbon Cloths”, Langmuir, vol. 16, no. 8404–8409, 2000
[15]Mittal A., Kurup L., Mittal K., “Freundlich and Langmuir Adsorption Isotherms and Kinetics for the Removal
of Tartrazine from Aqueous Solutions using Hen Feathers”, Journal of Hazardous Materials, vol. 146, pp 243–
248, 2007
[16]Sathivel S., Prinyawiwatkul W., “Adsorption of FFA in Crude Catfish Oil onto Chitosan, Activated Carbon and
Activated Earth: a Kinetics Study”, Journal of American Oil Chemist Society, vol. 81, no. 4, pp 493-496, 2004
[17]Sathivel S., Yin H., Bechtel P.J., “Purification of marine fish oils using pilot scale adsorption column”, In
Proceeding of International Conference of AgriculturalEngineering, 2012
[18]Suseno S.H., Tajul A.Y., Wan Nadiah W.A., “Improving The Quality of Lemuru (Sardinella lemuru) Oil using
Magnesol XL Filter Aid”, International Food Research Journal, vol. 18, pp 255-264, 2011
[19]Toro V.J.F., Mendez M.G., “Competitive adsorption among sesame oil components in a concentratedmiscella
system”, Journal of American Oil Chemist Society, vol. 72, pp 675–679, 1995
[20]Zhu Z.Y., Yates R.A., Caldwell J.D., “The Determination of Active Filter Aid Adsorption Sites by