IMPROVED QUALITY OF SARDINES OIL (
Sardinella
sp.) USING
Centrifugation is a separation method of crude oil with a dizzying treatment so the heavier component will be thrown even further due to the centrifugal force. This study aimed to provide an alternative purification technology to improve the sardines (Sardinella sp.) oil quality by product of fish processing industry by using a centrifugation method. Highest fish oil yield of centrifugation from each time and speeds were, at 10.500 rpm for 15 minute (70%), at 10.500 rpm for 30 minute (60%) and at 10.500 rpm for 45 minute (56.2%5) respectively. The best treatment to got the best quality of fish oil which had low value in primary oxidation and secondary oxidation was centrifugation at 10.000 rpm for 30 minute. Peroxide value of centrifugation at 10.000 rpm for 30 minute about 5 meq/kg, p-anisidine value of centifugation at 10.000 rpm for 30 minutes about 0.325 meq/kg, total oxidation of centrifugation at 10.000rpm 30 minutes about 10.325 meq/kg, and free fatty acids value of centrifugation at10.000 rpm for 30 minute about 7.802 meq/kg. Percent light transmission increased at various wave lengths tested, in line with the treatment time and speed of centrifugation.
Keywords: Centrifugation, fish oil, quality, Sardines.
1. Introdution
Sardinella sp. is one type of economically fish in indonesia. Sardine including to one of high fatty fish with various fat content. A different fat content depending on the size of the fish, maturity, season, and food (Moeljanto 1988). The increased production volume of Sardines during the interval period 2000 until 2010 was recorded 7,06 %. During the interval period 2000 until 2010, the value of production of Sardines also increased with average 12,14 % (KKP 2010)
Along with the increased of fisheries procecing industry, waste problem was also increase. By-product of management process flour or canning fish was oil. According to Setiabudi (1990), every one tonnes of sardines that processed will produce oil 50 liter. According to Estiasih et al. (1996) liquid waste which is resulting from whole Indonesia of sardine processing was 1.176 tons per year. Yunizal (2002) record in 1996, the number of fish oil as a sardines processing by-product relatively high, 4.300 tons and yet optimized as a source of an omega-3 fatty acid.
Usually fish oil is traded for livestock feed, lubricants tanners, paint and ink industry at a bargain price even these oils sometimes discarded. According to Suseno et al. 2011, quality fish oils are still to feed (feed) yet for food. Previous research (Estiasih 1996, Estiasih 2003) showed that oil is a by-product of processing fish sardines from the region of Muncar Muncar contain omega-3 fatty acids in high levels and can be used as a source of omega-3 fatty acids. high content of omega-3 fatty acid from the oil waste can be harnessed into a product that has value added.
The purification is performed to remove dirt, taste and odor, unattractive colors and extend the save oil before it is consumed or used in food or feed industries (Ketaren, 1986). The aim of this research is to provide an alternative purification technology to improve the Sardine (Sardinella sp.) oil quality from side of fishery processing industry using the centrifugation method.
2.
Materials and Methods
2.1 Materialsp-2.2 Methods Sampel treatments
Sardine (Sardinella sp.) oil as a canning fisheries industry by-product from Pekalongan tested as peroxide value, anisidin value, free fatty acid level, total oxidation and clarity to determine fish oil quality in the beginning. The beginning tested result became control data. Fish oil then sentrifused with different times and speeds (15, 30, 45 minutes and 2500, 4500, 6500.8500, 10,500 rpm) at a temperature 10oC. The aim of this treatment was to separated soapstock from fish oil. Yield was determined by calculating the percent number of clean fish oil from crude fish oil. Fish oil yield then tested as peroxide value, anisidin value, free fatty acid level, total oxidation and clarity.
Chemical properties
Peroxide value (AOAC 2000, No. Metode 965.33b)
A known weight of oil sample (2 g) was dissolved in 30 mL chloroform: acetic acid (3:2, v/v) then 1 mL freshly prepared saturated KI (potassium iodide) solution was added and the mixture vortexed for exactly 1 min. Distilled water (30 mL) and stock solution (0.5 mL, starch 1%) were added and the liberated iodine was titrated with sodium thiosulfate (0.1 mol L-1) (AOAC 2000). Determination of the peroxide value in the unit meq/kg
First made a solution of test 1 by means of dissolving 0.5 g samples into 25 mL trimethylpentane. Later made a solution of test 2 with a way of adding 1 mL solution p-anisidine ( 2,5 g/l ) into a solution of 1,5 mL test then shaken and avoid of the light. Later made a solution of a reference to a way of adding 1 mL solution p-anisidine ( 2,5 g/l ) into 5 mL solution trimethylpentane, then shaken and avoid of the light. Then a solution of measured absorbansi, the value of a solution of test 1 on 350 nm by using trimethylpentane as a solution of compensation. A solution of test 2 on 350 nm just 10 minutes after solution prepared, by the use of a solution of reference as compensation (Watson 1994). The value of anisidine set with an equation the following:
Anisidine value =
A1 = absorbance test solution 1 A2 = absorbance test solution 2
m = the mass of the sample use for test solution 1
Free fatty acid (FFA) (AOAC 1995)
The experimental procedure described in AOCS method Ca 5a-40 was followed to determine the percent FFA in each sample. Briefly, oil was weighed into a flask followed by neutralized 95% ethyl alcohol and phenolphthalein indicator. The mixture was then titrated against sodium hydroxide solution until a permanent pink color persisted for at least 30 s. Percentage of FFA by weight was calculated on either an oleic, palmitic, orlauric acid basis, depending on the type of oil being analyzed (AOAC 1995). Each sample was titrated in
Total oxidation value obtained by summing the value 2PV with PAV, where PV (Peroxide Value) is the number of peroxide and p-AV (P-anisidine Value) is the p-anisidin (Perrin, 1996). Total oxidation is calculated based on the following equation:
Total oxidation = 2PV + p-AV
Physico properties of the fish oils
Clarity test (AOAC 1995 with modification, no. Method 955.23 )
quantifiable% transmission. The measurement is performed with the dilution of oil by as much as 10 times that is mixing 1 part of oil (1 mL) with 9 parts diluent (1 mL). N-hexane is used as a solvent. The wavelengths used in testing the clarity of the fish oil, among other things: 450, 550, 620, 665, and 700 nm.
3. Result and Discussion
3.1 Separation of soapstocks with using sentrifugation
Crude fish oil given treatment centrifugation at various speed and time to separate the soap stock contained in fish oil. Separation of centrifugation can be done to speed up the separation of soap stock that was form during neutralization of fish oil. Efficient separation of the stock from the neutralization was usually
accomplished with centrifugal separator (O’Briend, 1998). The yield of neutral oil after separation from soap
stock was shown in figure 1.
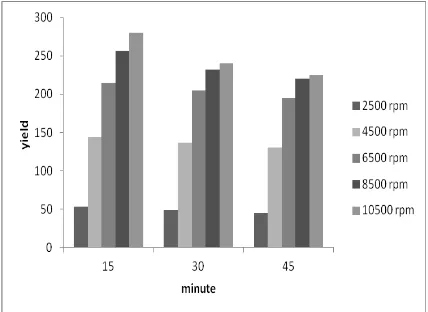
Figure 1. The yield of neutral oil after separation from soap stock.
The best percentage (%) yield of unrefined fish oil from each times and speeds were, at 10.500 for 15 minute rpm (70%), 10.500 rpm (60%) for 30 minute and 10.500 rpm for 45 minute (56.25%) respectively. Beside that, worst percentage (%) yield of unrefined fish oil from each times and speeds were, at 2.500 rpm (13.25%) for 15 minute, 2.500 rpm for 30 minute (12.25%) and 2.500 rpm for 45 minute (11.25%) respectively. At speed treatment, the yield (%) of fish oil filtrate was depend on duration time. Based on the results of the research known that the longer centrifugation then yield value was getting smaller. However, the higher-speed centrifugation, the higher yield value. Similar to the results of research Suseno et al. (2011) which shown that the higher the speed of centrifugation, the value yield of fish oil produced would be higher. The value of the resulting yield was very affected by homogenity of samples to be separated.
3.2 Peroxide value
Number of peroxides was defined as the amount of peroxide in miliekuivalen active oxygen contained in 1.000 g of the sample. High peroxide number indicates the fat or oil has been subjected to oxidation, but at a lower rate does not necessarily indicate oxidation conditions that are still early. A low peroxide number could have caused the rate of formation of peroxide recently, smaller than the rate it withstands degradation into other compounds, considering the levels of peroxide degraded rapidly and react with other substances (Raharjo, 2006). Maximum number of peroxide in fish oil is ≤ 5 meq/kg (International Fish Oil Standards in 2011). The following data is the value of peroxides fish oils after treatment centrifugation can be seen in Figure 2.
Figure 2. Peroxide value of fish oil centrifugation after treatment.
meq/kg and percentage decrease about 16.667% from peroxide number of controls. Fish oil was always experiend contact with the air and light that oxidize. The resulting hydroperoxide on oxidation process of oil can cause the splitting of fatty acid compounds with C chains became shorter, like saturated fatty acids-acids, pillars and ketones. Fatty oxidation by oxygen occur spontaneously if the fatty material is left in contact with the air, while the speed of the process depends on the type of fat varying in oxidation state and storage conditions (Ketaren, 1986). The presence of light and metal play a role in the process of making hydrogen. Radical-these free radicals then react with oxygen to form a hydroperoxide compound active eventually affects the physical properties and chemistry of fish oil as the onset of the smell was not frowned upon and murky brown color. (deMan, 1999; Ericson, 2002).
3.3 Anisidin value
P-anisidin was an estimate of the decomposition compounds hydroperoxide-induced by advanced oxidation. Oil that has undergone advanced oxidation can have a low peroxide number because most of the hydroperoxide has oxidized into products or compounds results in a smaller resolution, so that the results of its analysis was more accurate to describe the level of damage to fish oil (Irianto and Giyatmi 2009). ). Maximum number of anisidin in fish oil is ≤ 15 meq/kg (International Fish Oil Standards in 2011). Results of the analysis of the p-anisidin fish fed on oil refining treatment combination can be seen in Figure 3.
Figure 3. P-anisidin value of fish oil after centrifugation treatment.
The value of disentrifuse before anisidin 0.581 meq/kg. results of the study showed that treatment with the combination of centrifugation time and speed can decrease the number of anisidin with quite effective. The value of the lowest anisidin on treatment, 10.500 rpm for 30 minutes about 0,325 meq/kg and percentage decrease of 44.086%. The value of the highest anisidin was at 2.500 rpm for 30 minute treatment about 0,438 meq/kg and percentage decrease of 24.731%. Based on the results of the measurement of the number of previously acquired data that the peroxide value was the lowest in peroxide treatment 30 minutes by centrifugation speed 10.000 rpm, similar thing also happens on measuring value anisidin. Retrieved data was that the value of the lowest p- anisidin on centrifugation treatment 30 minutes with a speed of 10,000 rpm. Guillén and Cabo (2002) stated that the p-anisidin was not always in line with the high number of peroxide, but the high number of peroxide may cause high p-anisidin if process given fish oil allows the occurrence of further degradation.
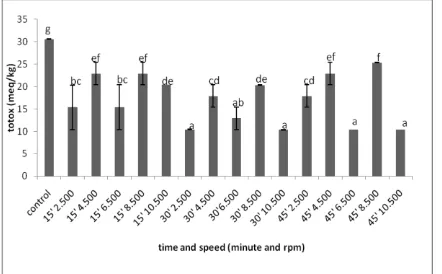
3.4 Total oxidation (totox) value
The total value of oxidation can be used to measure the progresivitas of deteriorasi process that occurs in oil and provides information on the formation of primary as well as secondary oxidation products (Hamilton and Rossell, 1986). The maximum limit value for total oxidation in fish oil is ≤ 20 meq/kg (International Fish Oil Standards in 201. The following data was the value of the total oxidation of fish oil centrifugation after treatment can be seen in Figure 4.
Figure 4. The total value of the oxidation of fish oil centrifugation after treatment.
rpm for 30 minute, 6.500 rpm for 45 minute, 10.500 rpm for 45 minutes in a row was 10.438 meq/kg, 10.325 meq/kg, 10.364 meq/kg, 10.379 meq/kg and percentage decrease 65.870%, 66.237%, 66.111% and 66.036% of the total value of the oxidation number of the control. The total value of the highest oxidation on the treatment 8500 rpm for 45 minute about 25.359 meq/kg and percentage decrease of 17.077% of the total value of the oxidation of the control. The total value of the oxidation was the summation of results between the two times the number of peroxide with the p-anisidin (Perrin, 1996). An increase in the value of perkosida and totox values lead to increased anisidin, and vice versa. Based on the data obtained, the sample has a high anisdin and peroxide value will have the value anisidin is high as well.
3.5 FFA value
The formation of free fatty acids occurs due to hydrolysis and oxidation of oil caused by the presence of free radicals and parsing double bonds during heating (Paul and Mittal, 1997). An indication of the degree of hydrolysis occurs in oil can be determined with a free fatty acid content (Berger 1997). A maximum of bebaas fatty acids in fish oil is ≤ 1.13 meq/kg (International Fish Oil Standards in 2011). Data of free fatty acids of fish oils after treatment centrifugation can be seen in Figure 5.
Figure 5. The value of free fatty acids fish oil after centrifugation treatment.
Free fatty acid value before disentrifuse of 11.671%. Results of the study showed that treatment with the combination of centrifugation time and speed can decrease the value of free fatty acids with quite effective. The lowest value of free fatty acids in the treatment at 10.500 rpm for 30 minutes about 7.802 meq/kg with the percentage decrease of 33.154% of the value of free fatty acids control. The highest value of free fatty acids in the treatment at 10.500 rpm for 45 minutes about 9.87 meq/kg and the percentage decrease of 15.436% of fatty acid value of the control. Suseno et al. (2011) declaring that the soap stock, hydrated, gum, pospatid and metal prooksidan as a fraction of fish oil on weight will be separated through a process of centrifugation. It implies the presence of decreased levels of free fatty acids on purified fish oil. Purification treatment can also cause minor constituents in the form of tocopherol or any other type of natural antioxidants contained in oil can be reduced, so that it can influence the decrease in oxidative stability and increased levels of free fatty acids. The tocopherols act as natural antioxidants that serves to protect the quality of oil from rancidity (Roy 1978).
3.6 Clarity
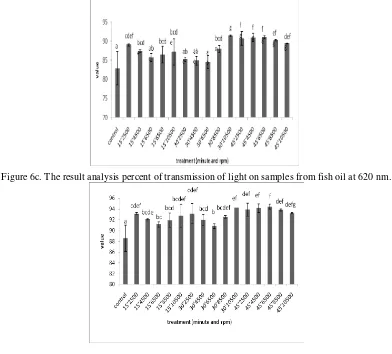
Measurement of oil carried on the clarity of the five wavelengths were 450 nm, 700 nm, 620 nm, 665 nm, and 700 nm. Level of clarity value indicated by the percent of oil transmission unreadable on a spectrophotometer. The value of percent transmission high and close to 100%, indicating that the observed fish oil has a good level of clarity. Results of the analysis of the light transmission of samples per cent fish oil can be seen in Figure 6.
Figure 6b. The result analysis percent of transmission of light on samples from fish oil at 550 nm.
Figure 6c. The result analysis percent of transmission of light on samples from fish oil at 620 nm.
Figure 6d. The result analysis percent of transmission of light on samples from fish oil at 665 nm.
separate treatment of the soap stock as substances that contribute to turbidity of fish oil. Transmission value decrease occurs in treatment 30 minutes centrifugation speed 10.500 rpm. Trend of decline in transmission is inversely proportional to the increased tendency of the number of peroxides, p-anisidin, and the total value of the sample by oxidation treatment 30 minutes centrifugation 10.500 rpm. Primary and secondary oxidation products are likely to affect the colour and turbidity from fish oil, the higher the content of primary and secondary oxidation products in fish oil, then the appearance of the observed fish oil would getting darker, so that its clarity levels decreased (Estiasih 2009).
Conclusion
Highest fish oil yield of centrifugation from each time and speeds were, at 10.500 rpm for 15 minute (70%), at 10.500 rpm for 30 minute (60%) and at 10.500 rpm for 45 minute (56.2%5) respectively. The best treatment to got the best quality of fish oil which had low value in primary oxidation and secondary oxidation was centrifugation at 10.000 rpm for 30 minute. Peroxide value of centrifugation at 10.000 rpm for 30 minute about 5 meq/kg, p-anisidine value of centifugation at 10.000 rpm for 30 minutes about 0.325 meq/kg, total oxidation of centrifugation at 10.000rpm 30 minutes about 10.325 meq/kg, and free fatty acids value of centrifugation at 10.000 rpm for 30 minute about 7.802 meq/kg. Percent light transmission increased at various wave lengths tested, in line with the treatment time and speed of centrifugation.
Reference
[AOAC] Association of Official Analytical Chemist. 1995. Official Method of Analysis of The Association of Official Analytical of Chemist. Arlington, Virginia, USA: Published by The Association of Analytical Chemist, Inc.
[AOAC] Association of Official Analytical Chemist. 1999. Official Method of Analysis of The Association of Official Analytical of Chemist. Arlington, Virginia, USA: Published by The Association of Analytical Chemist, Inc.
[AOAC] Association of Analytical Chemists. 2000. Official Methods of Analysis of the Association of Agricultural Chemists, 17th edition. Washington (US): AOAC Int
Berger KG. 1997. Industrial frying. International News on Fats, Oils and Related Materials. 8: 812-814. deMan MJ. 1999. Principles of Food Chemistry. Third Edition. Aspen Publicher, Inc. Gaithersburg, Maryland.
Estiasih T. 2003. The role of sodium kaseinat and fosfolipida in emulsifikasi and mikroenkapsulasi triglycerides rich fatty
acid ω-3. Dissertations. Graduate Program. Gadjah mada university. Yogyakarta.
Estiasih T. 1996. Microencapsulati on Concentrates in fatty acids ω-3 from waste Liquid of canning Fish Sardines (Sardinella longiceps). Thesis. The Graduate Program. Gadjah Mada University Yogyakarta.
Estiasih T. 2009. Fish oils: technology and its application to food and health. Yogyakarta ( id ): graha science Hamilton RS, Rossell JB. 1986. Analysis of oils and fats. Elsevier Applied Science. London Pp. 23–32.
[IFOS] International Fish Oils Standard. 2011. Fish Oil Purity Standards. http://www.omegavia.com/best-fish-oil-supplement-3/ [27 Juni 2013].
Irianto HE, Giyatmi S. 2009. Technology Processing Fisheries Product. Jakarta ( ID ): publisher open university.
Ketaren S. 1986. Introductory technology oils and fats food. Bogor: central among universities food and nutrition, bogor agriculture institute.
[KKP] Marine Ministry and Fisheries. 2010. Statistics marine and fishery 2008. Jakarta ministry: maritime and fisheries. Jakarta
Moeljanto. 1988. Correlative free fatty acid content of Lemuru with various factors at J.M. Krochta, E. A. Baldwin and M.O.Nisperos-Carriedo. Edible Coatings and Film to Improve Food Quality. Tecnomic Sifat Biologinya. www.digilib.ac.id. [2 September 2011].
Paul S, Mittal GS. 1997. Regulating the use of degraded oil/fat in deep-fat /oil food frying. Critical Rev in Food Science and Nutrient. 37(7): 635-662. doi: 10.1080/10408399709527793
Perrin JL. 1996. Determination of alteration. In: Karleskind A, Wolff JP. (Eds.) Oils and Fats, Manual vol. 2. Lavoisier Publishing, Paris (France).
Raharjo S. 2008. Protecting the oxidation Damage on oil For Frying with antioxidants. Foodreview Indonesia. 3(4). Roy AC. 1978. Refining and degumming systems for edible fats. Journal of American Oil Chemists Society. 55.
Setiabudi E. 1990. Influence storage time on the amount and type of filter wastes in canning results omega-3 oils and penepungan fish sardines ( Sardinella longiceps ). Thesis. Bogor: graduate programs, bogor agriculture institute.
Suseno SH, Tajul AY, Wan NWA. 2011. The use of passive filtration for optimization of magnesol xl function for improving the quality of Sardinella sp. oil. International Research Journal of Biochemistry and Bioinformatics. 1(5): 103-113.
Watson CA. 1994. Official and standardized methods of analysis (Third Ed.). Cambridge UK: The Royal Society of Chemistry.