3D SURVEYING & MODELING
OF UNDERGROUND PASSAGES IN WWI FORTIFICATIONS
P. Rodríguez-Gonzálvez a, E. Nocerino b, F. Menna b, S. Minto b, F. Remondino b a
Department of Cartographic and Land Engineering, High School of Ávila, University of Salamanca, Ávila, Spain Email: [email protected]
b
3D Optical Metrology (3DOM) unit, Bruno Kessler Foundation (FBK), Trento, Italy Email: (nocerino, fmenna, minto, remondino)@fbk.eu
Commission V, WG V/4
KEY WORDS: Digitization, Reconstruction, Modelling, Photogrammetry, Laser scanning, Cultural Heritage, Visualization
ABSTRACT:
The virtual reconstruction of subterranean structures is a suitable scenario for the integration of different geomatics techniques although narrow passages, lack of light and irregular surface can arise various problems in the data acquisition as well as processing procedures. Generally the final product is a dense and detailed 3D model, whose number of triangles increases quickly according to the complexity of the object. This complexity reduces the efficient use and dissemination of the produced information therefore innovative solutions are sought. The article presents the 3D surveying and modelling of underground passages of World War I (WWI) fortifications. After the acquisition of dense point clouds by means of terrestrial scanning (TLS), a simplification and optimization workflow is performed with the aim of generating a lightweight product that keeps the maximum amount of significant information. A continuous scene representation with a 87% triangle reduction is generated, while the final precision is preserved according to a tolerance predefined by the final user. Such 3D product can be employed as basis for reconstruction, consolidation, preservation and valorisation of the WWI tunnels.
Figure 1. a) The entire complex of WWI fortifications in Lusern (Trento, Italy) with the surveyed tunnel, ca 100 m long with a section of 2 x 2 m (after [http://de.wikipedia.org/wiki/Werk_Lusern]). b) Werk Lusern from the air (source: www.trentinograndeguerra.it). c) The entrance of a tunnel.
1. INTRODUCTION
The paper presents the on-going interdisciplinary project VAST (VAlorizzazione Storia e Territorio – Valorization of History and Landscape, http://vast.fbk.eu/; Nocerino et al., 2014) which aim to develop a multi-technique approach for the 3D modelling of Austro – Hungarian World War I (WWI) fortifications located in the Trentino region (nowadays part of Italy). The work is part of cultural heritage valorisation activities related to the celebrations for the centenary of the WWI, promoted by local authorities to valorise military buildings and areas that were the scene of important and crude battles. Before the end of WWI, the Trentino – Alto Adige region was part of the Austro–Hungarian Empire and constituted a fundamental strategic area, one of the most dangerous frontiers of the Empire. To protect and reinforce the territory, more than 50 fortifications (werk in German) were built, many of them constructed on plateaus and mountain tops for monitoring and protecting the border against the Italian army. The fortifications, built in concrete and hand-carved local stone, were made up of a main body, secondary casemates and several underground passages. Nowadays, the great majority of these buildings are ruined and the main idea behind the VAST project is to virtually reconstruct them to valorise these heritage
monuments, allow virtual sightseeing and produce communication material.
The multi-technique methodology so far developed for the 3D reconstruction of WWI fortifications (Nocerino et al., 2014) is based on reality-based techniques (photogrammetry, laser scanning, topographic surveying) integrated with Computer Aided Architectural Design (CAAD) methods. While the previous work was focused on the 3D modelling of the main building of the fortifications, in this contribution the virtual reconstruction of subterranean passages is presented.
2. RELATED WORKS AND WORK AIMS
Such tunnels were excavated to connect adjacent fortifications or as evacuation passages. Most of them are now blocked due to collapses and need to be restored to ensure their proper preservation and allow accesses to visitors. Therefore a proper and detailed 3D survey is mandatory. In underground environments, several geomatics techniques have been applied and described in literature: –3D active sensors such as terrestrial laser scanning – TLS (Beraldin et al., 2011; Roncat et al., 2011; González-Aguilera et al., 2011; Remondino et al., 2011, photogrammetry (Roncella et al., 2012; Arles et al., 2013), mapping mobile systems (Ziparo et al., 2013; Zlot and Bosse, 2014) or 3D SLAM (Ferreira et al., 2012).
Each of these methods has its own advantages and disadvantages. TLS is normally the most suited technology for tunnel documentation, but when the space is limited and the shape very elongated and linear (such as in the case of underground passages of fortifications) the number of TLS stations increases exponentially, the network configuration becomes weak for standard alignment procedure with an ICP algorithm and the precision of 3D points is reduced due to the slant incidence angles (Soudarissanane et al., 2009). On the other hand, photogrammetry can directly provide both geometric and high resolution RGB information, although underground tunnels are unfavourable environments for passive sensors with limited field of view and poor or completely absent illumination.
This paper deals with the 3D surveying and modelling of underground passages (tunnels) of WWI fortifications located in the Trentino plateaus and highlands of Luserna, Lavarone and Folgaria, in Italy (Fig. 1). For some of these tunnels (Fig. 2), original maps are stored in national archives. Such drawings are usually mainly sketches that contain minimal information about the predesigned shape, generally different from the one actually built (time restrictions for building adaptation to the geology, etc.). Since the actual shape differs significantly from the original design plans, TLS and photogrammetric surveys have been carried out to record both the real geometry and colour information. This approach provides a high dense and resolute 3D model, with a huge number of points and/or triangles, not directly suitable for dissemination and virtual interaction due to limits of currently available hardware and software. To this end, a final lightweight product is required and a simplification process should be carried out. In this work, in order to obtain an optimal mesh model with the minimum loss of significant information different approaches are tested. These approaches are designed and implemented to comply with the project requirements (i.e. tolerance and level of detail to be represented) taking into consideration the characteristics of different kinds of tunnels.
As result, the final simplified 3D model could be easily integrated in a visualization tool (Jiménez Fernández-Palacios et al., 2013) for cultural dissemination. Furthermore, as the produced 3D model is precisely geo-referenced (by GNSS) with the rest of the fortifications structures, it could also be used for further analyses and interpretations by experts (historians, conservators, etc.).
3. AREA OF STUDY
The analysed tunnel (Fig. 2) belongs to the werk Lusern (Fig. 1), connects two outposts of the military fortification named Viaz and Oberwiesen. It is more than 100 m long with a section of about 2 x 2 m. Some lateral rooms, not reported in the original military drawings, are also present and were probably used to store material or as resting place. The tunnel walls and ceiling surfaces are very rough, due to the construction techniques moreover in some areas the ceiling has collapsed. The irregular surfaces and narrow passages, often adapted to the rock stratum, complicated the data acquisition, due to obstacles not considered in the planning of the survey.
4. DATA COLLECTION AND PROCESSING
4.1 Equipment
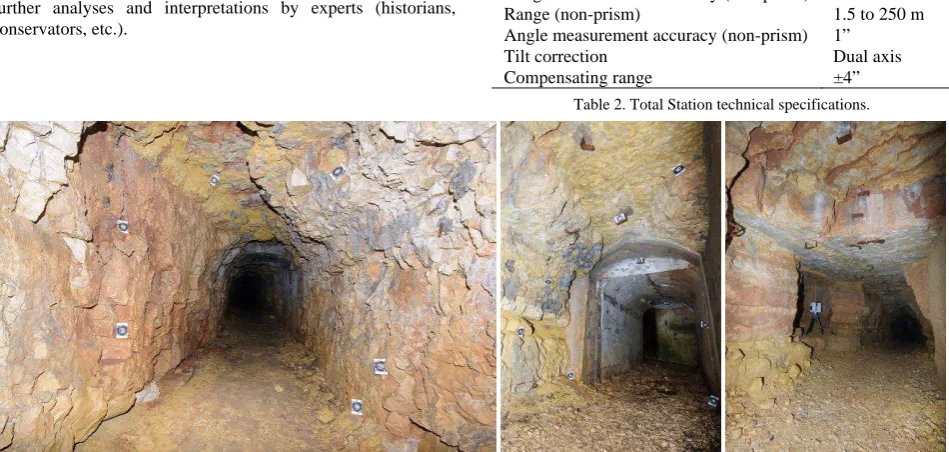
The surveying of the tunnel was performed with a terrestrial laser scanner - TLS (Table 1, Fig. 2 right), a total station - TS (Table 2) as well as a digital camera (Table 3).
The total station was used for the accuracy assessment of the final 3D model and for geo-referencing reasons. Along the tunnel, several high contrast targets were placed every 25 m on the walls and ceiling to serve as GCPs (Fig. 2 left and middle). The targets were designed for laser and surveying, with binary code and a circle diameter of 35 mm. These targets were surveyed with a topographic network while two exterior bases were observed to link the interior survey with a global coordinate system.
Leica HDS7000
Type Phase shift
Wavelength 1500 nm
Angular precision (H & V) 125 rad Beam divergence < 0.3 mrad
Range noise (black 14%) 0.5 mm rms @ 10 m
Spot size 6.8 mm @ 10 m
Table 1. Terrestrial Laser Scanner technical specifications. Topcon GPT7001 Range measurement accuracy (non-prism) ±5 mm
Range (non-prism) 1.5 to 250 m
Angle measurement accuracy (non-prism) 1”
Tilt correction Dual axis
Compensating range ±4”
Table 2. Total Station technical specifications.
Figure 2. The tunnel - connecting the Viaz and Oberwiesen outposts of the Lusern fortification - with the topographic targets (left and middle) and a TLS station (right).
Figure 3. TLS 3D data after the alignment of all the scans.
The TLS survey involved a total number of 19 stations and ca 285 million points (average spatial resolution of ca 4 mm). The TLS stations were distributed uniformly in the central passage and in the discovered lateral rooms, with a mean distance between stations of ca 8 m. This distance was chosen according to the average tunnel section, which affected the point density distribution, the point precision (due to the high incidence angle) and occlusions caused by the rough surface.
The photogrammetric survey was performed mainly for texturing purposes (Table 3). The images were acquired using an external flash attached to the camera due to the absence of illumination inside the tunnel. About 400 photos were acquired with a mean ground sample distance (GSD) of 2 mm.
Nikon d3x
Sensor type FX CMOS
Sensor size 35.9 × 24.0 mm
Resolution (effective pixels) 24.5 Mpx
Image size 6048 × 4032 px
Pixel density 2.8 MP/cm2
Pixel size 5.95 m
Employed focal length 14 mm
Table 3. Digital camera technical specifications. 4.2 Data processing
The complete range-based 3D point cloud of the tunnel was obtained employing a combination of classical range data processing procedures. Firstly, five scans (“key stations”) with an optimal view of the GCPs were aligned to the local coordinate system with a solid-rigid transformation (6 parameters). Secondly, the adjacent TLS stations were aligned to the key stations through a standard ICP algorithm (Bels and McKay, 1992). Finally, all stations, with the exception of the central one, were freed to refine the alignment using an implementation of the ICP algorithm. The final ICP error was
3.6 mm, employing ca 420,000 points in every pair of adjacent stations.
The accuracy assessment of the registered TLS data inside the entire tunnel (Fig. 3) was performed using the available GCPs distributed on the wall and ceiling of the tunnel.
A spatial similarity transformation was used as mathematical model.
A total of 54 GCPs were employed and a blunder rejection test was applied (Pope, 1976) according to the standardized residuals (w):
where vi is the i-th residual of the transformation, P is the
weight matrix, Qvv the cofactor matrix of residuals and o is the a-posteriori standard deviation. Since the residuals are computed using the a posteriori variance, they will not be normally distributed and will rather follow a Tau distribution. The critical value of the Tau distribution may be computed from the tables of the t-student distribution (Heck, 1981) according to: significance level for a single observation. The value of 0 is computed from the total significance level () and the number of observations (n):
1According to Eq. 1, none of the GCPs employed were found to be blunders at 5% of confidence level, since the maximum standardized residual was 2.89 (the threshold established by Eq. 2 was 3.19). Since the Pope test could keep more observations that would normally be discarded as outliers by the normal distribution, the Baarda test (Baarda, 1968) was also computed to assure the data quality and given the high number of control points. This test is computed in a similar way as Eq. 1, but employing the a-priori standard deviation. As result a maximal normalized residual value of 2.76 was obtained, while the critical value of Baarda test for the same confidence level as Pope - and a power of the test () of 20% - established the
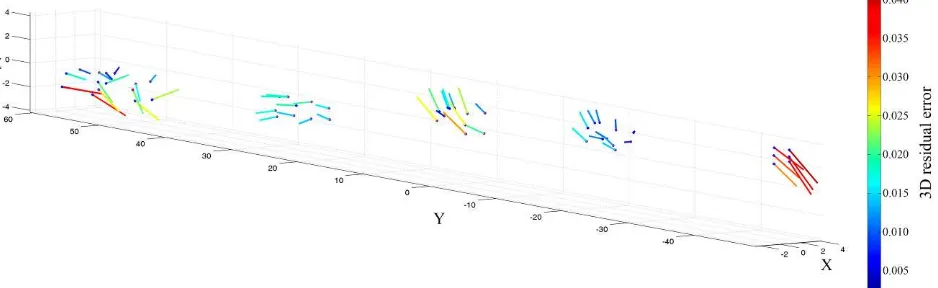
Figure 4. 3D residual error of the targets used to co-register all the TLS scans with a 6 parameters transformation. The standard deviations resulted: stdX = 1.55 cm, stdY = 0.6 cm, stdZ = 1.37 cm, respectively.
threshold at 2.8, thus confirming the absence of blunders. The final accuracy assessment of the survey is showed in Figure 4, along with the spatial distribution of the errors (note that the Y axis is aligned with the tunnel main axis). The standard deviation along the tunnel axis is 2.2-2.6 times smaller with respect to the other two directions. This can be explained by the fact that the targets were located in the lateral walls but facing always the Y-axis for a proper surveying and to avoid the precision degradation due to incident angle (Fig. 2). The uncertainty related to centre marking, which implies an error in the target plane, is related to the target definition, the target’s colour and the tunnel environment (mainly the humidity). The obtained a-posteriori standard deviation from the solid-rigid transformation was 12.5 mm. This value complies with the a-priori expected precision as the precision from the adjustment of the total station survey was in average 1.3 mm. On the other hand, the a-priori error of 3.0 mm (at 10 metres) was estimated for the TLS (Table 1) according to the error propagation of Reshetyuk (2009):
2 2 2 2 2
beam beam
(4)
where , and are the standard deviation of the range, horizontal angle and vertical angle measurement, respectively. The term beam is computed on the basis of the beam divergence (), according to (Lichti and Gordon, 2004):
beam 4
(5)
The final error propagation taken into account both error sources (total station and TLS) and the total number of stations (19) reaches up to 13.1 mm, for the worst scenario of only two consecutive overlapping clouds. This result is statistical compatible with the obtained a-posteriori standard deviation.
Before the successive steps, the TLS point cloud (285 million of points) was reduced to fulfil the VAST project requirements, producing a 1 cm spatial resolution ‘integrated 3D point cloud’.
5. POST-PROCESSING
Most common surface reconstruction algorithms implemented in reverse modelling commercial packages try to wrap a surface over a set of points while keeping their original coordinates (Ramos and Sadri, 2007). These algorithms aim at the most faithful representation of the produced geometric model on the basis of the available data. In case of irregular point sampling steps, the final geometric model may present surface holes, worsening the final look of the model. Therefore, further time-consuming post-processing operations, using for example hole filling algorithms, will be mandatory to achieve a proper visual appearance of the final 3D model.
After the creation of a complete and topologically correct 3D model, a decimation process is normally needed to adapt it to the user requirements that are mostly based on spatial resolution and/or number of triangles. However, these parameters do not take into account the visual perceived representation of the information, being merely based on sampling theory.
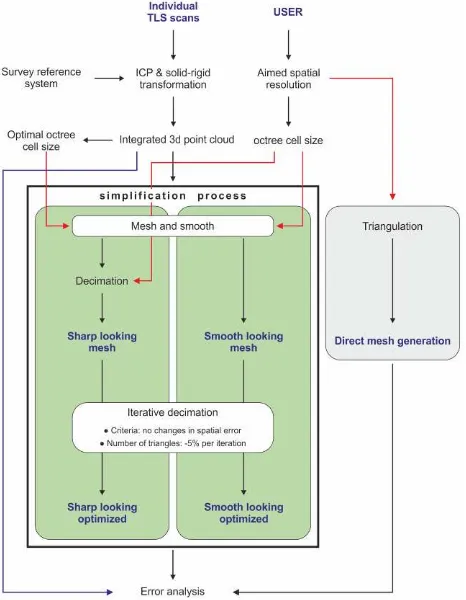
In order to achieve a more convenient visualization of large and complex 3D models - such as the WWI tunnels - while still keeping low the total number of triangles, an optimization process was designed. The simplification process has been carried out with free software, namely CloudCompare (2015)
and MeshLab (Cignoni et al., 2008), developing a systematic procedure that can allow the traceability of the whole process and avoiding the human subjective interpretation in the modelling process (Fig. 5).
The principle that drives the simplification procedure is that an end user should be able to define the total number of triangles or the required spatial resolution. Ideally, considering equilateral triangular meshes, the target number of triangle (N) could be derived applying simple geometrical considerations:
2
4 A N=
3 L
(6)
where A is total lateral area of the meshed object, L is the face edge length (equal to the user-defined spatial resolution) and N the number of triangles.
In the following subsections the different simplification approaches and results on the Lusern tunnel are described.
Figure 5. The proposed simplification pipeline (bolded area) for the post-processing of the surveyed data.
5.1 Smooth-looking
The first simplification approach here proposed consists in a straightforward mesh generation procedure where the Poisson algorithm (Kazhdan et al., 2006) implemented in CloudCompare (CloudCompare, 2015) is applied to the input point cloud. The mesh resolution is determined by the octree level, chosen according to the user defined spatial resolution. That means that the target spatial resolution, or number of triangles, is achieved directly in one single step. Unlike a direct mesh generation process, which usually requires mesh editing operations such as filtering and refinement (Attene, 2010; Varnuška et al., 2005), the Poisson algorithm directly encloses smoothing step and provides a continuous geometry. These characteristics are very important when further simplification
procedures, such as reverse modelling (Herrero-Huerta et al., 2015), are required.
5.2 Sharp-looking
For a sharp-looking mesh, the proposed method involves a two-step procedure: (i) a high spatial resolution mesh generated with Poisson algorithm from the input point cloud and (ii) a successive geometric optimization in Meshlab.
Unlike the one-step method presented in section 5.1, in this case the first action produces a polygonal mesh (named “intermediate mesh”) with a spatial resolution as high as the resolution of the original point cloud. In other words, the octree level is chosen to fit the input point cloud sampling step. In order to reduce the number of polygons of the intermediate mesh to accomplish the user-defined final spatial resolution, the quadratic edge collapse algorithm (Garland and Heckbert, 1997) implemented in Meshlab is applied. In this way the final result preserves a high level of perceived detail while the number of triangles is reduced for visualization purposes.
5.3 Further mesh optimization
Both methods described in the previous sections take into account only the spatial resolution as procedural criteria. An improvement is here proposed consisting in further reducing the final number of triangles through the “collapse” of areas without relevant information. The idea behind this additional step is that the final number of triangles can be further reduced beyond the number of triangles originally defined by the user, without losing significant level of detail according to a predefined tolerance. For this purpose, an iterative process is proposed where the mesh derived from the previous procedures (both sharp and smooth-looking) is “collapsed” of 5% of total number of triangles using the quadratic edge collapse algorithm. If the resulted mesh error against the original input point cloud remains unchanged (with respect to the previous iteration), the collapse process continues. An iterative procedure is required since the quadratic edge collapse algorithm implementation does not allow decimation at fixed spatial resolution.
Between the two methods in sections 5.1 and 5.2, the smooth looking approach is more susceptible to achieve high level of reduction, since there is a high percentage of areas lacking relevant information.
5.4 Results of mesh optimization for the Lusern fortification’s tunnel
For the studied area, different geometric resolution of the final 3D tunnel were investigated keeping in mind the future reconstruction, consolidation, preservation and valorisation purposes. Starting from the integrated 3D point cloud (1 cm spatial resolution), the resolution of the final 3D geometric model was set to 10 cm for two reasons:
1. Such resolution is a good compromise for an easy manipulation and fruition of the 3D tunnel.
2. The 3D model will be integrated with the other 3D products of the VAST project. Most of these outcomes (Nocerino et al., 2014) are CAAD-based models, produced from original drawings at various scale (1:50 up to 1:800). Considering a common drawing error of 0.25 mm, an average resolution - and accuracy - of 5 cm should be chosen. But additional error sources (paper deteriorations, digitization error, draw idealizations, etc.) must be considered thus leading to a deterioration of the results.
This reference value implies, that for an ideal meshing of equilateral triangles, a total number N of 247,350 faces should be obtained (Eq. 6), where the lateral initial area A is computed from a coarse approximate mesh based on alpha-shape computation (Edelsbrunner and Mücke, 1994).
The three different scenarios described in 5.1, 5.2 and 5.3 were tested. Firstly, for a smooth looking mesh case, the original point cloud was directly meshed and smoothed by the Poisson algorithm, for the 10 cm average spatial resolution objective (172,876 triangles).
Secondly, for a sharp looking mesh case, the intermediate mesh resulted in 12 million triangles, which was simplified, in the second step, by quadratic edge collapse algorithm for the 10 cm average final spatial resolution goal. A final number of 168,936 triangles (43 times reduction, where the exponent is related to the octree level) was obtained.
Thirdly, the sharp optimized method was tested. In this case, the number of triangles of both the meshes is optimized, collapsing the areas without relevant information. As final result, the number of triangles is reduced of a 14% (which corresponds to 144,842 triangles) and 34% (114,690 triangles) for the sharp and the smooth respectively. Against the direct mesh generation, the reduction percentage reaches up to 10% (15,598 triangles less) and 29% (45,750 triangles less).
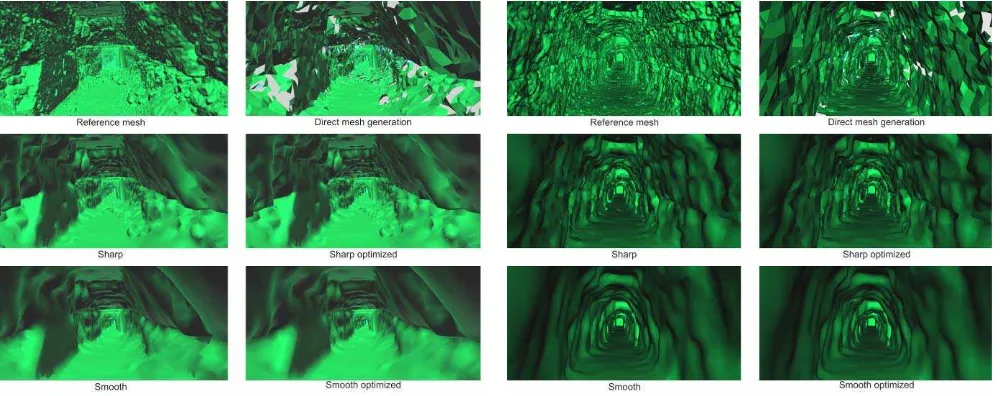
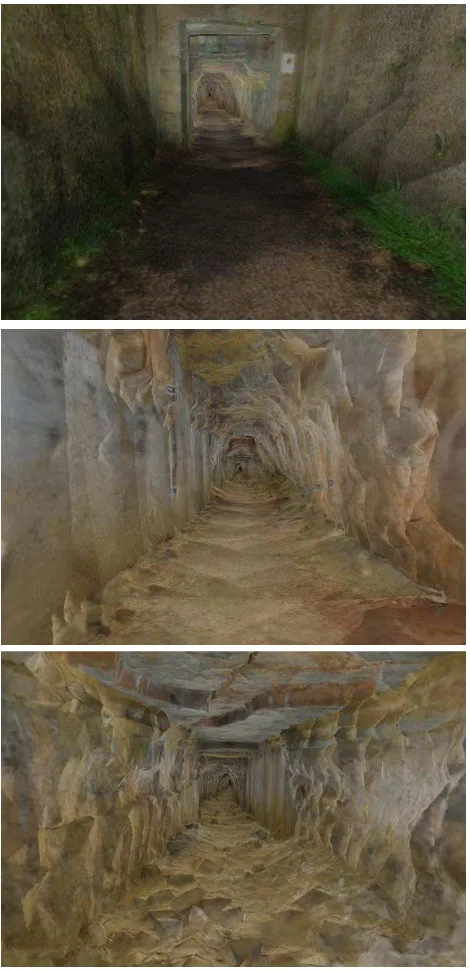
Figure 6. Example of the simplification approach in a high-detail area of the underground passage (10 cm mesh).
Figure 7. Example of the simplification approach in a mid-detail area of the underground passage (10 cm mesh).
Finally, the result of a direct mesh generation without smoothing for the objective resolution is compared. In this case, the number of triangles, is similar to the previous one (160,440 triangles), but it is affected by the presence of several holes (approx. 1800), which worsen the final model appearance. In Figure 6 and 7, the four different simplification procedures (named accordingly to the previous section) are showed for two different areas of the tunnel, together with the maximum resolution meshing (named reference mesh), and the direct mesh generation result (named direct triangulation).
Sharp looking Sharp optimized
Number of triangles 168,936 144,842 Signed error against
input point cloud +0.1 ± 7.9 mm +0.1 ± 7.9 mm Average spatial
resolution 105.9 mm 114.0 mm Spatial resolution C.I.
(1 ) [91.1 - 131.8] mm [97.5 - 143.1] mm Table 4. Result of the sharp simplification method.
Smooth looking Smooth optimized
Number of triangles 172,876 114,690 Signed error against
input point cloud -0.6 ± 22.5 mm -0.6 ± 22.5 mm Average spatial
resolution 112.8 mm 136.0 mm Spatial resolution C.I.
(1 ) [104.2 - 123.9] mm [122.7 - 154.8] mm Table 5. Result of the smooth simplification method.
Tables 4 and 5 summarises the results achieved by the presented methodologies, the final spatial resolution (and its confidence intervals) and the error distance of the 3D model from the original unprocessed point cloud. The average spatial resolutions, obtained in the basis on ideal equilateral triangles for the non-optimized methods, are very similar to the reference values, as well as to the direct mesh generation (mean resolution of 104 mm).
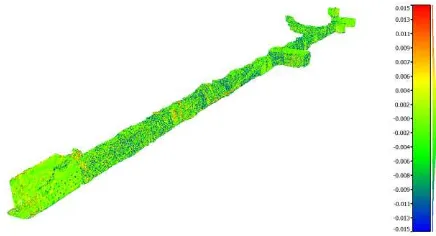
Regarding the model error, the sharp looking method achieved the best precision with a standard deviation of 8 mm, while the direct mesh generation reached up to 18 mm. As far as the smooth method is concerned, it is aimed to an extra geometric simplification, therefore it shows the highest final error (23 mm). In none of the models a significant systematic bias was detected. As example of the graphical error distribution for the sharp looking approach is showed in Figure 8, where no bias is showed nor patterns in error distribution.
Figure 8. Signed distance error for the sharp looking methodology against the original TLS point cloud.
In table 6 the result for the spatial resolution of 5 cm are showed. The reference number of triangles is 989409, but with a presence of more than 7500 holes. The improvement methods allowed a triangle reduction of 9% and 64% (sharp and smooth looking) against the direct triangulation. The model errors between the different approaches are distributed in a similar way than the 10 cm test. For a coarser resolution (20 cm) the reduction achieved is the 47% and 88% (sharp and smooth looking) against the direct mesh generation.
All the tests so far presented were done on the basis of the Poisson octree level. However, there are additional parameters that could be affected the quality of the meshing process. The first is the octree cell size that was evaluated in the experimental results. The second more relevant is the minimum number of sample points that should fall within an octree node as the octree construction is adapted to sampling density. According to Kazhdan et al., (2006), this parameter ranges from 1 to 5 for noise free data, and from 15 to 20 for noisy data. Since the precision of the data acquisition is higher than point cloud used for the evaluation, the employment of one sample per node is possible. However, the same cases evaluated previously were computed with 5 samples per node which delivers a smoother surface, without significant changes. The precision of the smooth approach was slight reduced (up to 19 mm for the 10 cm case), while in the sharp one remains without changes. The only significant effect was that the optimization methods efficiency was reduced, so the parameters should be adapted to geomatics acquisition techniques.
5.5 Texturing of the optimised mesh of the Lusern fortification’s tunnel
Finally the optimized sharp looking model at 10 cm resolution, as best compromise between geometric reduction, level of detail and discrepancy with the original data, was selected for the final texturing procedure. The acquired images were firstly relatively oriented using an automatic procedure. In order to mitigate the error accumulation when orienting large elongated
Sharp looking Sharp looking
optimized Smooth looking
Smooth looking optimized
Direct mesh generation
Numbe of triangles 723,644 593,390 725,06 234,548 651,343 Signed error against
input point cloud +0.1 ± 5.7 mm +0.1 ± 5.7 mm -0.2 ± 11.9 mm -0.2 ± 12.1 mm -0.0 ± 7.4 mm Average spatial
resolution 51.9 mm 57.5 mm 54.4 mm 91.3 mm 51.4 mm Spatial resolution C.I.
(1 ) [45.4 - 62.1] mm [50.4 - 68 ] mm [49.8 - 60.7] m [79.4 - 110.8] mm [45.3 - 60.7] mm Table 6. Results of the simplification methods for a 5 cm target resolution.
blocks of images (Nocerino et al, 2014), the 3D coordinates of some topographic targets (4 at the main entrance 3 in the middle and 4 at the exit) were used as GCPs to define the absolute orientation and scale (final spatial RMSe of 8 mm on check points) and bring the photogrammetric output into the TLS reference system. Finally the images were projected onto the 3D geometric model using also a blending process to reduce the texture jumps caused by the light source (Fig. 9).
Figure 9. The final photorealistic 3D model of the tunnel, with the texture applied over the sharp optimized 10 cm mesh.
6. CONCLUSIONS AND FUTURE PERSPECTIVES
The paper presented the 3D surveying and modelling of the underground passages on WWI fortifications. These complex scenarios were surveyed with TLS to record millions of points which needed massive post-processing in order to be easily used by non-experts. A methodology was proposed showing
that a final model >85 times lighter than the original (144,842 triangles vs 12 millions triangles at 10 cm resolution) can be derived, still preserving significant geometric information. The degree of improvement in the number of triangles is higher if the final geometrical resolution decreases. Also, the smooth error is related to the Poisson process, and adds an extra component in the final error, explaining the higher values that exceed the user spatial tolerance. In the case of the sharp looking approach the signed error against the point cloud are lower than the desired spatial resolution.
In the evaluated cases, a small bias is detected for the smoothed meshes, since in this process the data experiences a little shrink. Although the sharp looking approach has the lower performance (from 9% to 47% reduction), the significant information conserved is higher, as is shown visually (qualitative) and in the precision parameters (quantitative). The proposed workflow requires further analysis, since for the 10 cm resolution the results obtained in the optimized smooth mesh were inferior to the corresponding 5 and 20 cm cases. The reduction in a 29% of the triangles is away from the 64% and 88% achieved in the other cases.
As future work of the VAST project, we aim to test a photogrammetric approach to survey and model further underground tunnels, exploiting its low-cost approach and it additional advantage of the texture acquisition.
ACKNOWLEDGEMENTS
The VAST project is funded by Fondazione Cassa di Risparmio di Trento e Rovereto – CARITRO. The authors are really thankful to all the partners (Centro Documentazione Luserna, Istituto Cimbro Luserna, Centro Internazionale Studi di Archeologia di Superficie, Fondazione Forte Belvedere) involved in the VAST project (http://vast.fbk.eu/) as well as Archivio Storico di Trento and the Azienda per il Turismo a Folgaria, Lavarone e Luserna for their fundamental contribution and valuable support in the bibliographic and historical research.
REFERENCES
References from Journals:
Attene, M., 2010. A lightweight approach to repairing digitized polygon meshes. The visual computer, 26 (11), pp. 1393-1406.
Besl, P., McKay, N. A., 1992. Method for registration of 3-D shapes. IEEE transactions on pattern analysis and machine intelligence, 14, pp. 239-256.
Edelsbrunner, H., Mücke, E. P., 1994. Three-dimensional alpha shapes. ACM Transactions on Graphics (TOG), 13(1), pp. 43-72.
González-Aguilera, D., Muñoz-Nieto, Á., Rodríguez-Gonzálvez, P., Menéndez, M., 2011. New tools for rock art modelling: automated sensor integration in Pindal Cave. Journal of archaeological science, 38 (1), pp. 120-128.
Heck, B., 1981. Der einfluß einzelner beobachtungen auf das ergebnis einer ausgleichung und die suche nach ausreißern in den beobachtungen (Examining the effects of observations to the adjustment results and analysis of outliers). Allgemeine vermessungs-nachrichten, 88, pp.17-34.
Herrero-Huerta, M., González-Aguilera, D., Rodriguez-Gonzalvez, P., Hernández-López, D., 2015. Vineyard yield estimation by automatic 3D bunch modelling in field conditions. Computers and electronics in agriculture, 110, pp. 17-26.
Remondino, F., Rizzi, A., Jimenez Fernandez-Palacios, B., Agugiaro, G., Baratti, G., De Amicis, R., 2011. The Etruscan in 3D: from space to underground. Geoinformatics FCE CTU journal, 6, pp. 283-290.
Varnuška, M., Parus, J., Kolingerová, I., 2005. Simple holes triangulation in surface reconstruction. In: Algoritmy, pp. 280-289.
Zlot, R., Bosse, M., 2014. Efficient large-scale 3D mobile mapping and surface reconstruction of an underground mine. Field and service robotics, Springer Berlin, Heidelberg, pp. 479-493.
References from Other Literature:
Arles, A., Clerc, P., Sarah, G., Téreygeol, F., Bonnamour, G., Heckes, J., Klein, A., 2013. 3D Reconstruction and modeling of subterranean landscapes in collaborative mining archaeology projects: techniques, applications and experiences In: XXIV international CIPA symposium, Strasbourg, France, pp. 61-66.
Baarda, W., 1968. A testing procedure for use in geodetic networks. Netherlands geodetic commission, Vol. 2 (5), Delft.
Beraldin, J.A., Picard, M., Bandiera, A., Valzano, V., Negro, F., 2011. Best practices for the 3D documentation of the Grotta dei Cervi of porto Badisco, Italy. In: S&T/SPIE electronic imaging, San Francisco, USA, Vol. 7864, pp. 78640J-78640J-7.
Cignoni, P., Corsini, M., & Ranzuglia, G., 2008. Meshlab: an open-source 3D mesh processing system. Ercim news, 73, pp. 45-46.
Ferreira, A., Almeida, J.M., Silva, E., 2012. Application of visual-inertial slam for 3D mapping of underground environments. In: IROS12 4th international workshop on planning, perception and navigation for intelligent vehicles, Algarve, Portugal, pp. 61-66.
Garland, M., Heckbert, P., 1997. Surface simplification using quadric error metrics. In: SIGGRAPH 97, pp. 209-216.
Jiménez Fernández-Palacios, B., Remondino, F., Stefani, C., Lombardo, J., De Luca, L., 2013. Web visualization of complex reality-based 3d models with Nubes. In: IEEE conference digital heritage 2013, 1, pp. 701-704.
Kazhdan, M., Bolitho, M., Hoppe, H., 2006. Poisson surface reconstruction. In: 4th eurographics symposium on geometry processing.
Lichti, D., Gordon, S., 2004. Error propagation in directly georeferenced terrestrial laser scanner point clouds for cultural heritage recording. In: FIG working week, Athens, Greece.
Lowe, D. 1999. Object recognition from local scale-invariant features, In: International conference on computer vision, Corfu, Greece.
Nocerino, E., Fiorillo, F., Minto, S., Menna, F., Remondino, F., 2014. A non-conventional procedure for the 3D modeling of
WWI forts. In: The international archives of the photogrammetry, remote sensing and spatial information sciences, Riva del Garda, Italy, Vol. XL-5, pp. 457-464.
Nocerino, E., Menna, F., & Remondino, F., 2014. Accuracy of typical photogrammetric networks in cultural heritage 3D modeling projects. ISPRS-International Archives of the Photogrammetry, Remote Sensing and Spatial Information Sciences, 1, 465-472.
Pope, A. J. 1976. The statistics of residuals and the detection of outliers. NOAA technical report NOS 65 NGS 1, National ocean service, national geodetic survey, US department of commerce. Rockville, MD, Washington, 133pp.
Ramos, E.A., Sadri, B., 2007. Geometric and topological guarantees for the wrap reconstruction algorithm. In: 18th annual ACM-SIAM symposium on discrete algorithms, pp. 1086-1095.
Reshetyuk, Y., 2009. Self-calibration and direct georeferencing in terrestrial laser scanning. PhD thesis, KTH - Royal institute of technology, Stockholm, Sweden.
Roncat, A., Dublayansky, Y., Spötl, C., Dorninger, P., 2011. Full-3D surveying of caves: A case study of Mär-Chenhöhle (Austria). In: IAMG conference, Salzburg, Austria.
Roncella, R., Umili, G., Forlani, G., 2012. A novel image acquisition and processing procedure for fast tunnel DSM production. In: The international archives of the photogrammetry, remote sensing and spatial information Sciences, Melbourne, Australia, Vol. XXXIX-B5, pp. 297-302.
Soudarissanane, S., Lindenbergh, R., Menenti, M., Teunissen, P., 2009. Incidence angle influence on the quality of terrestrial laser scanning points. In: The international archives of the photogrammetry, remote sensing and spatial information sciences, Paris, France, Vol. XXXVIII-3/W8, pp. 183-188.
Ziparo, V.A., Zaratti, M., Grisetti, G., Bonanni, T.M., Serafin, J., Di Cicco, M., Proesmans, M., Van Gool, L., Vysotska, O., Bogoslavskyi, I., Stachniss, C., 2013. Exploration and mapping of catacombs with mobile robots. In: IEEE international symposium on safety, security, and rescue robotics (SSRR), pp. 21-26.
References from Websites (Last accessed on 2015, Jan. 24):
CloudCompare, 2015. EDF R&D, Telecom ParisTech. http://www.cloudcompare.org/.
![Figure 1. a) The entire complex of WWI fortifications in Lusern (Trento, Italy) with the surveyed tunnel, ca 100 m long with a section of 2 x 2 m (after [http://de.wikipedia.org/wiki/Werk_Lusern])](https://thumb-ap.123doks.com/thumbv2/123dok/3262850.1400159/1.595.67.531.355.472/figure-complex-fortifications-lusern-trento-surveyed-wikipedia-lusern.webp)