QUALITY ASSURANCE STRATEGY DEVELOPMENT
(CASE STUDY IN SMALL SCALE TAPIOCA AGROINDUSTRY)
YAOI HIDETOSHI
GRADUATE SCHOOL
BOGOR AGRICULTURAL UNIVERSITY
BOGOR
STATEMENT
I, Yaoi Hidetoshi, hereby truthfully stated that all of statement and data in my thesis which is entitled;
QUALITY ASSURANCE STRATEGY DEVELOPMENT (CASE STUDY IN SMALL SCALE TAPIOCA AGROINDUSTRY)
are the results of the study for my thesis under the supervision and advice by the respected advisory committee, except for those which are indicated clearly as literatures cited. This thesis has never been published before.
All data information, which are explained in the thesis, were stated factually and the correctness can be reviewed.
Bogor, August 2006
YAOI HIDETOSHI. F351038221. Quality Assurance Strategy Development (Case Study in Small Scale Tapioca Agroindustry)
ABSTRACT
The main food crops in Indonesia consist of paddy, cassava, maize, sweet potatoes, peanuts, and soybeans. Among these six main food crops, cassava is one of important crops in which cassava is the most potential and important in many kinds of tuber crop to produce starch as a raw material for agroindustries producing many commodities to customers.
Before processing tapioca, the crude tapioca so called “Aci” is produced from cassava by the small scale tapioca agroindustry (SSTA). In this particular two processing steps, the quality of Aci is a key issue to ensure its quality to produce tapioca in reliance of quality addressed to customers and end-users to satisfy their requirement including local food industries.
The objectives of this research were 1) to identify the factors including problems and issues in SSTA from view point of quality assurance, and 2) to develop the necessary strategy for improving quality assurance in SSTA. The research was implemented by three components, namely field survey, data analysis, and Focus Group Discussion (FGD). Data analysis was done by Quality Function Deployment (QFD) and Strength Weakness Opportunity Threat (SWOT) method.
The determination for strategy development was carried out by QFD to identify the requirement by SSTA and processing importance. The result indicated that the requirements of cassava ’s attribute identified in SSTA were freshness, discoloration, contaminant, variety, and size. The identifications of processing importance were cassava procurement, smashing, waste handling, sieving, sun drying, grinding, and marketing. Among these processing steps, the most important processing were cassava procurement and marketing of Aci.
The current condition of Aci producer was analyzed its position being in the quadrant-I with the value of 2.54 and 2.81 in SWOT matrix showing that Aci producer allows to take an aggressive strategy development approach to improve their quality assurance capability such as systems of the cassava procurement and its quality requirement, processing technology improvement, and diversification of Aci marketing. One of the conducive factors was a development of Aci quality standard for both Aci producer and customers. It also suggested that the external factors should be reviewed in order to extend support for SSTA to provide the better environment for Aci production.
Moreover, further study and or research is recommended to carry out from aspects of technology improvement of processing, quality standard of Aci, institutional supporting system, and marketing diversification. To study further, it is better to implement a baseline study involving the Aci producer, cassava producer, and the related institutions aiming at institutional building for better SSTA’s social and economic contribution.
YAOI HIDETOSHI. F351038221. Pengembangan Strategi Penjaminan Mutu (Studi Kasus di Tapioka Agroindustri Skala Kecil)
ABSTRAK
Tanaman pangan di Indonesia terdiri dari padi, ubi kayu, jagung, ubi jalar kacang tanah, dan kacang kuning. Dari enam jenis tamanan ini, ubi kayu adalah tanaman yang paling penting potensial sebagai penghasil tepung untuk bahan baku industri agro.
Sebelum pemrosesan tapioka, tapioka kasar yang disbut “Aci” dihasilkan dari ubi kayu oleh industri tapioka skala kecil di Bogor. Kualitas Aci adalah kunci dalam penentuan kualitas untuk menghasilkan tapioka untuk memenuhi persyaratan pengguna termasuk industri makanan lokal.
Tujuan penelitian ini adalah 1) mengidentifikasi faktor-faktor penjaminan mutu dalam industri tapioka skala kecil, dan 2) mengembangkan strategi penting untuk meningkatkan pemjaminan mutu pada industri tapioka skala kecil. Penelitian ini dilaksanakan dengan tiga komponen yaitu survei lapangan, analisa data dan diskusi kelompok terfokus (FGD: Focus Group Discussion). Analisa data dilakukan dengan QFD (Quality Function Deployment) dan SWOT (Strength, Weakness, Opportunity and Threat).
Hasil analisa QGD menujukkan bahwa persyaratan atribut ubi kayu adalah kesegaran, perubahan warna, pencemaran, jenis dan ukuran. Hasil identifikasi kepentingan proses adalah pengadaan ubi kayu, penghancuran, penanganan sampah, pengayakan, pengeringan matahari, penghalusan, dan pemasaran. Dari langkah-langkah proses ini yang paling penting adalah pengadaan ubi kayu dan pemasaran Aci.
Kondisi industri penghasil Aci saat ini posisinya berada pada kuadran I dengan nilai 2,54 dan 2,81 dalam matrik SWOT menunjukkan bahwa industri penghasil Aci dapat menggunakan strategi yang agresiv untuk memperbaiki kemampuan penjaminan mutunya seperti sistem pengadaan ubi kayu dan persyaratan mutunya, perbaikan teknologi proses, dan diversifikasi pemasaran Aci. Salah satu faktor kondusif adalah pengembangan standar mutu Aci baik untuk industri penghasil Aci maupun pengguna faktor- faktor eksternal harus dikaji untuk memperluas dukungan industri Aci untuk menyediakan lingkungan yang lebih baik bagi produksi Aci.
Untuk implimentasinya perlu dilaksanakan penelitian lanjutan dari aspek perbaikan teknologi proses, standar mutu Aci, sistem kelembagaan, dan diversifikasi pemasaran. Selain itu juga perlu dilakukan penelitian tentang potensi dasar (baseline study) sebagai dasar untuk pengembangan kelembangaan industri kecil tapioka dan peningkatan kontribusi social dan ekonominya.
Copyright © 2006 by Bogor Agricultural University All rights reserved
QUALITY ASSURANCE STRATEGY DEVELOPMENT
(CASE STUDY IN SMALL SCALE TAPIOCA AGROINDUSTRY)
YAOI HIDETOSHI
A thesis submitted to
Graduate School of Bogor Agricultural University, Indonesia In fulfillment of the requirements for the degre e of
Master of Science in Agroindustrial Technology
GRADUATE SCHOOL
BOGOR AGRICULTURAL UNIVERSITY
BOGOR
Thesis Title : Quality Assurance Strategy Development
(Case Study in Small Scale Tapioca Agroindustry )
Name : Yaoi Hidetoshi
Student Number : F 351038221
Approved by Advisory Committee
Dr. Ir. Anas M. Fauzi, M.Eng Chairman
Prof. Dr. Ir. Marimin, M.Sc Dr. Ir. Sutrisno, M.Agr
Member Member
Endorsed by
Chairman of Agroindustrial Technology Study Program
Dean of Graduate School
Dr. Ir. Irawadi D jamaran Dr. Ir. Khairil Anwar Notodiputro, M.Sc.
FOREWORD
During 1930s, tapioca factory had already initiated to produce tapioca in Bogor area in where cassava was widely cultivated in good production, and exported it to overseas country markets because of the quality of tapioca made in Bogor. This research is intended to clarify crude tapioca (so called as Aci) perspective processed by small scale tapioca agroindustry (SSTA) from aspect of quality assurance. It seems that both of cassava producer and Aci producer have been left behind their production pattern and value added process as it were since that time. The highlight of this research is focused to identify the factors and issues to improve quality assurance, and to develop the necessary strategy for improving quality assurance in SSTA.
It is hoped that SSTA and cassava producer will be more aggressive strategy and movement to be taken into place to improve their proud quality of product and to contribute their power to rural economic and capital development in the next decade.
During this study, Dr. Ir. Anas M. Fauzi, M.Eng, chairman of advisory committee, has patiently guided and instructed the total aspects of quality assurance, and also the guideline and framework of the study. The members of advisory committee, Prof. Dr. Ir. Marimin, M.Sc and Dr. Ir. Sutrisno, M.Agr have consistently instructed the methodology and the processing cassava producing Aci and tapioca. I am really grateful to them for their valuable instruction and guidance.
The generous support was extended by the members of Focus Group Discussion (FGD) as an expert consisting of nine members from Department of Agriculture and Forestry of Bogor Regency (Dinas Pertanian dan Kehutanan), Department of Industry and Commerce of Bogor Regency (Dinas Perindustrian dan Perdagangan), The Center of Agro-Based Industry (Balai Besar Industri Agro), and IPB. I would like to express my sincere appreciation to all members of FGD for their expertise and evaluation works on quality assurance strategy development for small scale tapioca agroindustry.
BIOGRAPHY
The author was born on 10th of February 1941 in Kobe city, Hyogo prefecture, Japan, whom farther is Yaoi Hidenori and mother is Yaoi Sueko. He is the first son and the second child out of five children.
He entered Komaba national high school in Tokyo affiliated to Tokyo University of Education (University of Tsukuba) in April 1956 and graduated in March 1959. In April 1960, he entered Faculty of Agriculture, Tokyo University of Education and graduated in March 1964.
After graduation of the university, he was employed by Japan International Cooperation Agency (JICA) in April 1964 engaging the works of overseas technical cooperation in the developing countries for almost 40 years. The last assignment before his pension was a project leader of tripartite project of “Higher Education Development Project (HEDS)” collaborated by Directorate General of Higher Education (DGHE) of the government of Indonesia, United States of Agency for International Development (USAID) and JICA during 12 years from 1990 in Jakarta, Indonesia.
LIST OF CONTENTS
Page
STATEMENT ……… i
ABSTRACT ……… ii
COPYRIGHT ……… iv
TITLE ……… v
APPROVAL ……… vi
FOREWORD ……… vii
BIOGRAPHY ……… viii
LIST OF CONTENTS ……… ix
LIST OF TABLES ……… x
LIST OF FIGURES ……… xi
LIST OF APPENDIXES ……… xii
LIST OF ABBREVIATIONS ……… xiv
I. INTRODUCTION A. Background ……… 1
B. Research Objectives ……… 3
C. Scope of Research ……… 4
D. Outcome and its Application ……… 5
II. BIBLIOGRAPHIC REVIEW A. Cassava and Tapioca Industry ……… 6
B. Tapioca Customers ……… 8
C. Quality Assurance ……… 9
D. Micro, Small and Medium Enterprises ……… 12
E. Cluster and Linkage ……… 14
F. Quality Standard ……… 17
G. Quality Function Deployment ……… 18
H. SWOT Analysis ……… 20
III. RESEARCH METHODOLOGY A. Concept of Research Study ……… 23
B. Process of Problems and Issues ……… 23
C. Data Collection ……… 25
D. Identification of Factors ……… 26
E. Analysis Method of SWOT ……… 27
F. Focus Group Discussion (FGD) ……… 28
IV. RESULT AND DISCUSSION A. Cassava Produce ……… 30
B. Crude Tapioca Producer ……… 31
C. Tapioca Producer ……… 32
D. House of Quality ……… 34
E. Strategy Development ……… 38
F. Implication of Quality Assurance Strategy ……… 44
V. CONCLUSION AND RECOMMENDATION A. Conclusion ……… 46
B. Recommendation ……… 47
REFERENCES ……… 48
LIST OF TABLES
Page
Table 1 Varieties developed in Indonesia ……… 7
Table 2 Number of tapioca industry in Indonesia ……… 8
Table 3 Consumption of tapioca in 1999 -2003 ……… 9
Table 4 Quality components and details ……… 10
Table 5 A Six-step process-oriented quality assurance cycle ……… 12
Table 6 Classificatio n of micro, small and medium enterprises …… 12
Table 7 Productivity per unit in 2003 ……… 13
Table 8 Productivity per worker in 2003 ……… 14
Table 9 Quality standard of tapioca flour ……… 18
Table 10 SWOT matrix diagram and strategies ……… 21
Table 11 Factor and parameter ……… 26
Table 12 Weighting and rating of requirement ……… 31
Table 13 Score, rating, weighting, and its conversion ……… 32
Table 14 Tapioca flour quality by some tapioca producer ……… 34
Table 15 Technical importance by relationship and correlation ……… 34
Table 16 Rating of IFE and EFE ……… 39
Table 17 Analysis of internal and external factors ……… 40
LIST OF FIGURES
Page
Figure 1 Schematics of core cluster ……… 14
Figure 2 Schematics of core cluster and linkage ……… 15
Figure 3 Schematics of primary cluster and secondary cluster ……… 16
Figure 4 Schematic view of field laboratory with cluster ……… 17
Figure 5 Two dimension of QFD ……… 18
Figure 6 Concept of house of quality ……… 19
Figure 7 Quadrant matrix and strategy provided ……… 20
Figure 8 Concept of research study ……… 23
Figure 9 Flow of research study process ……… 24
Figure 10 Data collection, respondent and client ……… 25
Figure 11 Flow of FGD implementation ……… 29
Figure 12 Operation and method of processing tapioca ……… 33
Figure 13 House of quality for SSTA ……… 35
Figure 14 Position of SSTA in SWOT matrix ……… 41
Figure 15 Strategy development by SWOT matrix ……… 43
LIST OF APPENDIXES
Page
Appendix 1 Gross domestic product (1996-2004) ……… 50
Appendix 2 Cassava production (1968 – 2005) ……… 51
Appendix 3 Cassava production in Bogor regency (2004) ……… 52
Appendix 4 Quarter-wise cassava production in Bogor regency ……… 53
Appendix 5 Questionnaire for cassava producer ……… 54
Appendix 6 Questionnaire for crude tapioca producer ……… 56
Appendix 7 Questionnaire for Expert ……… 61
Appendix 8 Results of interview of cassava producer ……… 66
Appendix 9 Respondent of cassava producer ……… 67
Appendix 10 Results of interview of crude tapioca producer ……… 68
Appendix 11 Respondent of crude tapioca producer ……… 70
Appendix 12 National quality standard of tapioca flour ……… 71
Appendix 13 Quality standard of tapioca, Aci and Onggok ……… 72
Appendix 14 Production of cassava in the world 2001 ……… 73
Appendix 15 Consumption of tapioca 1999-2003 ……… 74
Appendix 16 Satisfaction of raw material ……… 75
Appendix 17 Importance of processing raw material (All data) ………… 77
Appendix 18 Importance of processing raw material ……… 78
Appendix 19 Correlation in between processing in HOQ ……… 80
Appendix 20 Correlation in between processing steps ……… 82
Appendix 21 Characteristics of process ……… 85
Appendix 22 Relationship between requirement and processing ………… 86
Appendix 23 Factor evaluation: rating by expert in SWOT ……… 88
Appendix 24 Factor identified for SWOT analysis ……… 91
Appendix 25 Strategy development ……… 93
Appendix 26 Implication of strategy ……… 97
Appendix 27 Data of SWOT ……… 99
LIST OF ABBREVIATIONS
ABG Academy, Business, and Government Linkage
Aci Crude Tapioca
BPS Badan Pusat Statistik (BPS-Statistics Indonesia)
DNS Dewan Standardisasi Nasional (National Dtandardization Board)
EFE External Factor Evaluation
FAO Food and Agriculture Organization
FGD Focus Group Discussion
GDP Gross Domestic Product
HRD Human Resource Development
IFE Internal Factor Evaluation ITTARA Industri Tepung Tapioka Rakyat
JICA Japan International Cooperation Agency LJAP Laboratorium Jasa Analisis Pangan, IPB (Food Analysis Service Laboratory, IPB)
MOA Ministry of Agriculture
MOI Ministry of Industry
MSME Micro, Small and Medium Enterprise
OECD Organization for Economic Cooperation and Development
QFD Quality Function Deployment
SNI Standar Nasional Indonesia (National Standard of Indonesia)
SSTA Small Scale Tapioca Agroindustry
SWOT Strength, Weakness, Opportunity and Threat
UMKM Usaha Mikro Kecil Menengah (Micro Small Medium Enterprise)
I. INTRODUCTION
A. Background
1. Agricultural Sector and Agroindustry
In GDP, the contribution by the sector of agriculture including fishery and forestry, it becomes around 16% to 17% in it during year of 2000 to 2004. In case of manufacturing industry sector, it shares around 25% including agroindustry contribution (Appendix 1). But since the economic and financial crisis hit Indonesia at 1998, it is still influencing the economic development of Indonesia in terms of investment, industrialization, production, import and export. Nevertheless, the economic power of Indonesia is continuously rising by mostly the recovery of industry empowerment. The economic growth of Indonesia is very bright and steady now, and a good perspective is promised for future due to very rapid industrialization after economic crisis at 1998 (BPS, 2004).
More than 50% of about 200 million of population engaged in agriculture, it is justified to say that agriculture remains the largest sector in the Indonesian economy. Lesson learned from the current economic crisis is that agricultural sector not only the life saver during the crisis, but also becomes engine of growth for Indonesian economy. The national economic development policy has now placed the agriculture development as a priority and prime mover of the national economic growth. Particularly, an agroindustry is one of promising industrial sectors contributing GDP up, and rural and regional economic development along decentralization policy by the central government (MOA, 2004).
It is also noted that MOA has determined agribusiness as the grand strategy for the agriculture development with the vision: realization of prosperous society particularly farmers through the development of competitive, democratic, sustainable, and decentralized agribusiness. This statement means that agroindustry is a hope of economic growth in Indonesia, and it brings an economic development in rural economic empowerment.
2. Food Crops and Cassava
paddy, cassava, and maize with amount of 52,079,000 tons, 18,474,000 tons, and 10,910,000 tons respectively (BPS, 2004).
Among this big three, cassava is the most interesting crop from view points of its own character and huge potentials utilizing not only stable food, but also a raw material for agroindustry by which various kinds of cassava and tapioca based product are produced and consumed.
It is understood that cassava is a very potential raw material as tuber crop producing tapioca flour, cassava flour, and also producing byproducts such as “Onggok” which is a byproduct of crude tapioca processing and is utilized as a raw material for producing ketchup source, snack, cake, and mosquito coil (Barrett, 1987).
3. Crude Tapioca (Aci)
Tapioca starch is obtained from the root of cassava (manioc plant). At home industry of tapioca, the root is washed and rasped into slurry which is separated from the pulp by hand (so called “Onggok” or “Ampas”). Starch slurry is kept in batch pool for sedimentary processing. A crude tapioca is obtained from this sediment of starch after sun drying.
Thus such processing at home industry, crude tapioca is a coarse granule starch and it is called as “Aci” in Indonesian language. Aci is processed at refinery factory to be tapioca flour.
4. Small Scale Tapioca Agroindustry (SSTA)
An agroindustry is a key industry in Indonesia because of value added performance and natural resources utilization. Such agroindustry is huge to increase the Indonesian economics for the next decade (MOA, 2003).
Another point is UMKM1 empowerment. It is a resource of economic development from aspects of 1) technology, 2) productivity and 3) human resource. MOI also identifies that UMKM as regional economy activator is an industry producing commodities and services which are based on available natural resources (MOI, 2003).
5. Quality of Product by UMKM and Quality Assurance
A quality is critically important to ensure addressed to customers and end-users for the product in good quality. Regarding the quality of products by UMKM, MOI in the master plan (2000-2004) assumed them in specific conditions in comparison with the various products from abroad with high competitive ability such as lack of attention in hygienic aspect, still using inappropriate/prohibited food additional material, various quality products not fulfilling the standard, and not consistent quality. To improve such undesirable conditions and inconformity assumed, a quality assurance is a way to find solutions in processing, management and marketing rather than to approach by way of quality control.
A quality must be defined in terms of the demands of the market to be served, namely market acceptance, health and safety, stability or shelf life, consistency, and cost effectiveness. Modern quality assurance and philosophy are focused not on products, but rather on the processes used to produce them. The basic notion is that if one gets processes to work effectively the resulting products will automatically be good. (Brown, 1994)
In case of tapioca flour, it is ensured its quality by SNI2 01-3451-1994 indicating the standard of contents such as moisture, ash, HCN, mineral, contaminant and also whiteness degree and acid degree. Nevertheless, there is no standard available for crude tapioca (Aci) so far.
B. Research Objectives
Upon the results of overall review on agriculture, agroindustry, UMKM, quality of products, this research targets the Aci produced by SSTA as one of UMKMs from view point of quality assurance. This aims to develop the strategy in quality assurance necessary for SSTA to empower their performance. Accordingly, the objectives of the research study are;
1. to identify the factors regarding quality assurance including problems and issues in SSTA from view point of quality assurance, and
2. to develop strategy to conduct quality assurance in the targeted SSTA for their practical and operational application for future.
C. Scope of Research
1. Target crop and commodity
The target crop and commodity are cassava and Aci. Cassava is one of big three crops in Indonesia and has a huge potential for agroindustry, and it is cultivated by farmer who supplies it to SSTA. Cassava is processed by SSTA in rural area produc ing the secondary raw material of Aci for tapioca industry. This kind of processing hierarchy can not be seen in other crops and commodity except a few crops such as Aren (Arenga pinnata) and sago (Maranta arundinacea).
2. Delineation of quality assurance
The study on quality assurance strategy development covers the quality of raw material, processing of cassava, and marketing for Aci. Due to processing hierarchy (cassava-Aci-tapioca), quality assurance should cover the quality of cassava and also the quality of Aci that there is no standard to identify its characteristics in tem of quality of commodity addressed to customers and end-users.
3. Target area
The target area for the research is Sukaraja district (kecamatan) in Bogor regency (kabupaten) and north Bogor district in Bogor city. This is because Sukaraja district is the highest cassava production area among 35 districts in Bogor regency, and is also a high SSTA density operating Aci production. Another reason is an access to approach to there from the main access road for carrying out the site survey.
4. Strategy development
The strategy development is focused on both cassava producer and SSTA, not including tapioca producer. This is based on rural economic contribution and empowerment of both of them. Upon the developed strategies, the necessary measures are deployed in forms of a linkage between industry and related institutions or ABG3 approach, some conducive supports by the local government, and minimum and possible self institutional building for SSTA in rural area.
D. Outcome and its Application
The outcome of this research is expected that an approach by quality assurance might be contributed to empower SSTA to produce better quality Aci addressing to their customers, particularly local food industries in the target area of Bogor.
For instance, if the quality standard of Aci would be realized upon the necessity and requirement by Aci producer, a great progress could be seen and also realized at their better performance of quality assurance. This is a kind of a real conducive support for both cassava producer and Aci producer.
II. BIBLIOGRAPHIC REVIEW
A. Cassava and Tapioca Industry
1. Dissemination of Cassava and Tapioca
The manioc (Cassava : Maniohot esculenta Crantz) is a native of Central America which only in the tropics is flourish, and it was taken by Spaniards and Portuguese to Africa and Asia. It had not been grown successfully on a large scale in the southern part of United State. It was transported from Brazil to Jawa, Singapore and Malaysia around 1850. During the greater part of the 1919-1941, about 98 % of the production of tapioca flour was in Jawa in where the plant was generally referred to as cassava and the starch as tapioca flour.
Before the Japanese invasion during World War II, there were three large European estates and one Chinese estate in Jawa growing cassava and exporting tapioca starch and food tapioca. These estates were large and well equipped factory then worked up the roots to yield a fine quality of starch. The quality of starch from Jawa was superior to that from Brazil.
There were also many small Chinese and Javanese factories making cassava flour and manioc foods. During 1937 and 1938, about 180,000 ton of tapioca were imported into the United States, valued at about $8,000,000, 97 % being from Indonesia. These large quantities were imported because of short corn in the United States during 1936 and 1937. In 1939, 172,000 ton of high quality tapioca starch were imported almost entirely from Jawa into the United States. By 1942 this supply was entirely cut off by World War II (Brautlecht, 1953).
2. Cassava Variety and Tuber
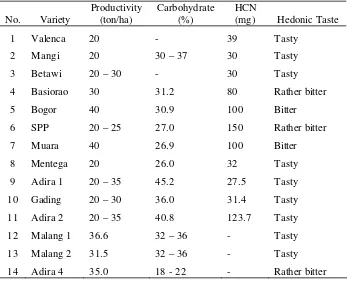
Thus, cassava has been widely cultivated in Indonesia since it had transferred from Central America at around 1850 serving for food and raw material of starch. Many efforts had been paid to improve variety propagation and its quality needed by customer. In Indonesia, there were many varieties developed based on the foreign variety propagation as shown Table 1 (Rakmana, 1997).
(rind), and core. The sub-periderm, usually 2 to 3 mm thick, contains 50% of the starch as the core of the tuber does and it also contains most of the hydrocyanic acid (HCN), which cause some discoloring of the starch. In large factories, only outer skin or corky layer is removed as it is profitable to recover the starch from rind, which represents about 8 to 15% of the total root by weight (Balagopalan, 1988 and Barrett, 1987).
Table 1 Varieties developed in Indonesia
No. Variety
Productivity (ton/ha)
Carbohydrate (%)
HCN
(mg) Hedonic Taste
1 Valenca 20 - 39 Tasty
2 Mangi 20 30 – 37 30 Tasty
3 Betawi 20 – 30 - 30 Tasty
4 Basiorao 30 31.2 80 Rather bitter
5 Bogor 40 30.9 100 Bitter
6 SPP 20 – 25 27.0 150 Rather bitter
7 Muara 40 26.9 100 Bitter
8 Mentega 20 26.0 32 Tasty
9 Adira 1 20 – 35 45.2 27.5 Tasty
10 Gading 20 – 30 36.0 31.4 Tasty
11 Adira 2 20 – 35 40.8 123.7 Tasty
12 Malang 1 36.6 32 – 36 - Tasty
13 Malang 2 31.5 32 – 36 - Tasty
14 Adira 4 35.0 18 - 22 - Rather bitter
Source: Rakmana (1997)
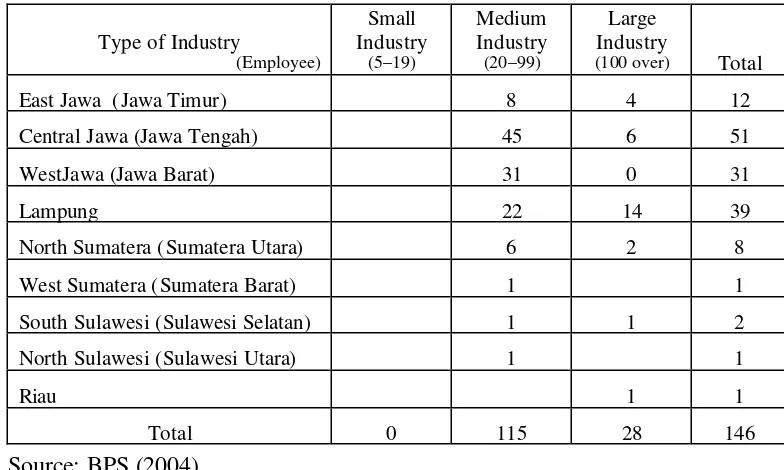
3. Tapioca Industry in Indonesia
This directory indicates that there is no small industry of tapioca flour processing, but according to the department of industry and trade of Bogor regency, there are 7 tapioca flour industries of which capacity varies from 30 to 5,000 ton per year.
Table 2 Number of tapioca industry in Indonesia
Type of Industry
(Employee)
Small Industry
(5–19)
Medium Industry (20–99)
Large Industry
(100 over) Total
East Jawa (Jawa Timur) 8 4 12
Central Jawa (Jawa Tengah) 45 6 51
WestJawa (Jawa Barat) 31 0 31
Lampung 22 14 39
North Sumatera (Sumatera Utara) 6 2 8
West Sumatera (Sumatera Barat) 1 1
South Sulawesi (Sulawesi Selatan) 1 1 2
North Sulawesi (Sulawesi Utara) 1 1
Riau 1 1
Total 0 115 28 146
Source: BPS (2004)
4. Processing of Cassava 1) Starch Process Sharing
Cassava is one of richest sources of starch. The tuber root contains about 30% of starch and is low in proteins, soluble carbohydrates, and fats. Extraction of starch from cassava is a simple and straightly process without the problems associated with the manufacture of corn, wheat, or other cereal starches. The process is differed from other starch crops that the extraction is applied at micro, small, medium, and large scale of production. Consequently, 3 producers (cassava, Aci, and tapioca) play the roles each other for producing tapioca flour in the target area (Appendix 6).
Peeling
Cassava Producer
Smashing (Rasping)
Extraction
Sedimentation
Drying
Sieving Pulverizing
Tapioca Flour
Crude Tapioca (Aci)
Harvesting
Aci Producer
Tapioca Producer
Peeled Tuber
The most essential factor in the production of good quality tapioca is that the whole process from harvesting the tubers to completion of the final product should be carried out in the shortest time possible, since deterioration sets in from the time to root harvest and proceeds throughout the process (Balagopalan, 1988, Eris 2005, and Rochaeni 2004).
Figure 1 Production flow by three produces
2) Starch Process Stage
Basically, cassava starch manufacturing can be divided into the following stages:
1) Washing and peeling of the tubers to remove and separate all adhering soil and as much protective epidermis as necessary.
2) Smashing or disintegration to destroy the cellular structure and to rupture the cell walls to release the starch as discrete, undamaged granules from other insoluble matter.
3) Screening or extraction to separate comminuted pulp into two fractions, i.e. waste fibrous material and starch milk.
5) Drying to remove sufficient moisture from the damp starch cake obtained during the separation stage so as to reduce. the moisture content from 14 to 35% to 12 to 14%, a level low enough for long-term storage.
6) Finishing operations such as pulverizing, sifting, and bagging.
The quality of tapioca starch produced depends to a great extent on the proper performance of the whole series of operations for separating the pure starch from soluble contaminants. They result in concentrated suspension of starch in clean water, and the entire processing of cassava must be completed within as short a time as possible. It is also noted that the separation of free starch from its suspension in the clean water is a key processing because of the very rapid chemical changes in the solution and formation of very stable complexes between starch and proteins fatty materials from which it is almost impossible to separate the pure starch (Balagopalan, 1988).
3) Cassava Material Balance
According to Balagopalan (1988), cassava tuber has an average composition of 60 to 65% moisture, 30 to 35% carbohydrate, 02. to 0.6% ether extractives, and 1 to 2% crude protein. Carbohydrate fraction contains 3.2to 4.5% crude fiber and 95 to 97% nitrogen- free-extract (NFE). The tuber NFE contains 80% starch and 20% sugars and amides.
These contents are varied according to the varieties, soil profiles, fertilizer application, cultivation techniques, and growth periods before harvest. The starch content increases with the growth of tuber and reaches a maximum between the 8th and 12th month after planting. If 1,000 ton cassava is harvested at the right timing of growth, the starch is supposed to be approximately retained as much as 230 kg, counting the amount of the tuber skin (30%) and losses (starch base: 10 kg), and also the amount of the by-product so called “Ampas” of “Onggok” (38%) as shown in Appendix 6 (Rris, 2005 and LJAP, 2006).
B. Tapioca Customers
plywood and veneer adhesives and in laundries. For laundry use, it is regarded as inferior to rice starch. Tapioca flour is used as a food in cracker (krupuk), snack, pudding, pie, instant noodle, bread, and so many other tapioca based foods (Brautlecht, 1953).
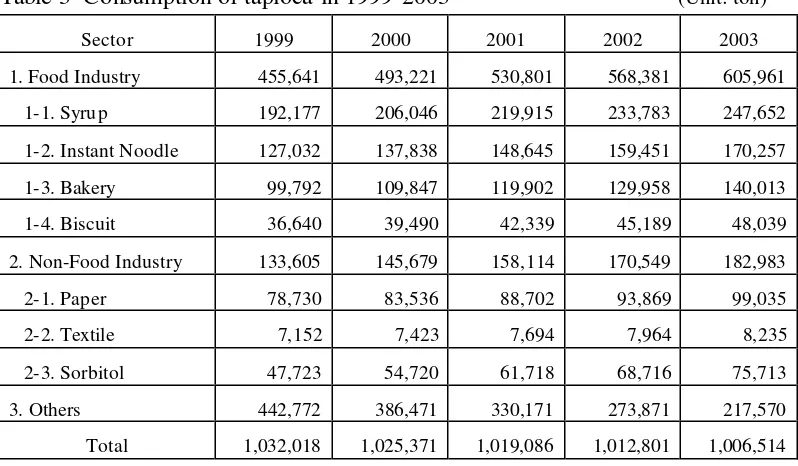
Thus, tapioca has been using as a raw and basic material for food industries and non- food industries such as paper industry, textile industry and ply wood industry indicating many customers looking for tapioca. But the consumption of tapioca has been gaining the same consumption volume in last few years according to Rochaeni (2004).
Food industries, especially syrup, instant noodle, and bakery industries are a top three customer. In non-food industry, paper and sorbitol industries are a good customer of tapioca. All industries except others mentioned in the Table-1. have been increasing their consumption year by year, approximately 6 to 8 % growth rate in case of food industry and 7 to 9 % growth rate in case of non food industry as well.
In addition to the current customers using tapioca, the potential industries are identified to use tapioca as raw material for their food products more and non-food industries as well. The marketing effort is quite important for further development of market.
Table 3 Consumption of tapioca in 1999-2003 (Unit: ton)
Sector 1999 2000 2001 2002 2003
1. Food Industry 455,641 493,221 530,801 568,381 605,961
1-1. Syrup 192,177 206,046 219,915 233,783 247,652
1-2. Instant Noodle 127,032 137,838 148,645 159,451 170,257
1-3. Bakery 99,792 109,847 119,902 129,958 140,013
1-4. Biscuit 36,640 39,490 42,339 45,189 48,039
2. Non-Food Industry 133,605 145,679 158,114 170,549 182,983
2-1. Paper 78,730 83,536 88,702 93,869 99,035
2-2. Textile 7,152 7,423 7,694 7,964 8,235
2-3. Sorbitol 47,723 54,720 61,718 68,716 75,713
3. Others 442,772 386,471 330,171 273,871 217,570
Total 1,032,018 1,025,371 1,019,086 1,012,801 1,006,514
C. Quality Assurance
1. Concept of Quality Assurance and Components
A good quality is a reliance of product addressed to customers and end-users who want to buy or to use again the same product as reciprocator. Once failed quality in product, nobody wants to buy again. Once quality is believed, everybody wants to buy or to use it continuously without any doubt. This is a principle of product to be survived in competitive market.
According to Brown (1994), regarding product quality, a quality must be defined in terms of the demands of the market to be served; what characteristics are buyers willing to pay for?, and what characteristics are required by third parties? In other words, what quality features will promote the sale of the product and what features will facilitate access to the market? The principal factors affecting quality are those that have to do with market acceptance, health and safety, stability or shelf life, cons istency, and cost effectiveness. These components are summarized as shown in Table 4.
In case of tapioca as one of food materials, consumer appeal is first elicited by the products’ appearance such as color, shape, and size. The water content, impurities percentage, the day(s) spent for sun drying, and smell of flour may be added into the list before the consumer (tapioca factory) decides to buy the product at the second time.
The relative importance of these dimensions to consumer appeal will vary from product to product, and from segment to segment of the market. Technical specifications have been developed for each of these dimensions in the case of most products. These specifications should be described in product to supply the proposed market.
According to Jobe (1998), in case of goods, quality assurance is issues of reliability, appropriateness of configuration, fit and finish of parts and so on. In evaluating “quality” of both goods and services, there is typical an implicit understanding that these issues will be balanced against corresponding costs to determine overall “value”. Consequently, quality is defined in a good, and service is fitness for use.
that if one gets processes to work effectively the resulting products will automatically be good.
Table 4 Quality components and details
No. Component Details
1) Market acceptance customer appeal; color, shape, size, aroma
2) Health and safety its standard decide by the ministries concerned. For example, U.S. Code of Federal Regulations
3) Stability or shelf life
purity, additives (components), residue, preservation process, for example, OECD markets
4) Consistency must be consistent in order to maintain consumer acceptance and market access. The tolerance or range above and below the median values of the standard.
5) Cost effectiveness financial factors (quality standard must be selected with the cost in mind.), packaging (customer perceives the package: to protect product, to use product, to keep product)
6) Management must ensure facilities, training personnel, laboratory activities, and storage and handling system
Source: Brown (1994)
It is important to note that while process-oriented quality improvement efforts have a center stage these days, product-oriented methods and efforts still have their place. And a product-oriented inspection is critically necessary to ensure the quality of product, but it alone is not sufficient to produce an important quality improvement.
A third major emphasis in modern quality assurance is that of continual improvement. Consumers are expecting ever more effective and qualified goods and services. And modern quality philosophy says that this kind of improvement must and will continue in a competitive world, if an organization does not continually improve what it does and makes, it will not be long before aggressive competition drives it from the market place. For approaching modern quality problems, a six-step process-oriented quality assurance cycle presents a wide array tools for quality assurance as shown in Table 5.
Each one of steps is expressed by the descriptions in the Table from the beginning the attempt of logical analysis of a process works and potential trouble spots. The key step is the characterization of the current process, product performance, and its quality addressing to the customers and the users of their products.
In case of SSTA, their safe guideline is a work to improve their processing of cassava to provide the better quality of Aci to tapioca producers and also to local food home industries in their territory of market. With accordance with the six step process, which are oriented quality assurance cycle and corresponding tools, are a key issue for SSTA.
Table 5 Six-step process-oriented quality assurance cycle and corresponding tools
Step Tools
1 Attempt a logical analysis of a process works and potential trouble spots sources of variation, and data located.
• Flow chart
• Fishbone Diagram
• Cause-and-Effective Diagram 2 Formulate appropriate measure of
process performance and develop corresponding measurement systems.
• Basic concepts of measurement / metrology
• Gage repeatability and reproducibility
3 Habitually collect and summarize process data.
• Simple quality assurance
• Simple statistical graphics 4 Assess and process stability work • Control chart
5 Characterize current process and product performance.
• Statistical graphics for process characterization
• Measures of process capability and performance
6 Work to improve those processes that
are unsatisfactory. •
Design and analysis of experiments
2. Cassava Property of Deterioration
One of the major constraints in the utilization of cassava is the rapid perishability of the tubers after harvest. Biochemical changes and microbial infestation spoil the tubers and make them unfit for consumption. This very often poses problems as the transportation over very long distances to the processing sites leads to the deterioration in the quality of the tubers.
According to Brautlecht (1953), two types of deterioration have been reported in the case of cassava. The primary deterioration manifested as blue-black streaks which become more intensive towards the periphery of the cortex has been described. Secondary, deterioration is caused by invading pathogens. The vascular streaking phenomena is initially of a blue or blue-black color later turning brown in the form of vascular streaks which can be clearly seen in longitudinal sections of the roots. The changes in color spread to parenchymal cells which turn to a bluish color. The biochemical nature of spoilage of tubers have been investigated in detail (Table 6).
Rapid reduction in starch and moisture, and increases in sugar content were observed during the course of deterioration of tubers after harvest. Involvement of enzymes like cellulases, amylases, and pectinases have also been recorded during the course of spoilage of cassava tubers. Both cellular and extra-cellular enzymes in harmony participated in the deterioration of cassava after harvest.
Table 6 Biochemical change during deterioration of fresh cassava Period of storage (days) Constituents Variety
0 1 2 3 4 5 6 7
H-1687 38.4 38.4 36.4 35.2 34.8 34.4 31.6 30.0 Dry matter (%)
H-2304 41.6 40.4 38.4 38.4 38.0 38.4 38.0 35.2
H-1687 28.3 27.3 24.0 24.0 24.7 22.7 23.3 23.3 Starch (g/100g
fresh weight)
H-2304 29.2 29.2 28.3 24.7 24.7 24.0 24.0 24.0
H-1687 0.70 0.80 0.89 0.80 0.95 1.05 1.10 1.31 Sugar (g/100g
fresh weight)
H-2304 0.59 0.59 0.65 0.87 0.95 1.00 1.05 1.05
H-1687 90 90 45 30 38 60 30 30
HCN (rng/g dry weight)
H-2304 60 60 45 30 30 45 30 23
3. Tapioca Starch Properties
Tapioca is an important raw material for various kinds of industries, e.g., food, textile, paper, adhesive industry, dextrin industry and sweetener industry. Such industries require a certain chemical property and/or physical property for their manufacturing processing and final products. The properties of tapioca starch are well known as color and appearance, acidity or pH, flow property, size and shape of granules amylase content, gelatinization temperature, viscosity, swelling power and solubility, and sol stability. Coinciding with such properties, tapioca flour has been using for manufacturing high fructose syrup in USA and European countries (Tjokroadikoesoemo, 1985).
Considering the quality of tapioca, the important properties are 1) color and appearance, 2) acidity or pH, and 3) viscosity in comparison with the items mentioned in Quality Standard of Indonesia (Tapioca Flour: SNI 01-3451-1994).
1) Color and appearance: When cassava is processed properly, Aci and tapioca flour are very white in color. When tuber is smashed without removing the skin (rind), there is a dullness in the color. The reduction in whiteness not only affects the quality but also the price. In Case of sago manufacture, the flour obtained by using the starch extracted after removing the rind possess a greater whiteness.
2) Acidity or pH: Normal pH of cassava tuber is 6.3 to 6.5 and the starch slurry also exhibits a similar value. The specifications vary for the pH, but SNI allows an acidity maximum range of 3.0ml 1N NaOH per 100g. 3) Viscosity: A viscosity is another important property of starch solutions,
D. Micro, Small and Medium Enterprises (UMKM)
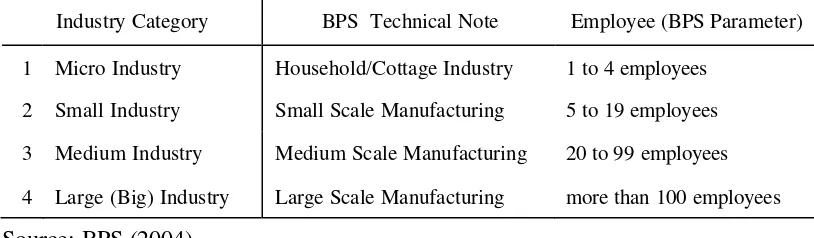
[image:31.596.113.520.222.341.2]The definition of UMKM varies according to the ministry and institution concerned, and the common definition is not come out yet. But, BPS definition is generally used now days basing upon the number of employee as shown in Table 6. (Statistical yearbook of Indonesia, 2004. p.252)
Table 7 Classification of micro, small and medium enterprises (UMKM)
Industry Category BPS Technical Note Employee (BPS Parameter) 1 Micro Industry Household/Cottage Industry 1 to 4 employees
2 Small Industry Small Scale Manufacturing 5 to 19 employees 3 Medium Industry Medium Scale Manufacturing 20 to 99 employees 4 Large (Big) Industry Large Scale Manufacturing more than 100 employees Source: BPS (2004)
Beside of BPS’s definition, MOI has own category expressing the scale of industry into three categories i.e., small industry, medium industry and big industry. According to MOI, the definition is depending on the amount of asset excluding building and land.
• Small industry : up to 200 million Rupiah
• Medium industry : more than 200 million Rupiah up to 10,000 million Rupiah
• Big industry : more than 10,000 million Rupiah
According to Ministry of Cooperation and SME, MSMEs1 are very important, not only for economic growth and job creation, but also for poverty alleviation. MSMEs are also very strategic in term of their characteristics (Soetrisno, 2005).
• 99% or 42.4 million units of establishment in Indonesia are MSME. • 99.5% of total manpower contributed by MSME.
• 57% of GDP contributed by MSME. • 19% of total export is from MSME. • Contribution to national growth is 2-4%.
Table 8 Productivity per unit in 2003 (Unit: Million Rp.)
Sector Small Medium Big Total
1 Agriculture 10.24 15,394.11 232,691.10 248,095.45
2 Mining & Quarrying 41.79 3,200.17 354,068.22 357,310.18
3 Manufacturing Industry 27.39 7,384.56 471,573.48 478,985.43
4 Electric, Gas, Water 19.77 2,505.32 416,812.14 419,337.23
5 Construction 276.39 2,454.92 167,567.91 170,299.22
6 Trade, Hotel & Restaurant 26.02 2,865.52 26,230.07 29,121.61
7 Transportation & Communication 13.33 8,174.38 245,169.51 253,357.22
8 Finance, Leasing & Consultant 705.58 8,709.61 143,693.02 153,108.21
9 Other Service Sector 22.38 1,512.73 321,192.47 322,727.58
Total 1,142.89 52,201.32 2,378,997.92 2,432,342.13
Source: Suetrisno (2005)
It also added that poverty eradication has strong linkages with MSME development. If every unit of MSME can be facilitated and empowered to create at least one person of job opportunities or additional new enterprise, it will create 40 millions new job opportunities. For example, problems of MSME in general;
1. Lack of access to productive resources, particularly financial 2. Business environment that creates high cost economy for MSME 3. Limited internal capabilities of MSME, including technological aspect,
management and entrepreneurship
4. Lack of market access and more tight and unfair competition 5. Supporting institutions which are not well developed
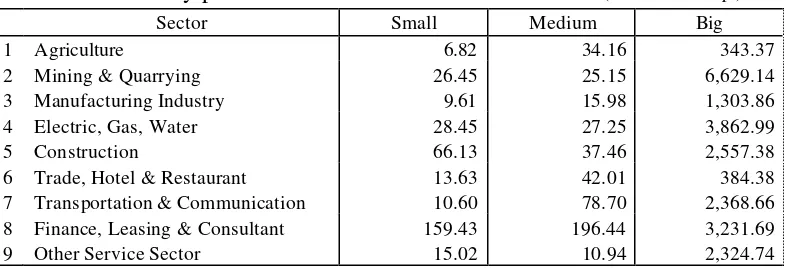
Table 9 Productivity per worker (Unit: Million Rp.)
Sector Small Medium Big
1 Agriculture 6.82 34.16 343.37
2 Mining & Quarrying 26.45 25.15 6,629.14
3 Manufacturing Industry 9.61 15.98 1,303.86
4 Electric, Gas, Water 28.45 27.25 3,862.99
5 Construction 66.13 37.46 2,557.38
6 Trade, Hotel & Restaurant 13.63 42.01 384.38 7 Transportation & Communication 10.60 78.70 2,368.66 8 Finance, Leasing & Consultant 159.43 196.44 3,231.69
9 Other Service Sector 15.02 10.94 2,324.74
[image:32.596.118.512.571.705.2]Supporting Industry
Related Industry
Core Cluster Tapioca Industry
Cassava Producer
Carpenter Blacksmith
Local Manufacturer Cassava
Producer Cassava
Producer
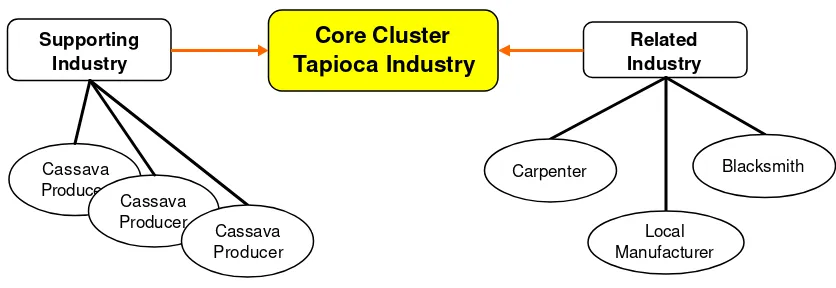
E. Cluster and Linkage
According to Nagae (2004), cluster approach has been applying for development of IKM. Ministry of trade and industry released “National Industry Development Strategy” in November 2000 in which a cluster policy was identified as a prime mover for industry development. It is also included into the rolling plan of IKM development 2002-2004. It is noted that a cluster industry is a value added chain (group) of industry consisting of “core cluster industry”, “group of supporting industry”, and “group of related industry” aiming at competitiveness increase in the market, and also cost reduction of processing, shipping, transportation, and marketing in cluster industry.
Cluster industry in Indonesia can be divided into five categories in accordance with OECD clarification.
1. Natural resource intensive cluster 2. Labor intensive cluster
[image:33.596.111.529.441.585.2]3. Capital intensive cluster 4. Technology intensive cluster 5. Policy driven cluster
Figure 2 Schematics of core cluster
Linkage
----Core Cluster
Provincial Authorities Technical
Team
Asnawi (2002) reported that ITTARA (Industri Tepung Tapioka Rekyat) was successfully implemented by the provincial government of Lampung since 1998. The government had paid attention to the cassava farmer who are very poor, and provided a special program to support them in term of tapioca home industry in cluster form named by ITTARA. This is an umbrella program led by the government and the advisory technical group, and KUD people concerned. The objectives of ITTARA are;
1. increase value added in raw material for cassava farmer
2. improve technology for cassava cultivation and tapioca treatment 3. develop plan and activity by themselves in village scale
4. open crude tapioca factory to cassava farmer for their treatment
Figure 3 Schematics of core cluster and linkage
From view point s of cluster and ABG linkage, this ITTARA umbrella program is seemed to be very appreciated as a good example to think of both cluster and linkage in grass-root basis development. Upon literature review including ITTARA, some of hypothesis could be generated as follows.
1. A cluster is formed with an input sector supplying raw material, a processing sector, and a market sector to encourage their power and performance better.
Medium Industry <Tapioca>
Home Industry <Crude Tapioca>
Farmer <Cassava>
Farmer <Cassava>
Farmer <Cassava>
Home Industry <Crude Tapioca>
Farmer <Cassava>
Farmer <Cassava>
Farmer <Cassava>
--- CoreCluster --- CoreCluster
Primary Cluster Primary Cluster
Secondary Cluster
---3. Therefore, a tripartite linkage together with cluster principle is likely proposed in this paper to succeed such agroindustry in rural development program for future.
4. Toward this kind of formation of value added chain development, a technical support must be extended by academic institution or a supporting group, and a research & development will be also implemented to improve the current processing techniques.
Figure 4 Schematic view of primary cluster and secondary cluster
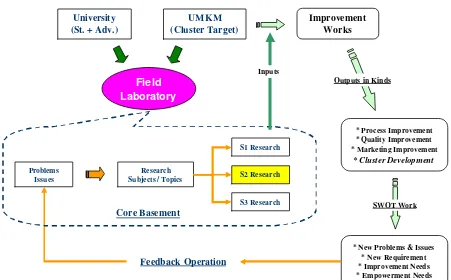
5. Academic institution and UMKM linkage: This is just a proposal of linkage between academic institution and UMKM in agroindustry aiming at a site based research to fit the real needs and requirements, and also aiming at UMKM empowerment in term of quality assurance.
University (St. + Adv.)
UMKM (Cluster Target)
Field Laboratory
Problems Issues
Research Subjects / Topics
S1 Research
S2 Research
S3 Research
Improvement Works
* Process Improvement * Quality Improvement * Marketing Improvement
* Cluster Development
Inputs
Outputs in Kinds
* New Problems & Issues * New Requirement * Improvement Needs * Empowerment Needs Feedback Operation
[image:36.596.96.547.98.378.2]SWOT Work Core Basement
Figure 5 Schematic view of field laboratory with cluster
F. Quality Standard
The baseline of the quality of tapioca flour is designated by National Standard of Indonesia so call SNI2, in which the standard of tapioca flour is designated by SNI 01-3451-1994. This SNI defined by “Dewan Standardisasi Nasional (DNS)” specifying the terminologies, the items of standard, and method of analysis. According to SNI 01-3451-1994, the quality of tapioca flour is to be defined in terms of moisture content, ash content, fiber and contaminant, whiteness degree, viscosity, acid degree, HCN content, and mineral contents.
It also describes the classification of tapioca flour quality into three categories, i.e. class -I, class -II, and class -III that are consisting of several analysis items to assure its quality for the customers of industries and the end-users of local food home industries as shown in Table-10.
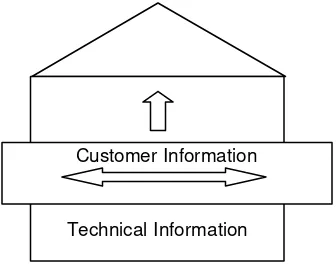
Technical Information Customer Information
Table 10 Quality standard of tapioca flour
Specified Quality
No Analysis Item Unit
Class I Class II Class III
1. Moisture Content, (b/b) % max. 17 max. 17 max. 17
2. Ash Content, (b/b) % max. 0.60 maks.0.60 max. 0.60
3. Fiber & Contaminant,
(b/b) % max. 0.60 max. 0.60 max. 0.60
4. Whiteness Degree
(BaSO4= l00) - min. 94.5 min. 92.0
Less than 92.0
5. Viscosity °Engler 3.0 – 4.0 2.5 – 3.0 Less than 2.5
6. Degree of Acidity ml 1N NaOH/
100g
3.0 3.0 3.0
7. HCN Content, (b/b) % Negative Negative Negative
Source: DSN (1994)
G. Quality Function Deployment
To improve quality of commodity and service provided to customers and end-users, Quality Function Deployment (QFD) is one of analysis tools which is fitted and appropriated to be applied for this research.
According Gaspersz (2001) and Marimin (2004), QFD analysis has good advantages to clarify and find out customers requirements and needs toward product and service provided, to identify problems and issues in product and service, to decide the necessary components to be improved and/or developed, and to provide the counter measures of improving the quality of product and service. The principle of QFD analysis is consisted of two dimensions of customer information and technical information as shown in Figure 5.
Identity Tradeoffs relating to manufacturing
Requirements
Manufacturer's Current Requirements / Specifications to Suppliers
RELATIONSHIPS
What do customer requirements mean to manufacturer?
Where are interactions between relationships?
Prioritized List of Manufacturer's Critical
Process Requirement
Planning Matrix Importance Rating Competitive Rating
Target Values Scale-up Needed
Sales Point
Planning weight (Calculated) CUSTOMER INPUT
(Requirement)
4 1
2
3
5
6
These things are systematized into one matrix so called “House of Quality (HOQ)” by the following steps identifying (Diana, 2001);
1. voice of customers (what do they want?)
2. technical response as manufacturer's current requirements (how do these identify as characteristics?)
3. planning matrix, importance rating, competitive rating, target values, scale-up needed, and etc.
4. identification of relationship between technical matter and customer requirement by use of relationship matrix. What do customer requirements mean to manufacturer? Where are interactions between relationships?
5. identification of technical priorities, bench marks, and required capability toward target quality improvement of product and service 6. identification of tradeoff (correlation) relating to manufacturing
requirements
[image:38.596.121.533.400.706.2]
<External Factor>
Opportunity
<Internal Factor>
Strength
<External Factor>
Threats
<Internal Factor>
Weakness
Quadrant-I
Strategy ? Aggressive
Quadrant-III
Strategy ? Turn-around
Quadrant-II
Strategy ? Diversifying
Quadrant-IV
Strategy ? Defensive
H. SWOT Analysis
1. SWOT Analysis Method
The development of strategy in the study is done by SWOT (Strength, Weakness, Opportunity and Threats) matrix analysis. Upon the results of SWOT analysis, the target alternatives are squeezed necessary for finding the appropriate strategy in the study in quality assurance in agroindusty sector. Thus, SWOT analysis can identify the related factors in the matrix, and provides the current potion and the strategies to be taken place, and also the weaknesses to be minimized (Rangkuti, 1998).
[image:39.596.126.494.328.635.2]There are four quadrants in the matrix along with the external factors (opportunity and threat) and the internal factor (weakness and strength) as shown Figure 8. At each quadrant, there is own direction of strategy to be taken place as shown Table 9.
Quadrant-I : Strategy Aggressive Quadrant-II : Strategy Diversifying Quadrant-III : Strategy Turn-around Quadrant-IV : Strategy Defensive
Figure 8 Quadrant matrix diagram and strategies provided
2. SWOT Matrix
at each SWOT. The strategies will be formulated with the following matrix (Table 11).
Table 11 SWOT matrix table and appropriate strategies
IFA / EFA Strengths (S) Weaknesses (W)
Strategy SO Strategy WO
Opportunities (O)
Strategy is to be developed maximizing strengths coinciding with available opportunities and its advantages whenever the position is in quadrant-I.
Strategy is to be developed minimizing weaknesses so as to apply available opportunities whenever the position is in quadrant-III.
Strategy ST Strategy WT
Threats (T)
Strategy is to be developed maximizing strengths so as to overcome or contend the threats whenever the position is in quadrant-II.
Strategy is to be developed minimizing weaknesses so as to avoid threats whenever the position is in quadrant-IV.
Source: Marimin (2004) and Rangkuti (2006)
To prepare SWOT matrix, all factors of four components are gathered together, and elaborated and listed into the matrix table. By use of weight and rating for evaluation of the internal factors and the external factors, the two score values will be gained as 1) IFE(Strength – Weakness) and 2) EFE (Opportunity – Threat) which are showing the current position of the target home industry in the matrix quadrant.
Consequently, the strategies can be provided indicating the directions and/or policies to be taken place in accordance with the existing strengths, weaknesses, opportunities, and threats, e.g., aggressive policy, diversifying policy, turn around policy, and defensive policy in quadrant-I, quadrant-II, quadrant-III, quadrant-IV respectively. Upon the position and its policy, it is assumed that the factors of strengths must be ma ximized as much as possible towards especially opportunities, and the factors of weaknesses must be minimized or overcome towards opportunities and threats given (Marimin, 2004).
independently because of their different characteristics in their production each other includ ing different marketing target. Thus, to identify their position in home industry and medium scale industry sector, a quadrant matrix is a starting point.
3. Internal and External Factors
According to the statements in the Master Plan of Small and Medium Industry Development in 2002-2004 developed by MOI (2002), the followings are identified as the components of SWOT in the current UMKM in general. For the target home industry of tapioca in the research study, all factors should be identified by site sur vey and FGD.
1) Strengths (Internal)
(1) Basic commodity is easily available and obtained in local markets. (2) The basic skills have been possessed from generation to generation. (3) The availability of technology which is easily to be mastered or
transferred.
(4) The business can become a main business or means of livelihood of the local people.
(5) Supported by policy and programs from private and all government's apparatuses
2) Weaknesses (Internal)
(1) Still using and applying simple management, technology and equipment, so that it is less efficient.
(2) The quality of the products varies without any standardization. (3) Information access to the market is still limited
(4) The packaging do not meet technical requirement and unattractive to the consumers.
3) Opportunities (External)
(1) Quite large-domestic market segment
(2) The recovered economic foundation of Indonesia's macro economic. (3) The commodity can be developed for export market.
4) Threats/Challenge (External)
(1) Weak product competitive ability
(3) Unfavorable domestic business climate compared to other competitors' facilities.
(4) Government policy of increasing tariffs in various fields such as fuel price.
(5) Different interpretations on regional autonomy among the regions have caused the unfavorable business climate.
Ministry of Cooperation and SME also identified UMKM’s weaknesses, opportunities, and environment (Soetrisno, 2005).
1) Lack of access to productive resources, particularly financial 2) Business environment that creates high cost economy for UMKM
3) Limited internal capabilities of UMKM including technological aspect, management, and entrepreneurship
4) Lack of market access and more tight and un- fair competition 5) Supporting institutions which are not well developed
6) Most of the produc ts managed by UMKM are a primary product. 7) Low level of productivity, especially micro and small enterprises 8) Lack of access to financial source
9) Supporting infrastructures and institutions are not well developed.
According to the annual report by Sukaraja district (2005), the conditions of social and economic, and the current situations of all sectors are evaluated by SWOT.
1) Strengths
(1) Geophysical condition is an advantage closing to Bogor city and to access to Jakarta via highway of Jagorawi (Bogor- Jakarta).
(2) Because of this, fresh agricultural products are easily supplied to the consumers in Jakarta.
(3) The participation of the people concerned is very aggressive to the activities and programs provided by the local government of Bogor regency.
2) Weaknesses
(1) The common facilities are still in poor conditions such as accessing roads and educational facilities.
(2) The political and administrative hierarchy is not matured enough between the local government of Bogor regency and each one of the district.
(3) The implementation of the designated program and activities are not well managed for serving social and target people. It must be improved. (4) The quality of servicing performance to the society is not enough
satisfied. 3) Opportunities
(1) This district is located a good position closing to Jakarta and other surrounding cities.
(2) There are so many potential resources in this district that many investors might be interesting in the resources for their investment. (3) The possible market resources are also abundant not only in the district,
but also the other districts including overseas markets. 4) Threats
(1) Hike of tariff is the most concern affecting the price up on the 9 basic commodities such as rice, vegetable oil, flour, sugar, and others.
(2) Unstable conditions of economy subjects are a very threat for the district economic development.
(3) The policies by the central government and the regency are not stable and concrete always to the district.
(4) The old generation of the district people is getting older and older who is not productive power resource.
In addition to these mentioned in above, Eriyant (2001) identified the characteristics of UMKM from view points of their day to day implementation of UMKM under the current environmental conditions and their performance towards problems and issues.
tendency and changes of marketing, new technologies and technical information.
2) They do not have behaviors to keep the systematic records such as management, accounting, shipping, and marketing. Because of this, it is not easy job to borrow the capital from bank.
3) It is very difficult to access to the bank to procure the capital because they usually do not have the necessary mortgage.
4) Management is quite in poor related the operation of enterprise, material procurement, marketing, and cost management.
Current Issues and Problems
Advanced SSTA
Strategy Development SSTA
Conducive Programs Policy & Suppot
Research Target (Quality Assurance)
III. RESEARCH METHODOLOGY
A. Concept of Research Study
The target of the research is SSTA in order to improve capability and performance producing better Aci through quality assurance activities. Therefore, strategy development aims to strengthen SSTA through improvement on quality assurance of Aci in the processing cycle of cassava. It also aims at by making significant evolution in rural area and small scale industry sectors through the local government policy supports and conducive programs for future.
[image:45.596.140.487.377.505.2]To develop a strategy of quality assurance, the necessary steps are taken into place starting from SSTA’s subjects, for example, identifying the current conditions and issues, carrying out the strategy development study, identifying the components and factors for development of the conducive policies and programs for the advanced SSTA for future.
Figure 9 Concept of research study
B. Process of Problems and Issues
The processes and steps are implemented according to research site condition and availability of the target product. The approach of the research is initiated by identification of the conditions in terms of qualitative factors and quantitative components or parameter necessary for research analysis.
1. Trace problems and issues, and compile all data and information regarding material, processing, and marketing.
3. Develop alternatives for solution against the problems and issues based on the factor or group.
4. Identify the optimal strategy development to settle the problems and issues, and also to evolve SSTS more for future.
At first, a reconnaissance survey is carried out at the site in Bogor in order to grasp the total view of cassava producer and SSTA. At the same time, core data and information are also collected to review on the study process and methodology prepared, hypothesis proposed, and time schedule of implementation.
1. Reconnaissance survey in the target site and other related industries 2. Data and information collection by interview and questionnaire
3. Compilation and factor wise alignment of data and information collected 4. Identification the necessary factors to be analyzed
5. Analysis done by QFD, SWOT, and FGD
6. Implication of the results of QFD and the results of SWOT
Secondary, the identification of subject matters is taken into place to specify the problems and issues, method and application going on, collateral conditions, and barriers to quality assurance and the related subjects necessary for quality assurance and its improvement. The followings are a subject matter in this research study.
1. Identification of the problems and issues in the target area and target product of Aci
2. Specification of the processing methods including marketing taking account of quality assurance
3. Quality of Aci and tapioca specifying item- wise, and also physical and biochemical characteristics (properties)
4. Attributes of raw material (cassava) requirement and technical importance in processing by SSTA
5. Confirmation of the alternatives to be proposed regarding quality assurance
Start
Study on Problem and Issues in Agroindustry
Identification of Requirements and Priority
HOQ Matrix
Direction of Strategy
Recommendation and Suggestion
Completion Data Collection
Factor Identification
Formulation of Development Strategy
QFD
SWOT
FGD Field Survey
SWOT Matrix