CELLULAR AUTOMATA-MARKOV CHAIN
INDRIAN RIZKA AMALIA
GRADUATE SCHOOL
BOGOR AGRICULTURAL UNIVERSITY BOGOR
STATEMENT LETTER OF THESIS AND SOURCE OF
INFORMATION AND DEVOLUTION OF COPYRIGHT
Hereby I genuinely stated that the thesis entitled Modeling of Land Use Change of Paddy Field in Karawang Regency Using Cellular Automata-Markov Chain is an authentic work of my research supervised by supervisory committee and never being presented in any forms and universities. All the information taken and quoted from published or unpublished works of other writers has been mentioned in the texts and attached in the references chapter at the end of thesis.
I hereby assign the copyright of this thesis to Bogor Agricultural University.
RINGKASAN
INDRIAN RIZKA AMALIA. Model Perubahan Penggunaan Lahan Padi Sawah di Kabupaten Karawang Menggunakan Cellular Automata-Markov Chain. Dibimbing oleh WIDIATMAKA dan KHURSATUL MUNIBAH.
Konversi lahan padi sawah menjadi lahan pertanian lain dan lahan non pertanian merupakan salah satu faktor yang dapat mengancam ketersediaan beras di Indonesia. Salah satu yang merupakan daerah lumbung padi adalah Kabupaten Karawang dengan kontribusi kepada ketersediaan beras nasional sebesar 784 000 ton.tahun-1 (Center for Agricultural Data and Information System 2013). Namun Widiatmaka et al. (2013a) menunjukkan bahwa dalam satu dekade terakhir, persentase konversi lahan padi sawah sebesar sekitar 1.88% dan diprediksikan akan terus meningkat serta akan mengancam ketersediaan beras nasional. Oleh karena itu, prediksi kondisi padi sawah menjadi hal yang penting. Hasil dari prediksi ini akan membantu pemerintah atau pihak-pihak terkait dalam proses pengambilan kebijakan terhadap penataan dan penggunaan lahan di Kabupaten Karawang.
Tujuan umum dari penelitian ini adalah untuk memprediksi perubahan lahan padi sawah tahun 2024 di Kabupaten Karawang dengan model Cellular Automata-Markov Chain. Tujuan umum ini terdiri dari beberapa tujuan khusus: (1) menganalisis perubahan penggunaan lahan pada tahun 1994, 2004 dan 2014 di Kabupaten Karawang, (2) memprediksi penggunaan lahan pada tahun 2024 di Kabupaten Karawang. Penelitian ini terdiri dari empat prosedur yaitu (1) pemrosesan data penggunaan lahan dari citra Landsat tahun akuisisi 1994, 2004 dan 2014; (2) analisis kesesuaian lahan; (3) proses pemodelan, dan (4) pembangunan skenario model berdasarkan UU No 41 tahun 2009 tentang Perlindungan Lahan Pertanian Pangan Berkelanjutan dan Perda tentang Tata Ruang Kabupaten Karawang tahun 2011-2030.
Pada periode tahun 1994-2004, terjadi penurunan luas area dari pertanian lahan kering, hutan, padi sawah dan badan air sedangkan kenaikan luas area terjadi pada tambak dan lahan terbangun. Pada periode 2004-2014, terjadi penurunan luas area dari hutan dan padi sawah sedangkan pertanian lahan kering, tambak, lahan terbangun serta tubuh air mengalami kenaikan luas area. Hasil analisis pola perubahan lahan padi sawah periode 1994-2014 menunjukkan adanya kecenderungan konversi padi sawah menjadi lahan terbangun serta konversi padi sawah menjadi lahan kering lalu kemudian menjadi lahan terbangun. Prediksi penggunaan lahan pada tahun 2024 menunjukkan adanya penurunan luas pertanian lahan kering, hutan dan padi sawah sedangkan kenaikan luas area terjadi pada tambak, lahan terbangun dan badan air apabila dibandingkan dengan penggunaan lahan tahun 2014. Luas area lahan padi sawah pada tahun 2024 tanpa penerapan konservasi kesesuaian lahan; dengan konservasi area yang sesuai (S2); dan dengan konservasi area yang sesuai (S2) dan sesuai-marjinal (S3) adalah berturut-turut 93 349.58 ha, 93 355.79 ha dan 93 358.57 ha. Produksi beras pada tahun 2024 diprediksikan adalah sebesar 863 261 ton dengan cadangan beras (surplus) pada tahun 2024 adalah sebesar 517 577 ton atau menurun 28% apabila dibandingkan dengan cadangan beras pada tahun 2014 (723 572 ton).
INDRIAN RIZKA AMALIA. Modeling of Land Use Change of Paddy Field in Karawang Regency Using Cellular Automata-Markov Chain. Supervised by WIDIATMAKA and KHURSATUL MUNIBAH.
Paddy field conversion into non agricultural land or another agricultural land is one of factor that threat rice sufficiency in Indonesia. One of region as center of rice production is Karawang Regency with contribution for national rice supply at 784 000 ton.year-1 (Center for Agricultural Data and Information System 2013). However, Widiatmaka et al. (2013a) stated that in one last decade, paddy field conversion was at 1.88% and this percentage would higher in next years. The phenomenon of paddy field conversion will affect rice sufficiency both for regional and national consumption. Therefore, the prediction of future condition of paddy field is being important thus it will help government or related parties in regional policy making and application.
The general objective of this research is to predict land use change of paddy field in year 2024 in Karawang Regency by using Cellular Automata-Markov Chain model. The general objecitve consists of several objectives: (1) analyze land use change of year 1994, 2004 and 2014 in Karawang Regency, (2) predict the condition of land use of year 2024 in Karawang Regency. There were four procedures in this research which were (1) land use data processing of Landsat of year 1994, 2004 and 2014; (2) land suitability analysis; (3) modeling process; and (4) scenarios building based on Regional of Sustainable Land for Agricultural Food Crops No.41 of year 2009, and local government regulation about Regional Spatial Planning of Karawang Regency year 2011-2030.
The result showed that in the period of 1994-2004, there were decreasing of area on dryland farming, forest, paddy field and water body while the increasing of area were occured on fishpond and settlement. In the period of 2004-2014, there were decreasing of area of forest and paddy field while dryland farming, fishpond, settlement and water body had been increased. During period 1994-2014 the trend of change showed the tendency of paddy field conversion into built-up area, and paddy field conversion into dryland farming that would be converted next into built-up area. The result of predicted land use of year 2024 showed the decreasing area of dryland farming, forest and paddy field while fishpond, settlement and water body had been increased if it were compared to those in year 2014. The total area of paddy field in year 2024 with scenario BAU (business as usual) was 93 349.58 ha; scenario of preservation of S2 area was 93 355.79 ha; scenario of preservation of suitable area (S2) and marginal suitable area (S3) was 93 358.57 ha. Rice production would be predicted as 863 261 ton with surplus in year 2024 would be 517 577 ton or decrease about 28% compare to rice surplus in year 2014 (723 572 ton).
Copyright © 2015, Bogor Agricultural University
All rights reserved
Any unauthorized quotation of all contents or any part thereof is strictly prohibited. Citation is only for educational purpose, research, scientific writing, reports writing, critique and problem analysis; and citations would not give any disadvantage on behalf of Bogor Agricultural University.
A Thesis submitted for degree of Master of Science
in Information Technology for Natural Resources Management Study Program
MODELING OF LAND USE CHANGE OF PADDY FIELD IN
KARAWANG REGENCY USING
CELLULAR AUTOMATA-MARKOV CHAIN
GRADUATE SCHOOL
BOGOR AGRICULTURAL UNIVERSITY BOGOR
2015
Thesis Title : Modeling of Land Use Change of Paddy Field in Karawang Regency Using Cellular Automata-Markov Chain
Name : Indrian Rizka Amalia
NRP : G051110051
Approved by Advisory Board
Dr Ir Widiatmaka, DEA Supervisor
Dr Dra Khursatul Munibah, MSc Co-Supervisor
Endorsed by
Program Coordinator of Information Technology for Natural Resources Management Study Program
Dr Ir Hartrisari Hardjomidjojo, DEA
Dean of Graduate School
Dr Ir Dahrul Syah, MScAgr
Date of Examination: August 18, 2015
All praise to The Greatest Lord Allah SWT for giving me opportunity to accomplish my thesis. The success of this thesis would not have been possible without contributions and supports from many people in which I will not be able to mention each one of them.
I would like to express my heartfelt gratitude to Mr. Dr Ir Widiatmaka, DEA and Mrs. Dr Dra Khursatul Munibah, MSc as my supervisor and co-supervisor for their enormous help and guidance throughout the completion of my thesis, also Mr. Prof Dr Ir Kukuh Murtilaksono, MS for the exceptional advices. Last but not least, I would like to thank to my father, mother, brother, sisters and my entire family also my college friends in Bogor Agricultural University and Brawijaya University for all pray, supports, and encouragement.
Hopefully, this thesis could give positive contribution to society and increase knowledge to readers.
Bogor, August 2015
Indrian Rizka Amalia
.
TABLE OF CONTENTS
LIST OF TABLES vi
LIST OF PICTURES vi
LIST OF APPENDIX vi
1 INTRODUCTION 1
Background 1
Problem Formulation 2
Objectives 2
Benefits 2
2 LITERATURE REVIEW 3
Land Use Change Modeling 3
Markov Chain Concept 3
Cellular Automata Concept and Application 5
3 METHOD 8
Research Conceptual Flowchart 8
Date and Location 8
Procedures 9
4 RESULT AND DISCUSSION 15
Land Use Dynamics of year 1994, 2004 and 2014 15
Land Suitability Analysis 20
CA-Markov Model Validation 22
CA-Markov Model Performance 25
5 CONCLUSION 31
Conclusion 31
Recommendation 31
REFERENCES 31
LIST OF TABLES
1 The example of transition probability matrix 5
2 Matrix relational of objectives, analysis and output 10
3 Land suitability of paddy field 12
4 Criteria of land suitability for dry land farming 12 5 Criteria of land suitability for brackish water fishpond 13 6 Criteria of land suitability for built-up/built-up area 13
7 Criteria of land suitability for forest 13
8 Land use dynamics change of year 1994, 2004 and 2014 18 9 Transition probability matrix of year 1994-2004 (TPM1994-2004) 23
10 Kappa validation of model 24
11 Transition probability matrix of year 2004-2014 (TPM2004-2014) 26 12 The total of each land use in year 2024 based on model scenario 28 13 The comparison between rice production and consumption in year 2024 30
LIST OF PICTURES
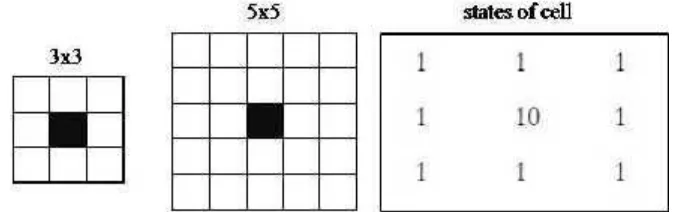
1 Filter size 3x3; filter size 5x5; states of cell (Eastman 2003) 7
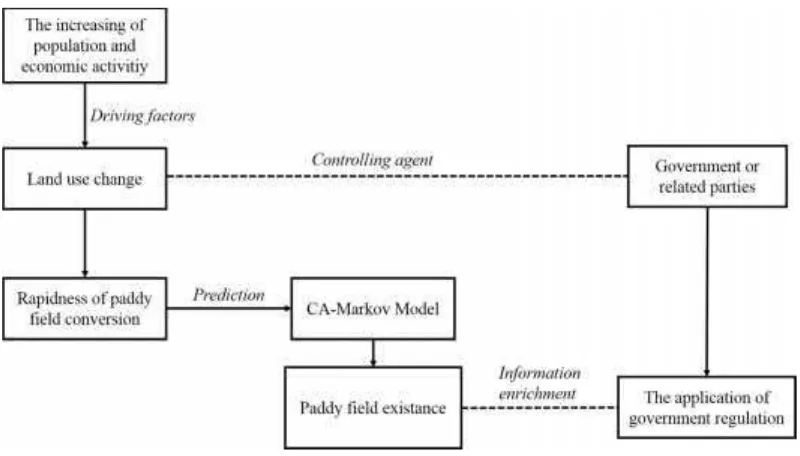
2 Research conceptual flowchart 8
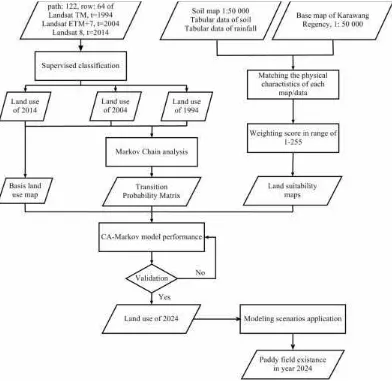
3 Research operational flowchart 9
4 Land use map of year 1994 15
5 Land use map of year 2004 16
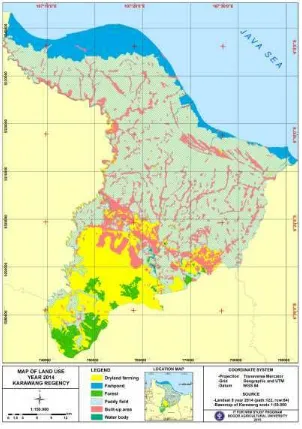
6 Land use map of year 2014 17
7 Land use dynamics change of 1994, 2004 and 2014 18
8 Land use change distribution year 1994-2004 19
9 Land use change distribution year 2004-2014 20
10 Rasterized of land suitability map 21
11 Land suitability of paddy field based on scenarios 22
12 Result of model validation at each iteration 23
13 Kappa value and time duration of model performance at each iteration 24 14 Predicted land use of year 2024 (Business As Usual) 26
15 Predicted land use of year 2024 (Scenario 1) 27
16 Predicted land use of year 2024 (Scenario 2) 28
17 Projection of population in Karawang Regency 30
LIST OF APPENDIX
PICTURES
1 INTRODUCTION
Background
Land is important resource in human life, because it is a base for many human activities such as built-up area, animal husbandry, forestry, agriculture, transportation and recreation (Xieet al. 2005). The use of land usually coupled with urbanization and economical condition, and it becomes dominant factors of land conversion. Land conversion which leads land use change is driven by the interaction between biophysical and human dimensions (Veldkamp and Verburg 2004) which sometimes give bad impact to ecosystem (Rahdaryet al. 2008). One of the factors of land use change is urbanization, as the implication of city growth, industrial, residential and commercial use. As population increase, the proportion of urbanization will also increase and it will affect the dynamic of land use change (Jenerette and Wu 2001). One of consequence of rapid urbanization and population growth is the loss of agricultural land (Xie et al. 2005). Land conversion from agricultural into built-up area is one of factor which threat food security in Indonesia. There are some factor influences in agricultural land conversion, such as government policy in Urban Land Use Plan (Rencana Tata Ruang Wilayah), industrial growth, population growth which is related with built-up area (Apriyana 2011) and land owning (Sudaryanto and Rusastra 2006).
It is estimated that loss of agricultural land in Indonesia more than 150 000 ha year-1 (Apriyana 2011). During period of 1999-2002, land conversion in agriculture sector is 187 720 ha year-1which consists of 110 164 ha land conversion into non agriculture and 77 556 ha land conversion into horticulture (Septianaet al. 2013). Sudaryanto and Rusastra (2006) stated that loss of agricultural land will cause deficit in regional income about 15% or 27.7 million USD. In Indonesia case, discussion of agricultural land conversion is mainly related to paddy field conversion, as it is staple food for most Indonesian people. The total area of paddy field in Indonesia is decreasing each year more than 1 000 000 ha in the period of 2008-2012 (Center for Agricultural Data and Information System 2013).
The development of Karawang as industrial area and its geographic location close to capital city of Jakarta induces a quick rural development of Karawang Regency. This condition may lead into decreasing of rice production and the ability of Karawang Regency to fulfill its own food sufficiency. The prediction towards future development and extension of paddy field is necessary especially for government and urban planner in order recommend proper regulation to protect food sustainability. Future condition of land use in general can be predicted through modeling. The models of land use change can be developed through Remote Sensing and GIS at macro-scale (Veldkamp and Verburg 2004), integrated with Cellular Automata-Markov Chain (Xieet al. 2005). The approach of this model is to simulate spatial patterns of land use change at a temporal resolution (Jenerette and Wu 2001). The predicted condition of land use that is modeled by Cellular Automata-Markov Chain will simulate future change of agricultural land in Karawang Regency. The prediction result hopefully will give another point of view to related parties towards the condition of land use and preservation of paddy field in future years.
Problem Formulation
The problem formulation of this research is considered from the rapidness conversion of paddy field in Karawang Regency, while in other hand, Karawang Regency is one of center of rice production for West Java and contribute not only for its internal consumption but also external (other region) consumption. The increasing of another land usage such as dryland farming, plantation and built-up area are assumed to be one of factor that induces paddy field conversion with regards on the increasing of opulation, social and economic. Karawang Regency is both agricultural and industrial region, thus it is predicted that the rate of paddy field conversion will be higher. This condition will threat the existance of paddy field in future years and affect the fulfillment of rice consumption both in Karawang Regency and other region.
Objectives
The general objective of this research is to predict land use change of paddy field in year 2024 in Karawang Regency by using Cellular Automata-Markov Chain model. The general objective consist of several objectives which are:
1. Analyze land use change of year 1994, 2004 and 2014 in Karawang Regency 2. Predict the condition of land use of year 2024 in Karawang Regency
Benefits
2 LITERATURE REVIEW
Land Use Change Modeling
Land use change models are tools for understanding the causes and the implication of land use dynamics. Models of land use change can help land use planning, thus it is possible to informed land use projection as part of decision. Land use change model can represent the complexity problem in real world and by using integrated geographic information system, the model can be spatially understood. Spatial information from model gives high quality information for public decision maker, thus the arrangement and evaluation of decision will be more qualified (Veldkamp and Lambin 2001). Briassoulis (2000) noted that the use of models in land use planning is defined as decision support, explanation, prediction, impact assessment and prescription. Land use change model assess and project the future role of land use and land cover in the functioning of earth system under some scenario conditions (Veldkamp and Lambin 2001). The awareness of change is essential in order to get better overview and understanding about landscape dynamic of known period and time. Understanding the landscape patterns, the changes, interaction between human and nature or spatial interaction become important factors in modeling land use change and for decision making (Rahdaryet al. 2008; Veldkamp and Lambin 2001). There are six factors considered important in modeling land use change i.e level of analysis, cross-scale dynamics, driving factors, spatial interaction and neighborhood effects, temporal dynamics and level of integration (Veldkamp and Verburg 2004). One of method that relates all of those factors is Cellular Automata to simulate multiple land use types (White and Engelen 2000).
Markov Chain Concept
Markov Chain is approach in order to get transition probability matrix from past periods of land use to predict land use in future periods. Cellular Automata arises in iterative part of land allocation and in part of cell filtering stage 5x5 where neighborhood influences are considered (Eastman 2003). Probability is generated from past changes, to be applied to predict future changes. Markov Chain can be divided into two steps such as to obtain transition probability matrix of various land use types in detailed information about inter-class transition among different land use types, and to predict land use based on probability values which result is temporal predict information (Fan et al. 2008). Markov Chain is defined as stochastic process which its properties at timet,Xtdepends on its value at time
t-1,Xt-1. The equation is showing the transitional probability that gives the probability
on process, makes transition from state ai to stateaj in one time period, as follow
(Weng 2002):
The main factor in Markov Chain is transition probability, a conditional probability for system to undergo transition to new state and gives current state of the system. Tang et al. (2007) explained that input information in Markov Chain equation is land use distribution at the beginning time and the end of a discrete time period. Transition matrix is representing the changes among two land use occurred during that period. The changing happened in two different land use will form transition matrices. Mondal and Southworth (2010) denotes that transition probability can be illustrated as Pij where it shows the probability of each class
changing to every class or remaining the same from time stepito time stepj. Ozah et al.(2007) explained a homogenous Markov Chain has properties as following:
• For each time period, every object in systems is in exactly one of defined states
• Objects move from one state to next state according to transition probabilities which depend only on current state (previous history is not being considered)
• Transition probabilities do not change over time
Ozahet al.(2007) explained that Markov Chain can be used to predict future matrix of vector (tn) based on past matrix of vector (t1) by transition probability
matrix, while transition probability matrix is derived from probability changing between past matrix vector and previous (t1andt0).
=
n = number of time steps m = number of states
=vector initial states at an initial timet = vector of states at the next timet+1 P = transition probabilities matrix
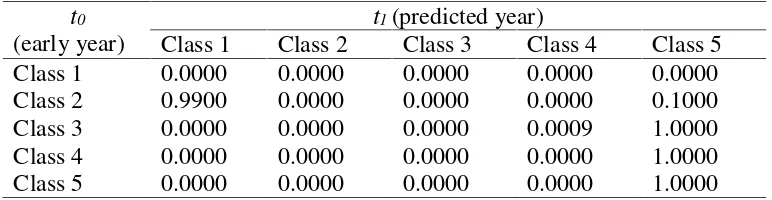
The result from Markov Chain is transition probability matrix from time one (t0) to time two (t1) which will be the basis for projecting future time period.
Cellular Automata Concept and Application
Cellular Automata (CA) is one of application in spatial dynamics modeling that mainly in land use change simulation (White and Engelen 2000). The approach of CA is not only deal with the dynamic process modeling but also provides the decision making processes. Significant properties of Cellular Automata is its simplicity, thus there are many problem that can be approached by cellular structure and rules such as spatially complex systems (e.g.: landscape processes), modeling in space and time (e.g. ecological systems, population dynamics) and emergent phenomena (e.g. evolution, earthquakes). Cellular Automata can simulate the dynamic processes spatially, affinity with Geographic Information System (GIS) and Remote Sensing (RS) technique (Veldkamp and Lambin 2001). The integration between CA, GIS and RS can gives sophisticated result to model land use change, since the basis work of them is the same type of raster data (Fanet al.2008)
Cellular Automata model is embedded on landscape rasterized into discrete cells. Each time of step, current state of each individual cell is updated based on rules (deterministic or probabilistic) which are dependent on focal cell and neighboring cells (Jenerette and Wu 2001). Set of identical elements of cells is located in regular and discrete space. Each cell associates with state and form a finite set. In discrete time steps, the model changing the states of its entire cell as the transition rule, homogeneously applied at every step. The new state of cells is depends on the previous state of cells (Fan et al. 2008). Cellular Automata are neighborhood based cell while transition between it is determined by states in its neighborhood and probability transition. Standard cellular automaton can be defined as function that defines change of state from time past time to future and influenced by neighborhood of all cells (Li and On Yeh 2001). Cellular Automata as modeling approaches has basic elements comprises of series of cells or grid, set of local states, a neighborhood and transition rules. Samat et al. (2011) define Cellular Automata state as follow:
Table 1 The example of transition probability matrix t0
(early year)
t1(predicted year)
Class 1 Class 2 Class 3 Class 4 Class 5
Class 1 0.0000 0.0000 0.0000 0.0000 0.0000
Class 2 0.9900 0.0000 0.0000 0.0000 0.1000
Class 3 0.0000 0.0000 0.0000 0.0009 1.0000
Class 4 0.0000 0.0000 0.0000 0.0000 1.0000
, = ( , . , . , , , . , )
Where:
. = states of celli,jat early time
, = the potential of celli,jto change at timet+1of predicted cell , = states of celli,jat timetof actual cell
, = suitability indexes of celli,jat timet
, , , = probability of celli,jto change from statexto stateyat timet , = neighborhood index of celli,j
As stated by Samat et al. (2011), one of important rule in CA concept is transition rules. The transition rules can be approximated with Markov Chain. The research from Munibah (2008) used the integration between CA-Markov which it is first originally presented by Eastman (2003). Decision rules in CA-Markov can be explained by two rules (Munibah 2008):
Decision rule 1: explains about suitability score in center pixel where neighborhood pixels also influent same suitability condition with center pixel. If decision allows it then land use type of center pixel is remain the same otherwise it will enterDecision rule 2.
Decision rule 2: explains about the change in center pixel as if (a) it has highest score:1sthighest, 2ndhighest,….n, (b) the neighborhood pixels has the same suitability score with center pixel. If decision allows it then the center pixel will has more probability to be changed to other land use type. The final decision is decided by the Transition Rules from Markov Chain result. If the probability of change is high then the central cell will be changed into other land use type. Otherwise, the center cell will stay the same, or going back to Decision rule 1 to recalculate the other possibilites of change.
There are several factors involved in Cellular Automata model such as Transition Probability which is from Markov Chain, Suitability factors and Neighborhood influences. The explanation of those factors explained as follows:
1. Suitability Indexes
2. Neighborhood Indexes
Cell neighborhood influences plays important rule in Cellular Automata model. If neighborhood influences is high then the probability of central cell (in filter) to be changed or to be selected is also high (Li and On Yeh 2001). Neighborhood influences is moving inside cell filtering size of 3x3 (Moore Neighborhood) or 5x5 (Extended Moore Neighborhood) (Figure 1) (Samat et al. 2011; Munibah 2008). The process in neighborhood cells is considering a change in central cell (black) according to state and rule in surrounding cells (white) (Figure 1). Eastman (2003) explained the influence of neighborhood cells through the case of Conway’s Game of Lifewhere there are some rules:
- An empty cell becomes alive if there are three living automata in 3x3 neighborhood surrounding cell.
- The cell will stay alive as long as there are 2 or 3 living neighbors. Less than that, the cell will die from loneliness, but more than that, the cell will do competition to gain resources.
3 METHOD
Research Conceptual Flowchart
The issue pointed in this research was the rapidness of paddy field conversion into non-paddy field i.e. because of the increasing of population and the economic acitivity (Figure 2). The rapidness of paddy field conversion will affect the availability of rice, as it is staple food for most Indonesian people. The availability of rice has connected with rice sufficency where Karawang Regency not only fullfill its internal consumption but also external consumption by other region. The condition of paddy field in future year will become main topic in this research since this condition may affect the food security in Indonesia. Towards this issue, the prediction of paddy field existance by using CA-Markov becomes important.
The government as controlling agent has policy in zoning, protecting and regulating paddy field and its conversion through Regulation of Sustainable Land for Agricultural Food Crops No.41 of year 2009, and Regional Spatial Planning of Karawang Regency period 2011-2030. Hopefully the prediction result can support the application of government regulation or related parties, and also enrich the information towards the trend of land use change generally and paddy field especially in Karawang Regency.
Date and Location
Research was conducted from April 2014-May 2015. Study area was in
Karawang Regency located at 107°02’-107°40’ E and 5°56’-6°34’ S. Data
processing, CA-Markov model processing and result analysis was conducted in Laboratory of GIS/RS, Study Program of Information Technology for Natural Resources Management, Bogor Agricultural University.
Procedures
There were four main procedures in this research such as: (1) Data Image Processing, (2) Land Suitability Assessment, (3) CA-Markov Chain Model, (4) Modeling Scenarios Application (Figure 3). The procedures in this research has been correlated with research objectives, data necessities and expected output (Table 2).
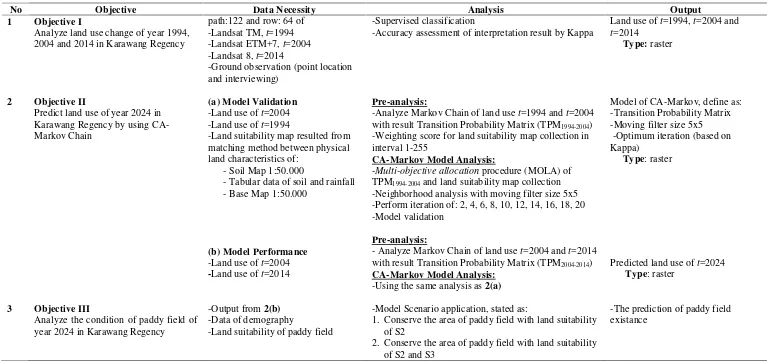
Table 2 Matrix relational of objectives, analysis and output
No Objective Data Necessity Analysis Output
1 Objective I
Analyze land use change of year 1994, 2004 and 2014 in Karawang Regency
path:122 and row: 64 of
-Accuracy assessment of interpretation result by Kappa
Land use oft=1994,t=2004 and
t=2014
Type:raster
2 Objective II
Predict land use of year 2024 in Karawang Regency by using
CA-- Tabular data of soil and rainfall - Base Map 1:50.000
(b) Model Performance
-Land use oft=2004
-Land use oft=2014
Pre-analysis:
-Analyze Markov Chain of land uset=1994 andt=2004 with result Transition Probability Matrix (TPM1994-2004) -Weighting score for land suitability map collection in interval 1-255
CA-Markov Model Analysis:
-Multi-objective allocationprocedure (MOLA) of
TPM1994-2004and land suitability map collection
-Neighborhood analysis with moving filter size 5x5 -Perform iteration of: 2, 4, 6, 8, 10, 12, 14, 16, 18, 20 -Model validation
Pre-analysis:
- Analyze Markov Chain of land uset=2004 andt=2014 with result Transition Probability Matrix (TPM2004-2014)
CA-Markov Model Analysis:
-Using the same analysis as2(a)
Model of CA-Markov, define as:
Predicted land use oft=2024
Type: raster
3 Objective III
Analyze the condition of paddy field of year 2024 in Karawang Regency
-Output from2(b)
-Data of demography
-Land suitability of paddy field
-Model Scenario application, stated as:
1. Conserve the area of paddy field with land suitability of S2
2. Conserve the area of paddy field with land suitability of S2 and S3
1. Data Image Processing
Landsat satellite imageryt=1994,t=2004 andt=2014 were being corrected in radiometric aspect and geometric aspect by rectify/resampling pixel position in image, and geo-referencing the image into the selected projection system. Optical band of imageries had 30 m of resolution. Satellite imageries was interpreted by supervised classification with Maximum Likelihood method. There were several characteristics in interpretation such as tone, pattern, texture, shape, size, shadow and association. Accuracy assessment was being conducted by Kappa coefficient
(к) for accuracy assessment which relies on image training area.Training area was deliniation based on ground observation with 60 samples of training area with random sampling method. Kappa Accuracy mathematically can be measured as follow where maximum value of coefficient is 1 (Liu and Mason 2009):
к = ∑ − ∑ − ∑ Where:
Cii = value of diagonal matrix of contingency from row-iand column-i
Nri = sum of pixel in row-i
Nci = sum of pixel in column-i
N = total number of pixels
Ground observation was important in order verify image interpretation result. Data from ground truth will increase the total image interpretation/classification accuracy (Liu and Mason 2009). Ground truth also occurred to collect field data such as area observation and interviewing local people about historical trend of previous land usage.
2. Land Suitability Assessment
Land suitability assessment in this research based on physical characteristic. Land suitability was analyzed for land use considering several uses. The approach for land suitability was by matching each land characteristics with suitability classes. Classification structure for land suitability in this research based on FAO criteria consist of S1 (very suitable), S2 (suitable), S3 (marginal suitable), N (not suitable) (Djaenudin et al. 2011). Criteria of S1 is defined as land which has no significant limiting factor that will affect land productivity; S2 is defined as land which has few limiting factor that will affect land productivity; S3 is defined as land which has more limiting factor than S2 that will affect land productivity where to overcome the limiting factor needs more effort and cost; N is defined as not suitable land because of difficulties in overcome the limiting factors (Ritunget al 2007).
production (Wood and Dent 1983). There were 6 land use classes in this research such as paddy field, dry land farming, fishpond, forest, built-up area (Table 3, Table 4, Table 5, Table 6, Table 7).
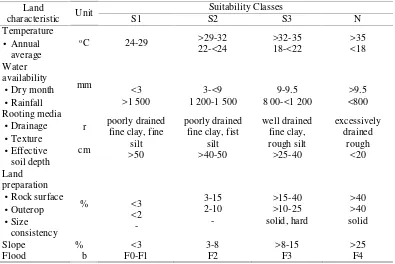
Table 3 Land suitability of paddy field
Land
Slope % <3 3-8 >8-15 >25
Flood b F0-F1 F2 F3 F4
Source: Djaenudinet al.(2011).
Table 4 Criteria of land suitability for dry land farming
Land
characteristic Unit
Suitability Classes
S1 S2 S3 N
Effective soil
depth cm >75 >50-75 >25-50 ≤25
Soil texture fine clay, fine
Elevation m asl ≤500 >500-750 >750
-Slope % 0-8 >8-15 >15-40 >40
Effective soil
depth cm >75 >50-75 >25-50 ≤25
Soil texture - fine clay, fine
Table 5 Criteria of land suitability for brackish water fishpond
Land
characteristic Unit
Suitability Classes
S1 S2 S3 N
Elevation m asl 0-10 >10-20 >20-30 >30
Distance from
Existing landuse - Fishpond - - built-up area
Source: Widiatmaka and Hardjowigeno (2007) with modification.
Table 6 Criteria of land suitability for built-up/built-up area
Land characteristic Unit Suitability Classes
S1 S2 S3 N
Slope % 0-15 >15-25 >25-40 >40
Distance from river
ordo 1&2 m - - - ≤100
Distance from street m 0-500 >500-1000 >1000
-Source: Widiatmaka and Hardjowigeno (2007) with modification.
Table 7 Criteria of land suitability for forest
Land
characteristic Unit
Suitability Classes
S1 S2 S3 N
Elevation m
asl >2000 >1000-2000 ≤1000
-Distance from
river ordo 1&2 m ≤100 - -
-Distance from
shoreline m ≤100 - -
-Slope % >45 - -
-Existing landuse - Forest - - Built-up area, water
body Source: Widiatmaka and Hardjowigeno (2007) with modification.
3. Cellular Automata-Markov Chain Model
Inputs for Markov Chain were:
1. Land use image oft1=1994;t2=2004;t3=2014
2. Defining number of time periods betweent1andt2;t2andt3
Outputs from Markov Chain analysis were:
1. Transition probability matrix (TPM) which express probability of each land use category that will change to every other category.
2. Transition areas matrix which express the total area (number of pixels) which expected to change in next period.
3. A set of conditional probability images which express the probability that each pixel will belong to the designated class in next period.
Inputs for Cellular Automata model were: 1. Basis land use image oft3
2. Transition Probability Matrix (TPM1994-2004or TPM2004-2014) 3. Land suitability
4. Defining the moving filter size as 5x5 where central pixel where this filter will move and weighted the pixel one by one.
5. Defining iteration of model: 2, 6, 8, 10, 12, 14, 16, 18, 20 Outputs from Cellular Automata analysis were:
1. Predicted of land use oft=2014
Firstly, CA-Markov modeling was conducted in order to validate the model at various iteration. Validation was conducted by assessing predicted land uset=2014 with actual land uset=2014 using Kappa Accuracy assessment.
2. Predicted of land use change in future yearst=2024
Secondly, CA-Markov modeling was conducted to predict land uset=2024 by using iteration that had optimum accuracy result based on model validation. The result of predicted land use then was used to analyze future condition of land use generally and paddy field especially in Karawang Regency.
4. Modeling Scenarios Application
The scenario was defined to direct the flow of simulation and help model to define its goal. Scenarios were constructed based on Regulation of Sustainable Land for Agricultural Food Crops No.41 of year 2009 and Regional Spatial Planning of Karawang Regency period 2011-2030.
Scenarios of modeling were stated as:
Scenario 1: Conserve the area of paddy field with land suitability of S2 for paddy field in future years.
4 RESULT AND DISCUSSION
Land Use Dynamics of year 1994, 2004 and 2014
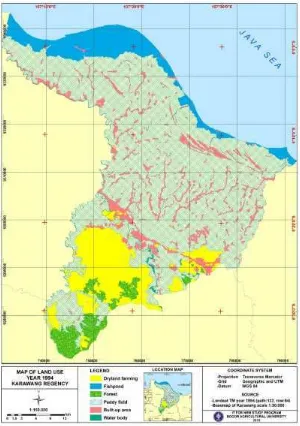
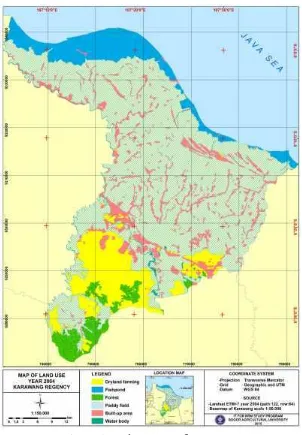
Result of satellite image interpretation indicate six land uses which were dryland farming, fishpond, forest, paddy field, built-up area and water body (Appendix 1) with the Kappa accuracy from this interpretation was 85.16%. The result of image interpretation of 1994, 2004 and 2014 showed different trend of land use (Figure 4, Figure 5, Figure 6). The different trend of land use was influenced by the dynamics of socio-economic activities due to population increasing each year in Karawang Regency. Generally, during period of 1994-2014, there were some of land uses which had increased (Figure 7) while some others had decreased.
During the periods of 1994-2004, the area of dryland farming, paddy field and forest had decreased while fishpond, built-up area and water body had increased. Dryland farming had decreased at 0.61%, followed by paddy field which was decreased at 0,69% and forest which was decreased at 0.02% (Table 8). The decreasing area of those three land use was in line with the increasing of other land use which were fishpond, built-up area and water body. Built-up area had the highest increasing at 39.98%, followed by fishpond which was increased at 1.05% and water body which was increased at 0.01%. During the periods of 2004-2014, the area of dryland farming had increased at 19.29% whereas in the previous years decreased at 2.95% (Table 8). The area of built-up area had increased at 4.58% and higher 6% than 10 years previously. The area of fishpond had increased slightly each at 0.12%. Forest and paddy field had decreased each at 0.58% and 7.06%. The result of land use dynamics showed that paddy field decrease in each year and probably this condition will continue in future year. Wulandari et al. (2008) explained that rate of paddy field conversion in Karawang Regency was average at
0.046% each year from 1995-2011 with low conversion rate less than 0.02% occured in 1998, 2000 and 2007. The loss of paddy field gives bad impact not only in food self-sufficiency but also in greater term of economic. Besides for food production, paddy fields also provides multi-functionalities i.e. flood control, groundwater recharge, soil erosion control, water quality purification, air purification and cooling, wildlife habitat and social benefits. The value of this multi-functionalities is estimated more valuable than the value of rice production itself (Yoon 2009).
Changes in land use implied by its distribution. Distribution change between land use in 1994-2004 (Figure 8) and 2004-2014 (Figure 9) were cross tabulated to determine relative frequency of each landcover class that changed into other classes during period of time (Eastman 2015). Cross tabulation matrix as a core tool for categorical map compared two categorical variables by tables, one variable in row and other in columns to assess two maps relation in the terms of quantity (Pontius and Millones 2011). Cross tabulation results showed image of change allocation and frequencies classes which had remained the same shown in frequencies along the diagonal whereas changed classes shown in off-diagonal frequencies. Crosstabulation result shows a kappa index of agreement between the two maps both in an overall sense and on a per-category basis (Pontius 2000).
Figure 7 Land use dynamics change of 1994, 2004 and 2014
0
Table 8 Land use dynamics change of year 1994, 2004 and 2014
Land Use 1994 2004 2014
ha % ha % ha %
Dryland farming 24 462.68 12.78 23 305.46 12.17 28 946.83 15.12
Fishpond 17 917.31 9.36 18 403.51 9.61 18 625.55 9.73
Forest 7 733.55 4.04 7 690.61 4.02 6 580.80 3.44
Paddy field 123 666.10 64.60 122 345.37 63.91 108 835.08 56.85
Built-up area 16 484.26 8.61 18 499.95 9.66 27 256.63 14.24
The result showed that distribution change of land use in period 2004-2014 was more dynamic than it occured at period 1994-2004. In the period of 2004-2014, almost all of land uses had been changed. Paddy field had changed dynamically both in period 1994-2004 and 2004-2014. It implied that paddy field was easily converted into other land uses. As stated by Widiatmakaet al.(2013a), paddy field and built-up area are two land categories which have high rate conversion. Paddy field conversion seemed to be persistent, can not be restored immediately and tend to irreversible. Moreover, government strategy for paddy field extensification requires abundance preparation and will take long periods besides the lackness of land availability (Irawan 2005), and it makes agricultural land preservation is necessary important.
Land Suitability Analysis
Land suitability map as the input for model were a collection of land suitability of fishpond, forest, dryland farming, built-up area, paddy field and map of water body existing (Figure 10). Each of land use suitability was given with score, range from 1-255 based on criteria. Land suitability also used as the basis decision making for model scenario with assumption that land suitability was the ideal condition for gaining optimum production. There were two scenario that is first scenario was the preserving of suitable area (S2), and second scenario was the preserving of suitable area (S2) and marginal-suitable area (S3) (Figure 11).
The scenario was aimed to analyze the condition of future paddy field existence towards the probability of its conversion into other land uses. The scenario assumed that other land uses except paddy field will change following the model while paddy field will be restricted only with the scenarios. These scenarios considered the application of government regulation about agricultural area preservation in order to maintain food sustainability and food sufficiency.
CA-Markov Model Validation
Modeling phase were consists of Markov Chain and Cellular Automata. First, Markov Chain was conducted on land uset=1994 and t=2004. Markov Chain was based on the probability of changes occurred between 1994 and 2004. The result of
Markov Chain’s transition matrix seen as probability index and number of cells
expected to be transitioned int=2014 (Table 9) ortransition probability matrix of year 1994-2004 (TPM1994-2004). Transition probability matrix was then used as one
of input for model. Based on transition matrix result, paddy field might change into dryland farming, fishpond and built-up area. The probability of paddy field conversion into built-up area was higher than fishpond or dryland farming and it showed the trend of paddy field change in period 1994-2004. In case of dryland farming, the probability of change was high on built-up area comparing to other land uses. It also showed the trend of change of land use in period 1994-2004.
In period of 2008-2012, the statistics data showed that total area of paddy field in Karawang was stable but tend to increase (Center for Agricultural Data and Information System 2013). Towards this issue, the government has promote the extensification program. The target of this program is to mantain rice sustainability and cover up its loss. The extensification program will be conducted in two period with target 374 125 ha. The aim of this strategy is to mantain food security in Indonesia in future years (Panudjuet al.2013).
The first model was conducted to predict land use of 2014 and validate it with actual land use of 2014 by Kappa. This step was aimed to assess model validation by comparing Kappa value at each iteration. Iteration which was used in this model were 2, 6, 8, 12, 14, 16, 18, 20 (Figure 12). The optimum iteration for model was decided by considering Kappa value and duration of model performance. Based on Kappa Standard at grid 1:1 and 10:10 (grid of comparison map compare to grid of reference map) and also duration of model performance, the optimum iteration for model was obtained at (i)= 8 (Figure 13).
Table 9 Transition probability matrix of year 1994-2004 (TPM1994-2004)
Probability of changing to: Dryland
farming Fishpond Forest Paddy field
Built-up
area Water body
Dryland farming 0.8042 0.0000 0.0000 0.0007 0.1951 0.0000
Fishpond 0.0000 0.8800 0.0000 0.0600 0.0300 0.0300
Forest 0.0000 0.0000 0.9953 0.0047 0.0000 0.0000
Paddy field 0.0189 0.0566 0.0000 0.8406 0.0817 0.0022
Built-up area 0.0000 0.0000 0.0000 0.0000 0.9990 0.0010
Water body 0.0000 0.0000 0.0000 0.0000 0.0010 0.9990
Kappa Standard of predicted mapt=2014 and actual mapt=2014 was 0.877 ati=8. The K-no expressed the successful of simulation to specify quantitiy of pixel of categories accurately with value of 0.91 and K-location showed the ability of simulation to specify location perfectly with value of 0.90. Disagreement quantity and disagreement grid cell were low (0.01 and 0.05) which means that comparison and reference map had successed in specify locations per grid and quantity for each class/category. Consistency of kappa validation could be seen through different grid resolution. Value of Kappa Standard among resolution 1:1 and 10:10 did not gave much different (0.8776 and 0.8773) which means that Kappa result was consistent (Table 10). Kappa showed the chance of agreement between two maps with the highest value is 1, thus the value of less than 1 means low similiarities among two maps.
Figure 13 Kappa value and time duration of model performance at each iteration
Table 10 Kappa validation of model
Validation Grid 1:1 Grid 10:10
Kappa Standard 0.8776 0.8773
K-no 0.9137 0.9140
K-location 0.9002 0.9007
Disagreement in quantity 0.0152 0.0152
Disagreement in grid cell 0.0588 0.0566
Agreement in quantity 0.2528 0.2500
Many researches believe that accuracy of land use prediction is in accordance with accuracy of reference land use (Ahmedet al. 2013; Ahmed B and Ahmed R 2012). Trisasongkoet al.(2009) explains that validation of model should be≤ 0.85, as the lowest value for arbritary map is measured 0.15. Pontius (2000, 2002) explains that Kappa standard does not give proper information anymore about two images similiarities although many scientist still do not accept this concept globally, therefore, Kappa standard is still used in many research and popular as well-recognized map comparison index. Pontius (2002) offers that the important accuracy is not only relies on Kappa but also the sum of agreement and disagreement on each grid along with its quantity. Measurement of quantity component of agreement and disagreement allocation are more useful to summarize cross tabulation matrix than various Kappa indices (Pontius and Millones 2011). Ahmedet al.(2013) assess the model validation for three land change modeler and use not only Kappa Standard as comparison index but also components of disagreement and agreement of grid cells. Disagreement and agreement indicate how well comparison map agrees with reference map (Pontiuset al.2007) thus high value of agreement is preferable.
CA-Markov Model Performance
The Prediction of Land Use in Year 2024 and Modeling Scenarios Application
Land use of year 2024 was predicted by using land use of year 2014 as basis land use image (Figure 14) and TPM2004-2014as transition probability matrix (Table 11). The value of TPM2004-2014 showed the increasing probability of conversion of paddy field into built-up area at 0.1162 while in TPM1994-2004, the probability of changing was 0.0817. The same condition also occured in paddy field conversion to dryland farming in TPM2004-2014, where there was increasing probability at 0.1230 while in TPM1994-2004 was at 0.0189. The probability of change among dryland farming to built-up area of TPM1994-2004and TPM2004-2014 was not much different, where in TPM1994-2004 at 0.1951 and in TPM2004-2014 at 0.2300. The transition probability matrix or TPM was showing the trend of change of each land use categories, and in paddy field case both period 1994-2004 or 2004-2014, the main conversion was to be dryland farming and built-up area, while dryland farming itself tend to be changed into built-up area. Based on land use change dynamic analysis, the trend of change of paddy field in Karawang Regency during 1994-2014 then could be explained as:
Paddy fielddryland farmingbuilt-up area Paddy fieldbuilt-up area
and forest while fishpond, built-up area and water body would increase. Among other land uses, paddy field had the highest area but the most dynamic change as it decreased about 15 485.50 ha compared to paddy field in year 2014.
Table 11 Transition probability matrix of year 2004-2014 (TPM2004-2014)
Probability of changing to: Dryland
farming Fishpond Forest Paddy field
Built-up
area Water body
Dryland farming 0.7699 0.0000 0.0000 0.0000 0.2300 0.0000
Fishpond 0.0000 0.8500 0.0000 0.1500 0.0000 0.0000
Forest 0.2476 0.0000 0.7524 0.0000 0.0000 0.0000
Paddy field 0.1230 0.0040 0.0000 0.7558 0.1162 0.0010
Built-up area 0.0000 0.0000 0.0000 0.0000 1.0000 0.0000
Water body 0.0000 0.0000 0.0000 0.0000 0.0000 1.0000
The result from first modeling scenario showed that total area of paddy field of first-scenario was the lowest while second-scenario was the highest (Table 12). Total area of paddy field of second-scenario was 93 358.57 ha increased about 8.99 ha compare to non-scenario and 2.78 ha compare to first-scenario. The results from scenarios of model showed that the preservation of only suitable area (S2) would not present large area of paddy field. However, the preservation of both suitable (S2) and marginal-suitable area (S3) would present large area of paddy field compare to its which not be preserved. The condition of paddy field existance in year 2024 showed that the area of S2 was lower than S3, and affected the result of modeling scenarios. Instead of preserving only S2 of paddy field, the scenarios showed to better preserve both S2 and S3 in order to maintain the paddy field existance in future years. Eventhough there were no huge different among non scenario, first-scenario and second scenario in term of area, but in term of rice production it would give different result. As rice production was related into rice
sufficiency, thus the amount of paddy field of various scenario would be taken into consideration.
Figure 16 Predicted land use of year 2024 (Scenario 2) Table 12 The total of each land use in year 2024 based on model scenario
Year 2024 Dryland
farming Fishpond Forest Paddy field
Built-up area
Water body Non-scenario
(business as usual)
27 255.42 22 677.03 5 390.46 93 349.58 42 431.24 1 131.39
First-scenario 27 259.68 22 677.83 5 390.46 93 355.79 42 431.97 1 131.39
The Prediction of Rice Sufficiency in Year 2024
Rice self-sufficiency was the comparison between rice production and rice consumption in Karawang Regency. Rice production was calculated based on predicted condition of paddy field in year 2024 at various scenarios. The basis assumption for calculating rice prediction was the constant of rice production per year and cropping intensity. The average rice production of Karawang Regency year 2013 (Bappeda 2014) was 7.46 ton ha-1, but Telukjambe Timur sub-district could yield rice production at 12.25 ton ha-1, thus this production assumed as the highest production and became optimum production of the most suitable land (S1). Based on research of Widiatmaka et al. (2013b) the most suitable land (S1) in Karawang Regency was defined by the sub-district that had the highest rice production, therefore this value used as the optimum production of S1 area in Karawang Regency. The optimum production of suitable land of paddy field (S2) in Karawang Regency was calculated as 60% from optimum production of S1, while optimum production of marginal suitable land of paddy field (S3) was calculated as 40% from optimum production of S1. In term of rice production, cropping intensity define as frequency of crops in each year and can be formulated as comparison between gross cropped area and net area (Maulana 2004). Based on analysis in last three years from 2011, 2012 and 2013 (Bappeda), the average cropping intensity of Karawang Regency was 1.99 and this value would assumed constant in next future years.
The rice consumption was related with total population. Based on anaylsis from last five years data of population from 2009 until 2014 (Bappeda), the population growth rate in Karawang Regency was 1.38%. With the assumption that the population would increase by a fixed growth rate, then population projection conducted by Geometric Projection’s formula could be stated as (Klosterman 1994):
= (1 + ) Where:
Pn : Population at yearn Po : Early population 1 : Constanta r : Growth rate
tn-to : Time span between yearnando
The result of predicted condition of paddy field in year 2024 showed that the contribution of rice production was at 863 261 ton, while the second-scenario would contribute at 863 349 ton while first-scenario would contribute lower at 863 321 ton. The comparison between rice production and rice consumption showed surplus at more than 500 000 ton (for non-scenario, first-scenario and second-scenario). Based on analysis and compare to condition in year 2014 where rice surplus was at 723 572 ton, the surplus at year 2024 was decreasing about 28% or at 205 995 ton. The decreasing of rice surplus would affect the ability of Karawang Regency to fulfill external consumption of other region. Widiatmakaet al(2013b) stated that during 10 years, the ability of Karawang Regency to fulfill external consumption was decreasing at 10%, where this percentage would rise higher in next years.
Figure 17 Projection of population in Karawang Regency
0
Table 13 The comparison between rice production and consumption in year 2024
Year 2024 Production Consumption Surplus
(ton) (ton) (ton)
Non-scenario (business as
usual) 863 261 345 685 517 577
First-scenario 863 321 345 685 517 636
5 CONCLUSION
Conclusion
The result showed that in periode of 1994-2004, dryland farming, forest, paddy field and water body had decreased while fishpond and built-up area had increased. In period of 2004-2014, there were decreasing of forest and paddy field while dryland farming, fishpond, built-up area and water body were increasing. During period 1994-2014 the trend of change showed the tendency of paddy field conversion into built-up area, and paddy field conversion into dryland farming that would be converted next into built-up area. The result of land use prediction of year 2024 showed that there were decreasing of dryland farming, forest and paddy field while fishpond, built-up area and water body were increasing compare to land use condition in year 2014. The total area of paddy field with scenario BAU (business as usual) was 93 349.58 ha; scenario of preservation of S2 area was 93 355.79 ha; scenario of preservation of S2 and S3 areas was 93 358.57 ha.
Recommendation
The driving factor for paddy field conversion in Karawang Regency should be added not only from physical condition of land but also involve the real social and economic activities as the representative of human dynamics.
REFERENCES
Ahmed B, Ahmed R, Zhu X. 2013. Evaluation of Model Validation Techniques in Land Use and Land Cover Dynamics.Int J Geo-Inf. 2:577-595.
Ahmed B, Ahmed R. 2012. Modeling Urban Land Use and Land Cover Growth Dynamicss Using Multi-Temporal Satellite Images: A Case Study of Dhaka, Bangladesh.Int J Geo-Inf. 1:3-31.
Apriyana N. 2011. Kebijakan Pengendalian Konversi Lahan Pertanian Dalam Rangka Mempertahankan Ketahanan Pangan Nasional: Studi Kasus Pulau Jawa [Internet]. [accessed date 2013 March 7th]. Available at http://www.bappenas.go.id/.
[Bappeda] Development Planning Agency at Sub-National Level (Badan Perencanaan Pembangunan Daerah). 2011. Karawang in Figures 2011. Karawang (ID): Badan Pusat Statistik Kabupaten Karawang.
[Bappeda] Development Planning Agency at Sub-National Level (Badan Perencanaan Pembangunan Daerah). 2014. Karawang in Figures 2014. Karawang (ID): Badan Pusat Statistik Kabupaten Karawang.
Center for Agricultural Data and Information System. 2013. Statistics of Agricultural Land 2013. Cakrabawa DN, Hakim ML, Gultom R, editor. Jakarta (ID): Ministry of Agriculture.
Djaenudin D, Marwan H, Subagjo H, Hidayat A. 2011.Petunjuk Teknis Evaluasi Lahan Untuk Komoditas Pertanian. Bogor (ID): Balai Besar Litbang Sumberdaya Lahan Pertanian, Badan Litbang Pertanian.
Eastman, JR. 2003. IDRISI Kilimanjaro Guide to GIS and Image Processing. Massachusetts (US): Clark Labs, Clark University Production.
Fan F, Wang Y, Wang Z. 2008. Temporal and Spatial Change Detecting (1998-2003) and Predicting of Land Use and Land Cover in Core Corridor of Pearl River Delta (China) by Using TM and ETM+ Images. Environ Monit Assess. 137(1):127-147.
Irawan B. 2005. Konversi Lahan Sawah: Potensi Dampak, Pola Pemanfaatannya dan Faktor Determinan [Internet]. [accessed date August 6th2014]. Available at http://www.pse.litbang.pertanian.go.id/.
Jenerette GD, Wu J. 2001. Analysis and Simulation of Land-Use Change in The Central Arizona-Phoenix Region, USA.Landscape Ecol. 16:611–626.
Li X, On Yeh AG. 2001. Zoning Land for Agriculture Protection by The Integration of Remote Sensing, GIS and Cellular Automata. Photogramm Eng Rem S. 67(4):471-477.
Liu JG, Mason PJ. 2009.Essential Image Processing and GIS for Remote Sensing. United Kingdom (GB): Wiley-Blackwell Publication.
Maulana, M. 2004. Peranan Luas Lahan, Intensitas Pertanaman dan Produktivitas Sebagai Sumber Pertumbuhan Padi Sawah di Indonesia 1980-2001. JAE. 22(1):74-95.
Mondal P, Southworth J. 2010. Evaluation of Conservation Interventions Using a Cellular Automata Model.Forest Ecol Manag. 260:1716-1725.
Munibah K. 2008. Model Spasial Perubahan Penggunaan Lahan dan Arahan Penggunaan Lahan Berwawasan Lingkungan (Studi Kasus DAS Cidanau, Provinsi Banten) [dissertation]. Bogor (ID): Bogor Agricultural University. Ozah, A.P., Adesina, F.A., Dami, A. 2012. A Deterministic Cellular Automata
Model for Simulating Rural Land Use Dynamics: A Case Study of Lake Chad Basin.IJEE. 2(1):22-34.
Panudju TI, Bahar I, Nendi, Yafas F, Rahmawati H, Rendasih S, Hidayat AP, Nugroho HA, Iskak, Sulaiman M. 2013.Cetak Sawah Indonesia. Jakarta (ID): Ministry of Agriculture.
Pontius RGJr, Millones M. 2011. Death to Kappa: Birth of Quantity Disagreement and Allocation Disagreement for Accuracy Assesment. Int J Remote Sens. 32(15):4407-4429.
Pontius RGJr, Walker R, Yao-Kumah R, Arima E, Aldrich S, Caldas M, Vergara D. 2007. Accuracy Assesment for a Simulation Model of Amazonian Deforestation.Annual Assn American Geography. 97(4):677-695.
Pontius RGJr. 2000. Quantification Error Versus Location Error in Comparison of Categorical Maps.Photogramm Eng Rem S. 66(8):1011-1016.
Rahdary V, Soffianian A, Naifabdai SM, Khajeddin SJ, Pahlavanravi. 2008. Land Use and Land Cover Change Detection Wildlife Refuge Using Remotely Sensed Data and Geographic Information System.World Appl Sci J. 3(1):113-118. Ritung S, Wahyunto, Agus F, Hidayat H. 2007. Panduan Evaluasi Kesesuaian
Lahan dengan Contoh Peta Arahan Penggunaan Lahan Kabupaten Aceh Barat. Bogor (ID): Indonesian Soil Research Insitute and World Agroforestry Centre. Samat N, Hasni R, Elhadary YAE. 2011. Modeling Land Use Changes at The
Peri-Urban Areas Using Geographic Information Systems and Cellular Automata Model.JSD. 4(6):72-84.
Septiana A, Iswati A, Panuju DR. 2013. Paddy Field Land Use Dynamics in Karawang Regency and Its Relevancy with Regional Urban Land Use Plan [Internet]. [accessed date 2013 June 27th]. Available at http://pwk.undip.ac.id/. Sudaryanto T, Rusastra IW. 2006. Kebijakan Strategis Usaha Pertanian Dalam
Rangka Peningkatan Produksi dan Pengentasan Kemiskinan. Jurnal Litbang Pertanian. 25(4):115-122.
Tang J, Wang L, Yao Z. 2007. Spatio-Temporal Urban Landscape Change Analysis Using The Markov Chain Model and A Modified Genetic Algorithm. Int J Remote Sens. 28(15):3255-3271.
Trisasongko BH, Panuju DD, Iman LS, Harimurti, Ramly AF, Anjani V, Subroto H. 2009. Analysis of Dynamics Land Conversion Around Toll Lanes in Cikampek. Jakarta (ID): Technical Publications of DATIN, Ministry of Environment and Forestry.
Veldkamp A, Lambin EF. 2001. Predicting Land Use Change.Agr Ecosyst Environ. 85(1):1–6.
Veldkamp A, Verburg PH. 2004. Modeling Land Use Change and Environmental Impact.Environ Manage. 72(1):1-3.
Weng QH. 2002. Land Use Change Analysis in the Zhujiang Delta of China Using Satellite Remote Sensing, GIS and Stochastic Modeling. Environ Manage. 64:273-284.
White R, Engelen G. 2000. High-Resolution Integrated Modelling of The Spatial Dynamics of Urban and Regional Systems. Comput Environ Urban. 24(1):383-400.
Widiatmaka, Ambarwulan W, Munibah K, Santoso PBK. 2013a. Analisis Perubahan Penggunaan Lahan dan Kesesuaian Lahan untuk Sawah di Sepanjang Jalur Jalan Tol Jakarta-Cikampek dan Jalan Nasional Pantura, Kab. Karawang. Inside:Prosiding Seminar Nasional dan Forum Ilmiah Tahunan Ikatan Surveyor Indonesia; 2013 October 31; Yogyakarta. Yogyakarta (ID): Sekolah Tinggi Pertanahan Nasional. Pg:7-11.
Widiatmaka, Munibah K, Firmansyah I, Santoso PBK. 2013b. Land Suitability Evaluation for Paddy Using Automated Land Evaluation System in a Paddy Production Center, North Karawang, West Java Province. Inside: Prosiding Seminar Hasil-Hasil PPM IPB 2013 Vol.II; Bogor. Bogor (ID): Bogor Agricultural University. Pg:478-492.
Widiatmaka, Hardjowigeno S. 2007.Evaluasi Kesesuaian Lahan dan Perencanaan Tata Guna Lahan. Yogyakarta (ID): Gadjah Mada University Press.
Karawang [Internet]. [accessed date 2015 May 31th]. Available at http://agribisnis.fp.uns.ac.id/.
Wood SR, Dent FJ. 1983. Land Evaluation Computerized System (LECs) User Manual and Methodology Manual. Bogor (ID): Indonesian Agriculture Environment Research Insitute.
Xie Y, Mei Y, Guangjin T, Xuerong X. 2005. Socio-Economic Driving Forces of Arable Land Conversion: A Case Study of Wuxian City, China.Global Environ Chang. 15:238–252.
CURRICULUM VITAE
Indrian Rizka Amalia was born in Manokwari, West Papua, Indonesia on January 10th, 1989. She was the first daughter of four children of Ir.Sudjarwanto and Dasfini, SH. Indrian finished her Bachelor Degree at Department of Biology, Brawijaya University in year 2010. She registered as graduate student at Study Program of Information Technology for Natural Resources Management, Graduate School of Bogor Agricultural University (IPB) in year 2011 and had graduated in year 2015 with thesis entitle “Modeling of Land Use Change of Paddy Field in Karawang Regency Using Cellular Automata-Markov Chain”. During her study in
IPB, she was an practial assistant for lecture of “Introduction of Programming” and “Decision Support System”. She also participated in“International Winter Course for Practical Agricultural Sciences towards Regional Sustainability” program that